
In these times I don’t, in a manner of speaking, know what I want; perhaps I don’t want what I know and want what I don’t know.
—Marsilio Ficino
2.4

THE PERFECT CRIME—UNPLANNED WORK

Los Angeles, 2013
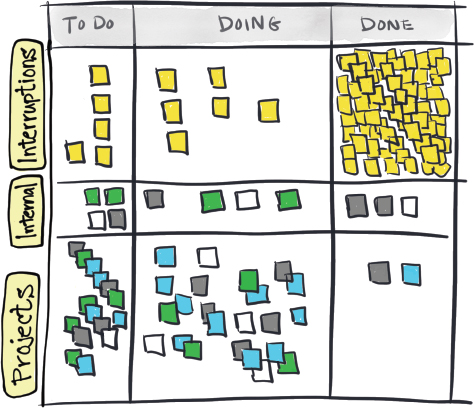
I asked two IT project managers responsible for supporting the team of forty-one engineers what prevented them from getting work done. Their immediate response was constant interruptions. They were being bombarded with project status questions from other teams and product owners. So, we conducted a one-week experiment to capture interruptions. Every time an interruption occurred, they wrote it down on a yellow sticky note and placed it in the top lane of a four-by-six-foot mobile board on wheels (Figure 17).
Figure 17. A Study in Interruptions
The yellow stickies flowed across the top swimlane. Green sticky notes recording internal team improvements and other work impacting the project mangers (represented by miscellaneous colored stickies) drifted across the middle swimlane. And in the bottom swimlane, multiple colors of stickies represented the different projects they managed. At the end of the week, we counted ninety-two yellow stickies. Ninety-two! Most came from walk-up traffic asking about project status. The project manager’s primary internal customers, the product owners, were in the dark about the status and number of projects.
For the first time, the product owners could see the other projects competing with their own. And, importantly, they could understand why another project might be prioritized higher. They could also see for themselves the destructive nature of their interruptions. On the flip side, the project managers could see how little visibility the product owners had regarding the state of their project. The experiment also served as a chance to try out one board design before committing to a design using an electronic tool that is not be easy to change.
Visualizing interruptions is quite useful for exposing Thief Unplanned Work. Figure 18 shows another way to visualize interruptions. This team placed a pink dot on their work item every time that work was interrupted.
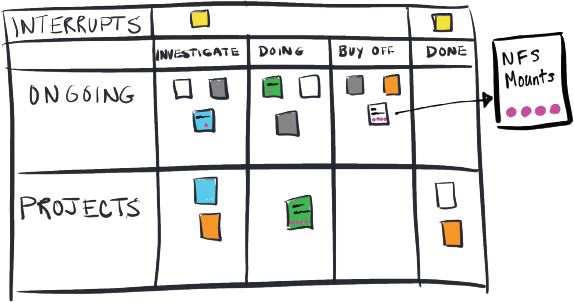
Figure 18. A Study in Pink Dots
The pink dots gave them a quick way to visualize how interruptions impacted a strategy used elswhere is the grawlix string ( ) that shows the interruptions in an amusing manner.
Here’s how it works. Each time work is interrupted, add one grawlix to the ticket on the board. The longer the grawlix series on the ticket, the longer the lead time and (presumably) the more irritated the engineer.
It would be interesting to compare the grawlix count on work that is considered fun and engaging versus work that is not fun. I can imagine a ticket with work that no one wants to do (say a legacy system with a fun factor of zero or some tedious maintenance job) having an extremely long grawlix string.
Ours is a world filled with uncertainty, where everything is always changing. Sometimes we just don’t know what we want or need until we see it. It’s why there will always be unplanned work and why we need to plan for unplanned work. Because unplanned work can wipe out your objectives, unplanned work deserves visibility. All of us perceive a situation through the experience of our senses.
The board in Figure 19 exposes the experience of unplanned work visually. It’s hard to repair invisible problems. Making work problems visible helps uncover the unknowns. Some of these may be scary to see, but once they’re out in the open, the problems can begin to get fixed. As mentioned before, kanban may scare away the meek but is well suited for those with the courage to face issues, adapt to change, and fix problems.
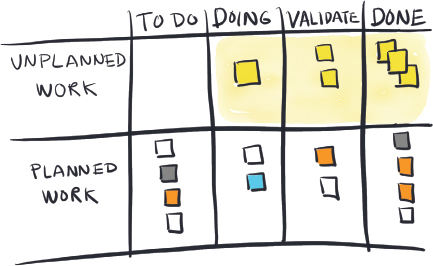
Figure 19. Expose Unplanned Work
Think of this board design as a way to visualize things that interrupt your week or ruin your day, things that take you away from delivering important business value because you are busy putting out fires. This unplanned work flows through its very own swimlane. A card is created for every piece of unplanned work.
There’s usually resistance to this in the form of Platform Operations Manager Erik, who says, “I don’t have time to create a ticket every time I get interrupted!” But after weeks of interruptions, the CIO wants to know why Azure isn’t up and running in production. And what does Erik say? “We’ve been busy.” This is the problem—there is no evidence of the issues preventing Erik from completing the platform work. It’s a perfect crime. And Thief Unplanned Work goes home and collects $200 by passing go. When unplanned work is made visual, other people can see it and understand why work isn’t done—and steps can be taken to prevent, or at least limit, unplanned work from taking over in the future.
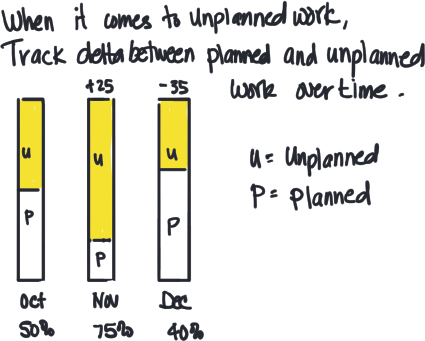
Figure 20. Monthly Delta Trend for Unplanned Work
Knowing the ratio of unplanned work to planned work helps when planning your workload capacity. Why? Because you’ll have an idea of how to set WIP limits to accommodate important, unexpected, and urgent work. If every week there is 25–50% unplanned work, then allocate 25–50% of your WIP for potential unplanned work. Here’s a way to do this:
Note that we are talking about the amount of WIP here and not the amount of time. Allocating time is a different animal. Sometimes you hear managers tell people, “Allocate 50% of your time to do blah, blah, and set aside 25% of your time to do blah.” But how do you really do that? You are a rare bird if you are fortunate enough to have a wide-open calendar which allows you to schedule half your day (say four hours) on blah, blah and a quarter of your day (say two hours) on blah. Because much of the day is likely sliced up with meetings, email, and context switching between tasks, getting two hours of uninterrupted time to work on anything can be a luxury.
You may be thinking that allocating your workload (your capacity) by WIP limits won’t fly because your work items aren’t all the same size. This is an area where size doesn’t really matter because you can only work on so many things at a time. It doesn’t matter how big or small something is when you can only truly focus on one thing at a time. It could be as small as a mouse or as big as an elephant (metaphorically speaking). When it’s done, you move on to the next thing.
Interruption Busters
Try these strategies to create a consistent format for managing your time when tackling the challenge of making unplanned work visible:
 The goalie: Someone designated to run interference for the rest of the team. It is a rotating role, with the dual purposes of protecting others from interruptions and cross-training team members.
These four strategies create consistency that help your team see when you’re tackling your WIP.
During the 1960s, the coffee cart at HP rolled around at 10:15 every morning. All the engineers drank coffee and casually discussed top-of-mind issues. It was a goldmine condition that generated spontaneous collaborative advances. A lot of problems got unstuck at the coffee cart. In the 1970s, cost-cutting decisions were made to replace the coffee cart with a self-service coffee pot on the counter in the mini kitchen. Engineers still took a break to get coffee but not at the same time. No more set coffee break, no more spontaneous brainstorming. Gone were the unplanned collaborative developments—all in the name of cost savings. Some felt it was the beginning of the end for the great days of HP research and development.2
Just as regularly scheduled rendezvous (same place, same time) work as a catalyst for frequent dialogue on top-of-mind issues in need of discussion, consistency of work times and break times help establish habits to minimize interruptions. Consistency signals to people when they can have your attention and when they cannot. Consistency helps to minimize the damage from unplanned work.
EXERCISE

The Interruption Reduction Experiment
PURPOSE: To reduce damage from interruptions using empirical evidence.
 Time: 45 to 60 minutes
MATERIALS:
INSTRUCTIONS: Gather the team to discuss ways to reduce the cost of interruptions. These might include having a goalie, scheduling office hours, scheduling do not disturb hours, and using pomodoros or a variant involving dedicated ninety-minute sessions. Which of these methods might apply to your team and why?
Come up with a hypothesis and experiment for a week. Regroup after the experiment to discuss your observations on the impact of the experiment on your team. What worked and why? What didn’t work and why?
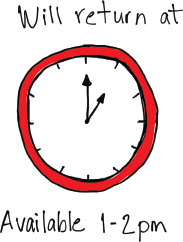
For example: Hypothesis—scheduling office hours will reduce interruptions. Schedule office hours from 1–2 p.m. on Monday, Wednesday, and Friday. Let everyone know you are available during these hours for impromptu questions. This signals people (creates a visual) when you are available and when you are closed for business.
KEY TAKEAWAYS