
Many things may be important, but only one can be the most important.
—Ross Garber
2.5

PRIORITIZE, PRIORITIZE, PRIORITIZE

Los Angeles, 2013
The six-by-four-foot mobile experiment board on wheels was positioned directly next to the project managers’ desks and coincidently, but conveniently, positioned alongside the main footpath between the entrance to the engineering space and the kitchen. Everyone had to pass this board on their way to their desk in the morning and on their way out to lunch/coffee/home. It caught people’s attention. Product owners studied it to see if they could find their projects on it. Scrum masters stared at it—unsure what it was all about. IT Ops Engineers darted glances at it with the uncomfortable familiarity and commiseration from being overwhelmed by massive interruptions that the interruption experiment exposed.
The visibility on interruptions was attention getting—and not just because it captured how often people were poking their heads into offices with unplanned requests but because it also showed the lacking prioritization policy.
Returning to interruptions, the opening experiment with the two IT project managers from the previous section—the one that captured interruptions—was deemed a success by the IT Ops Project Managers for several reasons:
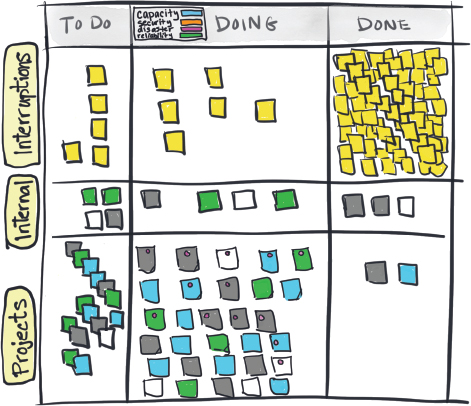
So, the experiment continued for a second week. This time, we cornered the lead engineer into stack ranking the thirty-three projects. He gave it his best shot. We were delighted to finally see that as he worked on it, we saw some prioritized order (Figure 21). But shortly after, the VP came by and disagreed with the priorities. This forced a necessary conversation, which was good, because the rationale behind how value was determined (at least from the VP’s perspective) was now transparent.
Figure 21. An Experiment in Tagging and Prioritizing
This is the power of placing a four-by-six rolling visual along the main route for both the department entrance and the very important coffee room. It’s unavoidable. The eye is drawn in and people stop to ponder. It provokes essential communication that would otherwise be conveniently dodged.
After that discussion happened, the projects were reprioritized based on the VP’s input, a classic prioritization strategy known as HiPPO (highest paid person’s opinion). And then an interesting thing happened. The next day, four new projects appeared, seemingly out of thin air, in the top right corner, all vying for the priority one slot. Thief Conflicting Priorities scored big that day, chuckling at the resulting drama created by inserting more chaos. (I wish we’d had a webcam aimed at that board; it would have been interesting to see how they got there.)
Beware the lack of good rules for prioritization—remember, when everything is a priority one, nothing is a priority one.
As always, it is possible to get out of this mess by employing the key concepts we’ve been building upon in this book—namely exposing time theft by making work visible.
For example, propose a prioritization strategy to kick off the conversation. You might use the A3 thinking process to do this. A3 is a problem-solving approach using an international 11 x 17 inch (297 x 420 millimeters) piece of paper. (A3 gets its name from the size of paper of the same name). A3 encourages precise communication in an effective structure that cultivates understanding and agreement. One result of using A3 is that various options can be investigated and floated across the organization in a diplomatic fashion.
Because the A3 method helps you get understanding and agreement, it can be used to discuss prioritization methods. The goal with prioritization is to determine what to complete next in order to get maximum value in the shortest amount of time and to avoid multitasking due to competing priorities.

Figure 22. A3 Example
There are several ways to prioritize. Let’s look at some of the more common methods:
There are many ways to prioritize work. The above list shows just some of the options.
Swinging back around to the LA IT Ops Engineering team that we opened the section with, notice how their prioritization approach evolved from, “Do all the things” to the lead engineer’s opinion of what was a priority to the VP’s or another executive’s opinion of what was a priority—the HiPPO approach. If the VP or other executive has sufficient knowledge and experience, it is possible that their prioritization can be good enough. But problems occur due to their cognitive bias, misaligned goals, or overconfidence. We are often confident even when we are wrong,1 and it can be hard for us to see when we are wrong. This is why making prioritization policies visible is vital—it drives the right conversations for delivering ideal outcomes.
In Part 1, clues were provided for detecting when Thief Conflicting Priorities is stealing your time. They include:
Remember: Thief Conflicting Priorities is a close cousin of Thief Unplanned Work, which produces questions like:
Here’s one way to see the things that conflict with each other. Unplanned expedited work, project work, maintenance work—it’s all competing with each other. When work goes on hold because someone says you need to do this other thing now, show that in your visibility efforts. Show that implementing the new security vulnerability fix got deprioritized because people had to do merit reviews. The idea is to make prioritization rules explicit. Otherwise, how are they made? By the loudest, most aggressive person? By the highest paid person?
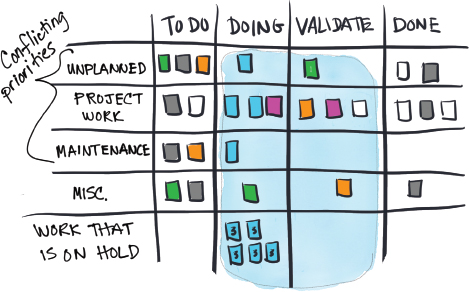
Figure 23. Exposing Conflicting Priorities
Work takes a long time to complete because it sits in queues waiting for stuff to happen. It’s not unusual for wait times to be more than 80% of the total time. Many organizations are blind to the queue problem. They tend to focus on resource efficiency instead of applying systems thinking to improve the efficiency of the whole system, end to end.
Cost of Delay (CoD)
Priority is only a problem when things aren’t delivered in the desired timeframe. We know that trying to do everything at the same time increases the risk of delaying everything. And we know that choosing to work on one task puts other tasks on the back burner and causing their delay. The goal, then, is to understand what work should be completed next in order to achieve the best possible outcomes. Quantifying the cost of the work that gets delayed is useful.
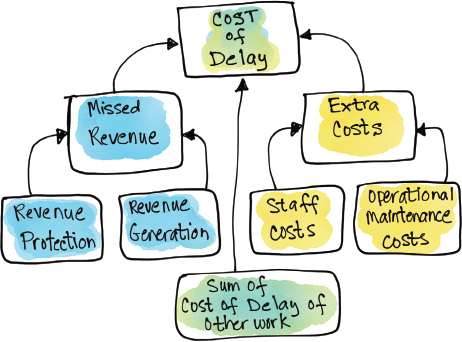
Figure 24. Inputs That Contribute to Cost of Delay
As mentioned in Section 1.1, cost of delay is a measure of the impact of time on the outcomes desired. CoD boils down to three things:
Let’s take one of the thirty-three projects from the IT Ops Engineering team board, “Build out New Datacenter (BoNDC for short) to understand how the CoD could be calculated.” Part of the Done criteria for Project BoNDC is for the old datacenter to close. Hence, the costs to keep the old datacenter running need to be included.
Old datacenter costs include floor space rental, power, heating and cooling, operating costs, and maintenance totaling $7,400/week. Additionally, a project manager spends 20% of their time managing the transition to the new datacenter: $400/week. Also included in the CoD is the CoD of Project P, which will improve performance but it is dependent on the completion of the new datacenter: 8 engineers (50%) × $2,800/week = $22,400/week. Furthermore, the cost savings from Project P (due to automation of manual processes) = $8,600/week.

Figure 25. Cost of Delay
The weekly CoD of BoNDC is $38,800/week. If BoNDC is delayed six weeks, the total CoD is $230,400.
CoD can be used to negotiate prioritization of work and to bring visibility to projects that have a bigger impact on the bottom line than the others. Visualizing CoD drives the right conversations and decisions around cost and revenue. As Joshua Arnold, thought leader and founder of Black Swan Farming, says,
Cost of Delay combines urgency and value—two things that humans are not very good at distinguishing between. To make decisions, we need to understand not just how valuable something is, but how urgent it is.2
Hence, CoD communicates the impact that time has on value. Value usually means money, but not always. A non-profit health organization may consider value as the number of lives saved. Work then is prioritized based on the highest business value returned (economic or otherwise) rather than the theoretical ROI.
CoD considers all the impacts to what generates new revenue, what protects existing revenue, and all the expenses associated with running an organization.
Simply put, CoD has to do with two constantly changing variables: value and time. CoD asks the question, “What value is lost by the delay of something? How much will we lose if we deliver this thing twelve months later?”
The Line of Commitment
The line of commitment is a vertical line before a specific state that signals a commitment on your part to do the work. The tasks in the backlog are options, and they may never get done. But once work passes the line of commitment, it explicitly signals that it’s been prioritized and is moving forward. It is no longer an option but a fully agreed upon and prioritized piece of work.
There is no second-guessing once work passes the line of commitment. The work will happen—and it will have a cost. How high the cost is depends on how long it’s delayed due to the competition with other planned and committed work all vying for the same people’s attention and resources.

Figure 26. Line of Commitment
EXERCISE

Visualize Priorities
PURPOSE : To help you bring visibility to competing priorities and bring clarity to how work is prioritized. Most organizations have too many top priorities to achieve the level of focus they need in order to succeed.
 Time: 60 minutes
MATERIALS:
INSTRUCTIONS: Ensure those impacted have a voice in the discussion. Time-box each person’s comments to no more than five minutes.
Questions to discuss:
KEY TAKEAWAYS