
Be approximately right rather than exactly wrong.
—John Tukey
3.1

YOUR METRICS OR YOUR MONEY

Here, we’re going to be using metrics to set better expectations for our customers, who always seem to be criticizing the length of time things take to complete and complaining that they can’t see the progress of their requests, since making work visible is the secret to exposing the time thieves and all the havoc they wreak on you and your organization. Capturing data for metrics can help you become the voice of reason and prompt change in your organization. Metrics get attention.
Because many teams use arbitrary due dates to set expectations and then ultimately fail to hit that deadline, it’s time to try a smarter approach. Namely, a probabilistic approach.
For those of you panicking at the idea of no due dates, know that they are appropriate in some situations. The characteristics that inform us of whether a due date is arbitrary or not depend on the lens that we look through.
The 2018 FIFA World Cup, scheduled to start June 14, 2018, is one such example of a real due date. So is a scheduled security audit with the federal government.
A date that the CFO selects to roll out a new CRM system so that half the Accounting team can be laid off is a suspect due date. A change to a UX enhancement? Almost certainly arbitrary. It probably does not matter that much if it ships on Tuesday or on Thursday or even next week on Monday.
If expectations are set correctly, not everything needs a due date. Being predictable is what counts. Being predicable saves time.
Becoming more predictable means we need to talk about probability and how, once we are able to shift to a more probabilistic approach, expectations around timeframes can be improved. It’s all about the expectations. Setting better expectations makes leadership happy and helps make those uncomfortable stand-ups and retrospectives surprisingly fun.
Good metrics help us to see progress and understand how long things really take. This is important because the biggest complaint heard from technology customers is that things take too long. With metrics, we can demonstrate just how long things actually do take and then extrapolate on why they took so long.
Again, the problem usually starts with an arbitrary due date. That due date (often based on faulty estimates) sets the wrong expectation and then, despite all our best efforts, everything goes to hell because of conflicting priorities, unknown dependencies, and that curveball unplanned work, which always comes out of nowhere.
Everything takes longer than we think it will, especially if the work is complex. Hofstadter’s Law is a statement mocking the accuracy of estimating completion for tasks with substantial complexity.1 (It always takes longer than you expect, even when you take into account Hofstadter’s Law.) We know this is true from our own experience. When you request something, how often do you receive it earlier than expected? If you frequently do, call me—I want to come work for you.
Throughout my career, no matter my role or what company, feedback from customers has invariably noted that projects take too long to complete, new features take too long to be delivered, and new cloud computing platforms take too long to get set up. Everyone wants stuff sooner than they get it, and everyone is unhappy about the delays. Yes, that is the time thieves cackling to themselves in the background as they capitalize on our distress.
The cascade of delays once a due date has been determined (often by a sales or marketing executive), usually starts with the Development team. While they begin the process thinking they have sufficient time to develop and deliver the feature, all too often they fall behind as things don’t go as planned. Maybe they didn’t know about the dependencies on another web team, or they didn’t expect their relational database management system to be so limiting, or they hadn’t planned on their core API developer getting sick. Whatever the cause, they begin to miss due dates when these unanticipated obstacles prevent them from staying on schedule.
Further delays happen in Operations, such as when a change that was promised to have zero impact on production actually does have an impact, or when the database upgrade usurps an important cross-team planning session, or when the automation engineer leaves to pursue their PhD in physics.
It’s tough to make decisions about delivery timeframes and due dates in the absence of compelling evidence. A lack of data often leads to people making decisions based on opinions, which are likely to be more problematic than decisions based off of good data (i.e., visible work). Would you rather take the advice of a licensed structural engineer with ten years of seismic retrofitting experience or your brother-in-law accountant who swears that his DIY retrofit method is best? This is why metrics are so useful—they help us make good decisions.
Imagine trying to fly a plane without a fuel gauge, compass, or airspeed indicator. How risky would that be for a pilot? There’s a reason for all those flight instruments in the cockpit. Without them, the pilot would have a hard time getting information about the fuel level, airspeed, and direction, which in turn would impact the flight tower as they try to guide multiple planes in for landings. Similarly, lack of visible data in IT makes us blind to problems because we don’t have anything to tell us how we are actually doing. When we can’t see the problems, it’s hard to analyze them, which in turn makes it difficult to know what direction to take. This is what good metrics do—they steer us in the right direction.
When it comes to forecasting how long things are going to take (remember Hofstadter’s Law), it’s useful to look at metrics that measure progress instead of activities. Some of the best metrics that show actual progress (or lack thereof) are lead time, cycle time, WIP, and aging reports. For the rest of this section, those are the metrics we will concentrate on.
Flow Metrics
The boss (or the customer/spouse/teacher/coach) wants to know when X will be done. The way many people go about answering this question is to determine how long each step of the process will take and then add them all up. Usually, a contingency buffer is added in for good measure because things always take longer. Humans are predictably horrible at estimation, even in their area of expertise, myself included.
I estimated that the seismic retrofit my husband and I did in our basement would take four weeks—it took six weeks. We didn’t consider scenarios such as how long it would take us to replace gas and water pipes in need of conversion from hard metal to flexible hoses, even though we’ve previously done lots of gas and water pipe work in the past.
Optimism is a near universal human trait when it comes to answering the question “When will it be done?” Software estimates are no different. Developers present optimistic estimates that management approves because of the implied achievable business targets. Furthermore, we take on more work because we are an optimistic bunch—it’s one of the five reasons for saying yes that were mentioned in Part 1.
The problem with the traditional estimation process (add up how long each part of the process will take and then add a buffer) is that each step in a process on its way to completion is clouded with uncertainty. Each step is vulnerable to distractions from Thief Unknown Dependencies, Thief Unplanned Work, and Thief Conflicting Priorities, along with holidays, snow days, and about a million other things. Estimates are filled with more uncertainty than confidence.
The estimation process matters because, traditionally, people are held accountable for notably horrible estimates when projects fail to be delivered on time, which is most of the time. The No Estimates movement gains momentum daily as more and more projects finish late and more and more staff fail to meet their goals. What to do? Look to flow time for help.
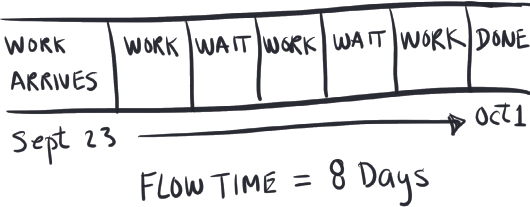
Flow time is a measure of how long something took to do from beginning to end. You might be thinking, “Wait, that’s cycle time.” And you’d be right. Although—it depends on the context as to which definition you use. Depending on whom you ask, cycle time has different meanings, which I’ll get to shortly. Just know that cycle time is an ambiguous term and that’s why I prefer to use flow time when discussing speed metrics in general, because it is attuned with Lean. It’s actually a main pillar of Lean. The term “flow time” has been around for a while—I didn’t make it up.
Flow time has a start time and an end time. That’s all. Flow time doesn’t stop the clock just because the weekend rolls around. It doesn’t do start and stop, start and stop, start and stop. What flow time does do is quantify the probability of completing x% of work in so many days.

Figure 38. Flow Time Metrics
Collecting historical flow times that show, for example, that 90% of a certain type of work gets delivered within ten days allows us to say that nine out of ten times, we deliver these kinds of requests within ten days. We know then that there is a 10% probability that some work will take longer. This is important because it helps us become more predictable with our customers.
Lead time and cycle time are types of flow time metrics. They both measure duration. Using pizza order and delivery as an example, the lead time clock starts ticking when the customer orders the pizza, while the cycle time clock doesn’t start ticking until the cook begins making the pizza. People who order pizza care about lead time. They want their pizza delivered quickly. Internal teams care about cycle time. They try to reduce the wait time in the delivery pipeline to be more efficient. Lean organizations optimize for speed and effectiveness.

Figure 39. Lead Time and Cycle Time
Traditionally, in a manufacturing sense, cycle time is calculated as a ratio resulting in the average time between completion of units. For our purposes, I’m defining it as the elapsed time from when you start work until the completed unit has been delivered to the customer. This is how many software technology organizations define it. Like lead time, cycle time also quantifies the probability of when work will be completed. The clock just starts ticking later. Cycle time is important because it reveals how long things take internally once work has been started. One can see how waiting on dependencies from other teams can impact the schedule.
The odds of being predictable decrease when WIP constantly in-creases and flow times elongate. Remember—WIP is a measure of how many different things are being juggled at the same time. Unlike most other metrics, WIP is a leading indicator. The more WIP there is in the pipeline, the longer things take to complete, period. We can look at Little’s Law to understand the math behind why WIP extends completion times. Recall that lead time equals WIP over throughput. Given WIP is the numerator of that fraction, we know that when WIP goes up, so does lead time. Algebra and theory aside, the proof is in measuring the day-to-day experience.
Little’s Law comes with some assumptions though. Daniel Vacanti talks about these in his book Actionable Agile Metrics for Predictability: An Introduction. He discusses how the true power of Little’s Law lies in understanding the assumptions necessary for the law to work in the first place.2 All metrics are based on assumptions, and Little’s Law is no different. All you have to do to discredit a metric is to question the assumptions. In order for your metrics to be taken seriously, carefully consider and identify the assumptions in place.
A Training team that concentrates together on producing training materials progresses faster on the training collateral during weeks when they are not also traveling to customer sites and speaking at conferences. A Marketing team progresses faster when they work on seven initiatives at one time instead of thirteen. College students finish their homework sooner when they take two classes instead of three classes. One can argue that it depends on the complexity of the work. The homework for three freshman-level classes may take less time to complete than the homework for two graduate-level classes, and this is why categorizing types of work is important. When work is categorized, you can get fancy and obtain WIP reports for each work category, which in turn can improve your WIP allocations.
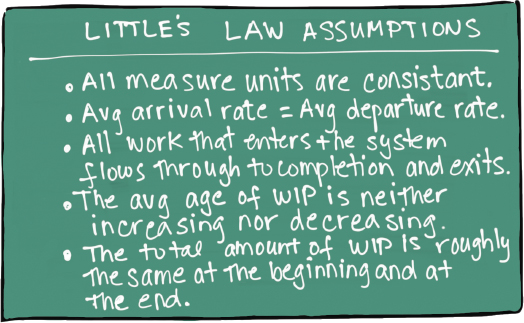
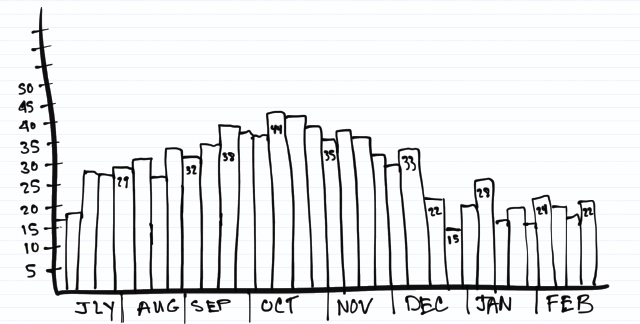
Figure 40. The WIP Report
Queuing Theory
Why do some doctor’s offices always have long wait times and others don’t? Is it because the busy doctors are better and have more patients? In my observation, that hasn’t been the case. I’ve waited just as long for a crappy doctor as for good doctor. I once waited an hour for a doctor to tell me there wasn’t anything I could do to improve my atrophied quad muscles after dislocating my kneecap.

I’m convinced now that the doctor’s offices that don’t have long wait times are the ones that understand why 100% capacity utilization doesn’t work.
There is a direct correlation between WIP and capacity utilization. Capacity utilization is the percentage of the total possible capacity that is actually being used. If the doctor is in the office for ten hours and has ten hours of scheduled appointments, then she is considered to be fully loaded at 100% capacity utilization. If she is in the office for ten hours and has seven hours of scheduled appointments, then she is loaded at 70% capacity utilization.
What happens when a customer with a sore stomach calls and needs to be seen that day? We’ve all been there, right? I’ve been there. We’re sitting in the waiting room for thirty minutes for an appointment we made two days before, when someone new walks in, checks in, and sits down. Another ten minutes pass, and the receptionist calls in the new guy before me. Those of us who have now been waiting for forty minutes roll our eyes at each other, sigh, and grumble internally about how this is forty minutes of your life you can’t get back.
Attempting to load people and resources to 100% capacity utilization creates wait times. The higher utilization, the longer the wait, especially in fields with high variability, like IT.
Note that when I say “variability,” I refer to a lack of consistency and how things are subject to change, such as an unexpected event. An example is when Thief Unplanned Work disrupts your deployment, and a network switch goes bad, taking out 200 or 2,000 servers. Or when someone hacks their way onto our now unsecure DB servers. Or when Brent calls in sick—and cuts in line ahead of us at the doctor’s waiting room!
Unpredictable events cause variability, and the more variability, the more vulnerable we are to capacity overload. The more people and resources are utilized, the higher the cost and the risk. Computers stop responding when they get close to 100% utilization. Freeways clog up and slow way down when they are fully utilized. I like to think that good doctor’s offices understand queuing theory and allow for variability for the drop-in patients. The more a person or resource is utilized, the bigger the lines (queues) get. And while it’s intuitive at some level, there is some science behind it.
It’s called queueing theory. When we look at the math, we can see why the single most important factor that affects queue size is capacity utilization. The reason we care about queue size is because the bigger the queue, the longer things take. What I’ve drawn is the curve described by the Kingman’s formula (an approximation for the average waiting time in a queue). What it shows is the relation between utilization and wait time (Figure 41).
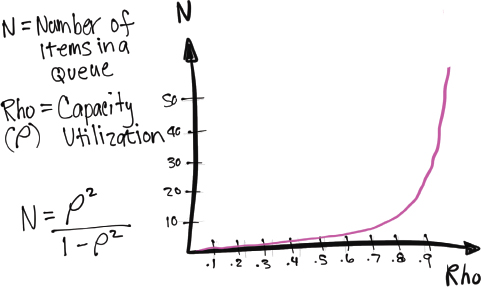
Figure 41. Queuing Theory
Queueing theory is a field of applied statistics that studies waiting lines. It allows us to quantify relationships between wait times and capacity utilization, even when arrivals and service times are highly variable. If requests arrive faster than the system can service them, they queue up.
As we move from 60–80% utilization, the queue doubles. As we move from 80–90% utilization, the queue doubles again. And again from 90–95%.3 Once we get past 80% utilization, the queue size begins to increase almost exponentially, slowing things down to a grinding halt as it pushes 100% capacity utilization.
Have you ever worked for a company that has a 20% “creative” time policy? I’ve read that the main reason they do that is not for innovation (that’s just a bonus) but to keep capacity utilization at 80% rather than at 100%.4 In 1948, 3M gave its workforce 15% slack time, which years later resulted in sticky notes.5
We don’t let our servers get to 100% capacity utilization, so let’s not do that to ourselves.
Watch the Work, Not the People
Aging reports reveal how long work has been sitting in the pipeline not getting done (Figure 42). Looking at the work that’s been in the system for more than sixty days (or ninety or one hundred twenty days) shines a valuable light on how much waste is in the system.
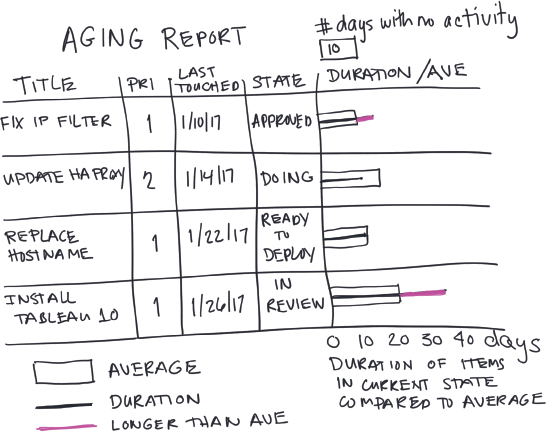
Figure 42. Aging Report
When people describe situations in the absence of compelling evidence in order to persuade others to agree with them or take some kind of action, they’re relying on their own credibility. Depending on the dynamics of the team, this kind of anecdotal evidence can lead to doubt, skepticism, or even suspicion. And this is why quantitative measures are good—they are usually more accurate than personal perceptions and experiences. Good metrics help us make good decisions.
When it comes to efficiency, time is wasted when there is too much focus on resource efficiency overflow efficiency.

Figure 43. Flow Efficiency
Good metrics help others see a clearer picture and help set more accurate expectations when it comes to questions like, “When will it be done?” Due dates don’t take wait time into consideration. And the problem is usually not in the process time—it’s in the wait time. Focus on the wait time and not on the process time. What should the batch size of items be for delivery purposes? What is the optimal delivery rate?
There are two factors involved in this that we need to look at:
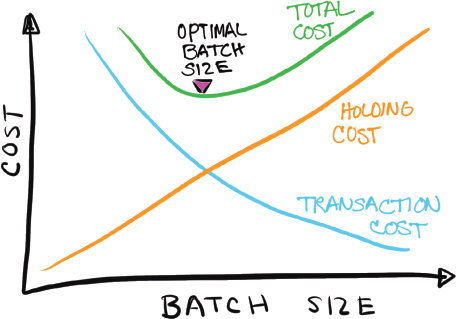
Figure 44. Optimal Batch Size
The optimal batch size for delivery then depends on the combination of the impact of economies of scale and the cost of delaying responses (holding cost and transaction cost).
Some people have a bias for large batch sizes because of the concept of economies of scale. Economies of scale is the cost advantage that arises with increased output of a product. The cost advantage is seen in some areas of manufacturing. Boeing produces large quantities of a single product on its assembly line. The transaction cost to create airplane engines needed for just one airplane at a time is too high, so they create a larger batch of engines at one time to reduce the associated overhead cost.
Focusing on efficiency produces better cost accounting results for large batch-size projects, such as manufacturing commercial airplane engines or publishing books. In knowledge work, however, problems with coordination costs grow nonlinearly with batch size. Old school management assumptions about economy of scale do not apply to knowledge work problems such as software development.
My little wood stove is working better for me now, even though I didn’t replace it with a new, bigger stove. I changed my working routine to Pomodoro style working sessions and set a timer for thirty to forty-five minutes where I focus heads down until the ringer goes off. Enough hot coals remain in the stove that I can keep the fire going by tossing in more wood. Then I have another thirty to forty-five minutes of “don’t interrupt me” time. This little break of three to five minutes helps me more than I realized.
I stand up and stretch, evaluate how much I accomplished (or didn’t), and am inspired to do better with the next thirty to forty-five minutes. Previously, when working in ninety to one hundred twenty minute chunks of time, I’d let myself spend too much time on things that were not essential. The shorter window provides a sense of urgency to get something done faster, and it encourages me to break down work into smaller chunks. Ultimately, I am more efficient.
Imagine you’re grocery shopping for bananas. If you buy a six-month supply of bananas at one time, your transaction cost is low, but most of the bananas will be rotten within ten days, so you’ve wasted money. If you buy a one-day supply of bananas at one time, they won’t rot, but your transaction costs will be high, because you’ll be grocery shopping every day. Somewhere in between is the right batch size of bananas.
The reduction of batch size is a critical principle of Lean manufacturing. Small batches allow manufacturers to slash work in process and accelerate feedback, which, in turn, improves cycle times, quality, and efficiency. Small batches have an even greater advantage in software development because code is hard to see and spoils quickly if not integrated into production.
One of the best predictors of short lead times is small batch sizes of work. The average amount of current WIP is directly proportional to batch size. Like WIP limits, small batch size is an enabling constraint. Work batched up in smaller sizes constrains the amount of work needed to be completed before receiving feedback. Faster feedback makes for a better outcome.
Small batch sizes enable fast and predictable lead times in most value streams, which is why there is a relentless focus on creating a smooth and even flow of work.
When you can implement the practices above in your work and life and show how these practices save you time, money, and stress through metrics, you are more able to proactively banish the time thieves from your sphere.

KEY TAKEAWAYS
