
Tell me how you measure me and I’ll tell you how I’ll behave.
—Eliyahu Goldratt
3.5

BEASTLY PRACTICES

I decided to throw this section in as we near the end because there are some things that must be said in the spirit of full disclosure, but I didn’t want to scare you away with my opinionated messages at the beginning. Nonetheless, I wanted to include them so you and your team members will recognize them when you see them—a kind of red flag cheat sheet of company practices that might be negatively impacting the work place.
So, listed in no particular order are my rants and other musings that incite particularly visceral reactions. They concern systemic pressures that occur throughout the organization. These are the pressures that lay the foundation for Thief Too Much WIP and other thieves to sabotage improvements and, in some cases, jeopardize the emotional and psychological safety of the workforce (which in turn makes people update their résumés and search for healthier and kinder workplace climates).
Flow Time Metrics that Exclude Weekends
There are three reasons why excluding weekends from speed metrics is a big problem.
There will always be variability in our systems due to weekends, holi- days, unplanned work, and sick days. Credit leadership for being bright enough to know that requests arriving the day before a three-day weekend will have a longer lead time. Visibility of accurate metrics helps us make good decisions but is dependent on the transparency of others. Help others be okay with the truth. If you want more predictability in your organization, measure flow time accurately. Once you exclude weekends from flow time, or any other time people aren’t thought to be working, you open the door to many questioned assumptions.
Ineffective Accounting Methods with Time Sheets
Correlating activity with business value is risky. High activity levels do not equate to high business value. High activity levels equate to hidden queues, which contribute to teams finishing projects late. Using a time sheet to track the number of hours Todd spent work-ing on a task does not reflect the speed of delivered business value. Furthermore, the customer doesn’t care how many hours Todd spent working on line item 236.
I’ve experienced these problems first hand. I once waited eight weeks for a purchase order from a customer who wanted me to train their team within three weeks, and another time I waited twelve weeks to be added to a company’s payment system. The processes used in traditional accounting systems do not seem to be able to move as quickly as other parts of the business need them to. Some organizations are turning the tables on ineffective accounting methods that are based on costs and margins by focusing instead on the business value created and the economic profitability of the value stream.
With other viable options available, organizations that are bleeding from budget process landmines can turn the tables and staunch the wounds by looking into other methods, such as those offered up by Brian H. Maskell, Bruce Baggaley, and Larry Grasso in their book Practical Lean Accounting: A Proven System for Measuring and Managing the Lean Enterprise.
Gantt Charts
Like a false promise, Gantt charts (jokingly called “can’t charts” by some) fool us into believing that timeline accuracy based off estimates is doable. Developed by Henry Gantt in the 1910s, a Gantt chart is a type of horizontal bar chart that illustrates the start and finish dates of all the tasks in a project. The problem is that Gantt charts don’t consider the wait and blocked times that occur due to high capacity utilization of workers.
Gantt charts subdivide project tasks into time intervals that get broken down into smaller groups of subtasks. Due dates are identified, and people are incentivized to meet the timeline. One can recognize this in the promise, “If project V gets done by July first, you can take two days off during the week of the Fourth of July!”
In response, people insert contingency buffers into the plan to prevent tasks from missing their deadline, and these aggregate into even longer timelines with more variability. Each contingency buffer opens the door to including more work. “Oh, that’s not due until Thursday. Can we add this other little fix in?”
Each bucket in the timeline is already prone to some kind of variance. For example, someone goes off to a two-day conference or takes their car into the shop, the internet connectivity goes down, or the database server is running slowly.
When we add in contingency buffers, we unintentionally extend the timeline even further because the workers with the highest demand get blocked and aren’t there when you need them, or it takes them longer to respond because project V isn’t the only thing they’re working on (a likely scenario if they’re in high demand). As a result, there is work not getting done until someone with the right skill set has capacity to do it. So we wait.
We wait while flow time goes up, other tasks dependent on that task get delayed, and people start asking, “Is it done? Is it done? Is it done?” More project statuses get requested, more variability creeps in, and costs go up. This includes psychological costs, which go up because as queues and wait times get longer, they thwart motivation. When something is ready to use within an hour, there is a sense of urgency. When it’s a three week wait, there is little value in hurrying to finish it. The work begins to decay like perishable fruit when it sits around for too long. Partially completed work can be very expensive.
Instead of managing work with Gantt charts, consider managing work with queues. We know the longer the queue, the longer the wait time. The focus on queues and wait times changes the game. Projects no longer need to be accomplished by heroic, sleep-deprived people driven by Gantt charts.
Instead of giving due dates, reduce WIP, prioritize by CoD, and reduce batch size. Instead of organizing by projects, organize by product and decouple dependencies on architecture or single threaded skill sets that increase wait times and lengthen queues.
Individually Named Swimlanes
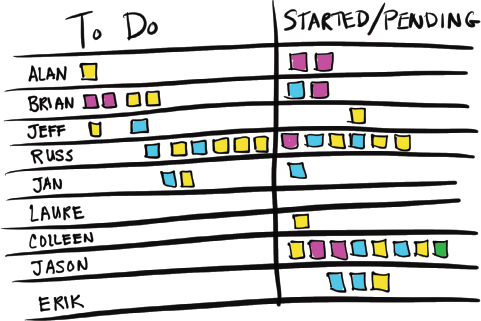
Figure 50 shows the results of a team subjected to begrudgingly using their boss’s kanban board design.

Figure 50. Individually Named Swimlanes
The boss mandated this board design, carving out swimlanes for individual team members. He wanted visibility on what his team was working on. It’s not difficult to understand why the team hated it. Here are some of the problems.
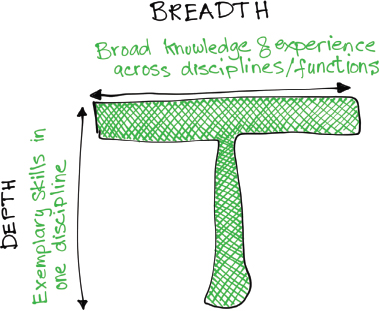
There are four main problems with individually named swimlanes. Given a constantly changing environment, there is a desire to feel in control of your own work, but there are costs to this desire:

Figure 51. T-Shaped Skills
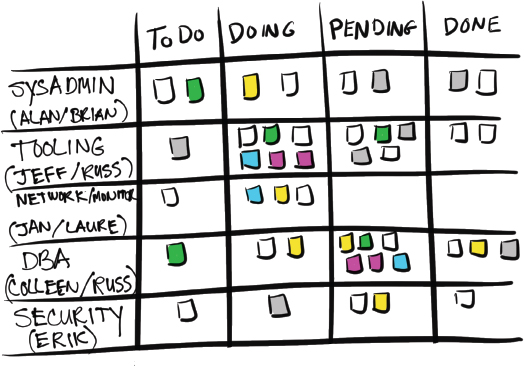
If this is your situation, and you want to take an incremental step in a direction that moves you closer to optimizing the flow of work, then consider a board design that brings visibility to the nature of the demand and to the skill sets required to get the job done (Figure 52). This way, when work is stalled, it’s easier to see which skill is in high demand and work to cross train more people to reduce the risk of bottlenecks. Instead of trying to keep individuals busy, change how you visualize the work to inspire how to focus on the right thing—smoothing the flow of work from start to finish.

Figure 52. Specialization
Work Scattered Everywhere
Meetings can be hard enough on their own. Just making sure the right people show up at the right time to discuss the right topics to hopefully achieve the correct outcome is a difficult task. Add in three different boards, six spreadsheets, four slack channels, a video conference tool with poor video conferencing bandwidth, twenty-seven open browsers, and umpteen other tools and apps, and you’ve plunged into meeting malaise. Who wants to juggle all that chaos? No one who wants to kick the time thieves in the butt, that’s for sure. Keep things simple so people waste less time searching for information. Time spent searching increases WIP.
Garish Card Colors
Information/data can be beautiful to gaze upon, but not when surrounded by colors that are at visual war with each other or with the background. Beauty attracts. Design your visual kanban user experience with beauty in mind. Author of three bestselling books on visualizing information and TED talk speaker David McCandless identifies four elements he believes are necessary for a visualization to work:
Make boards visually appealing to keep people interested and engaged and to avoid confusion and wasted time. Communication can be hard when many different tools are used. Improve communication with elegant visuals that integrate well with other tools.
Best Practices
It was in Honolulu while working at Boeing that I heard someone (my boss, actually) say, “Do it right the first time.” I instinctively knew that wasn’t right. The only time anyone does anything right the first time is when they follow directions given by someone else who has done it many times before. The first time doing anything is an experiment. And so it is with kanban. The first board design attempt is an experiment to help you discover how to improve your workflow. That’s why there really are no “best practices” when it comes to designing your kanban board, as well as many other situations. Unless you are doing something simple that has been done many times before—something where cause and effect are known, we cannot know exactly what specifically should be done. We just don’t know what we don’t know yet.
Today, when I hear the term “best practices,” I attempt to use my magic introvert powers to avoid physically cringing. I have to remind myself that there are appropriate times for best practices. When the pilot goes through the checklist before heading down the runway. When the nurse cleans a wound before applying a bandage. When the system admin pulls the server out of rotation before restarting IIS. Best practices might sound cringeworthy, but they do have their place, especially when you’re doing something routine but important.
Now that my ranting is done, let’s head to the conclusion of our journey together, where we’ll answer a tough question, look at improving alignment, and reduce resistance to change.

KEY TAKEAWAYS
