PART ONE: EVALUATING NUMBERS
People choose what to count This sentence is nearly a direct quote from Best, J. (2005). Lies, calculations and constructions: beyond How to Lie with Statistics. Statistical Science, 20(3), 210–214.
More people have cell phones than toilets Wang, Y. (2013, March 25). More people have cell phones than toilets, U.N. study shows. http://newsfeed.time.com/2013/03/25/more-people-have-cell-phones-than-toilets-u-n-study-shows/.
150,000 girls and young women die of anorexia each year Steinem, G. (1992). Revolution from Within. New York: Little, Brown. Wolf, N. (1991). The Beauty Myth. New York: William Morrow.
Add in women from twenty-five to forty-four and you still only get 55,000 This example came to my attention from Best, J. (2005). Lies, calculations and constructions: beyond How to Lie with Statistics. Statistical Science, 20(3), 210–214. The statistics are available at www.cdc.gov.
anorexia deaths in one year cannot be three times the number of all deaths Maybe you’re in the accounts payable department of a big corporation. An employee put in for reimbursement of gasoline for the business use of his car, $5,000 for the month of April. Start with a little world knowledge: Most cars get better than twenty miles per gallon these days (some get several times that). You also know that the fastest you can reasonably drive is seventy miles per hour, and that if you were to drive ten hours a day, all on the freeway, that would mean 700 miles a day. Keep that up for a standard 21.5-day work month and you’ve got 15,050 miles. In these kinds of rough estimates, it’s standard to use round numbers to make things easier, so let’s call that 15,000. Divide that by the fuel economy of 20 mpg and, by a rough estimate, your employee needed 750 gallons of gas. You look up the average national gas price for April and find that it’s $2.89. Let’s just call that $3.00 (again, rounding, and giving your employee the benefit of the doubt—he may not have managed to get the very best price every time he filled up). $3/gallon times 750 gallons = $2,250. The $5,000 on the expense report doesn’t look even remotely plausible now. Even if your employee drove twenty hours a day, the cost wouldn’t be that high. https://www.fueleconomy.gov/feg/best/bestworstNF.shtml, retrieved August 1, 2015. http://www.fuelgaugereport.com/.
a telephone call has decreased by 12,000 percent Pollack, L., & Weiss, H. (1984). Communication satellites: countdown for Intelsat VI. Science, 223(4636), 553.
one of 12,000 percent seems wildly unlikely I suppose you could spin a story that makes this true. Maybe a widget used to cost $1, and now, as part of a big promotion, a company is not just willing to give it to you for free, but to pay you $11,999 to take it (that’s a 12,000 percent reduction). This happens in real estate and big business. Maybe an old run-down house needs to be razed before a new one can be built; the owner may be paying huge property taxes, the cost of tearing down the house is high, and so the owner is willing to pay someone to take it off of his or her hands. At one point in the late 1990s, several large, debt-ridden record companies were “selling” for $0, provided the new owner would assume their debt.
200 percent reduction in customer complaints Bailey, C., & Clarke, M. (2008). Aligning business leadership development with business needs: the value of discrimination. Journal of Management Development, 27(9), 912–934.
Other examples of a 200 percent reduction: Rajashekar, B. S., & Kalappa, V. P. (2006). Effects of planting seasons on seed yield & quality of tomato varieties resistant to leaf curl virus. Seed Research, 34(2), 223–225. http://www.bostoncio.com/AboutRichardCohen.asp.
50 percent reduction in salary Illustration © 2016 by Dan Piraro based on an example from Huff, ibid.
making this distinction between percentage point and percentages clear I’m grateful to James P. Scanlan, attorney-at-law, Washington, D.C., who answered my query to the membership of the American Statistical Association, and provided me with this misuse.
closing of a Connecticut textile mill and its move to Virginia This example comes from Spirer, L., Spirer, H. F., & Jaffe, A. J. (1987). Misused Statistics, New York: Marcel Dekker, p. 194.
Miller, J. (1996, Dec. 29). High costs are blamed for the loss of a mill. New York Times, Connecticut Section.
And n. a. (1997, Jan. 12). Correction, New York Times, Connecticut Section.
legislation that denied additional benefits McLarin, K. J. (1993, Dec. 5). New Jersey welfare’s give and take; mothers get college aid, but no extra cash for newborns. New York Times.
See also: Henneberger, M. (1995, April 11). Rethinking welfare: deterring new births—a special report; state aid is capped, but to what effect? New York Times.
births to welfare mothers had already fallen by 16 percent Ibid.
no reason to report the new births Ibid.
Although they are mathematically equivalent Koehler, J. J. (2001). The psychology of numbers in the courtroom: how to make DNA-match statistics seem impressive or insufficient. Southern California Law Review, 74, 1275–1305.
And Koehler, J. J. (2001). When are people persuaded by DNA match statistics? Law and Human Behavior, 25(5), 493–513.
On average, humans have one testicle Attributed to mathematics professor Desmond MacHale of University College, Cork, Ireland.
temperatures ranging from 15 degrees to 134 degrees http://en.wikipedia.org/wiki/Death_Valley.
the amount of money spent on lunches in a week As an example, suppose six adults spend the following amounts on lunch {$12, $10, $10, $12, $11, $11} and six children spend the following {$4, $3.85, $4.15, $3.50, $4.50, $4}. The median (for an even number of observations, the median is sometimes taken as the mean between the two middle numbers, or in this case, the mean of 4.5 and 10) is $7.25. The mean and median are amounts that no one actually spends.
During the 2004 U.S. presidential election See Gelman, A. (2008). Red State, Blue State, Rich State, Poor State. Princeton, NJ: Princeton University Press.
the average life expectancy for males and females These numbers are for white males and females. Non-white figures for 1850 are not as readily available. http://www.infoplease.com/ipa/A0005140.html. An additional source of concern is that the U.S. numbers for 1850 are for the state of Massachusetts only, according to the Bureau of the Census.
the average family The title of this section, and the discussion, follows the work of Jenkins and Tuten very closely:
Jenkins, J., & Tuten, J. (1992). Why isn’t the average child from the average family? And similar puzzles. American Journal of Psychology, 105(4), 517–526.
the average number of siblings Stick-figure children from Etsy, https://www.etsy.com/listing/221530596/stick-figure-family-car-van-bike-funny; small and large house drawn by the author; medium house from http://www.clipartbest.com/clipart-9TRgq8pac.
average investor does not earn the average return A simulation, see Tabarrok, A. (2014, July 11). Average stock market returns aren’t average. http://marginalrevolution.com/marginalrevolution/2014/07/average-stock-market-returns-arent-average.html. Accessed October 14, 2014.
poster presented at a conference by a student researcher Tully, L. M., Lincoln, S. H., Wright, T., & Hooker, C. I. (2013). Neural mechanisms supporting the cognitive control of emotional information in schizophrenia. Poster presented at the 25th Annual Meeting of the Society for Research in Psychopathology. https://www.researchgate.net/publication/266159520_Neural_mechanisms_supporting_the_cognitive_control_of_emotional_information_in_schizophrenia.
I first found this example at www.betterposters.blogspot.com.
gross sales of a publishing company http://pelgranepress.com/index.php/tag/biz/.
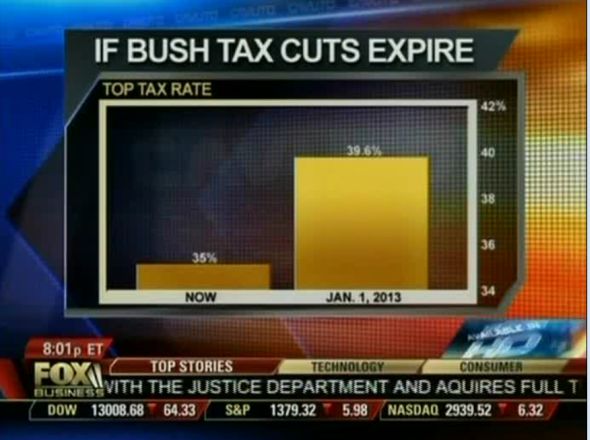
Fox News broadcast the following graph I’ve redrawn this for the sake of clarity. For the original, see http://cloudfront.mediamatters.org/static/images/item/fbn-cavuto-20120731-bushexpire.jpg.
Discontinuity in vertical or horizontal axis Spirer, Spirer, & Jaffe, op. cit., pp. 82–84.
Choosing the proper scale and axis Example from Spirer, Spirer, & Jaffe, op. cit., p. 78.
Many things change at a constant rate Spirer, Spirer, & Jaffe, op. cit., p. 78.
life expectancy of smokers versus nonsmokers at age twenty-five These data taken from Jha, P., et al. (2013). 21st-century hazards of smoking and benefits of cessation in the United States. New England Journal of Medicine, 368(4), 341–350, Figure 2A for women. Survival probabilities were scaled from the National Health Interview Survey to the U.S. rates of death from all causes at these ages for 2004 with adjustment for differences in age, educational level, alcohol consumption, and adiposity (body-mass index). I’m grateful to Prabhat Jha for her correspondence about interpreting this.
This form of presentation is based on that of Wainer, H. (1997). Visual Revelations: Graphical Tales of Fate and Deception from Napoleon Bonaparte to Ross Perot. New York: Copernicus/Springer-Verlag.
expenditures per public school student and those students’ scores on the SAT This example from Wainer, H. (1997). Visual Revelations: Graphical Tales of Fate and Deception from Napoleon Bonaparte to Ross Perot. New York: Copernicus/Springer-Verlag, p. 93. The original appeared in Forbes (May 14, 1990).
Of course, there are other variables. Are the spending increases reported in actual or inflation-adjusted dollars? Was the time frame 1980–88 chosen to make that point, and would a different time frame make a different point?
The correlation also provides a good estimate There is some controversy about whether to use r or r-squared. For the defense of r, see: D’Andrade, R., & Dart, J. (1990). The interpretation of r versus r2 or why percent of variance accounted for is a poor measure of size of effect. Journal of Quantitative Anthropology, 2, 47–59.
Ozer, D. J. (1985). Correlation and the coefficient of determination. Psychological Bulletin, 97(2), 307–315.
services provided by the organization Planned Parenthood Roth, Z. (2015, Sept. 29). Congressman uses misleading graph to smear Planned Parenthood. msnbc.com.
Politifact explored this issue further, examining the data between the endpoints and furnishing additional contextual information to go along with the usual graph-centered criticism. See https://perma.cc/P8NY-YP49.
presentation on iPhone sales http://qz.com/122921/the-chart-tim-cook-doesnt-want-you-to-see/; http://www.tekrevue.com/tim-cook-trying-prove-meaningless-chart/.
feature spurious co-occurrences http://www.tylervigen.com/spurious-correlations.
Randall Munroe in his Internet cartoon xkcd https://xkcd.com/552/.
visual system is pitted against your logical system This example is based on one in Huff, ibid.
Any model of consumer behavior on a website This is nearly a direct quote from De Veaux, R. D., & Hand, D. J. (2005). How to lie with bad data. Statistical Science, 20(3), 231–238, p. 232.
Colgate’s biggest competitor was named nearly as often I thank my student Vivian Gu for this example.
Derbyshire, D. (2007, Jan. 17). Colgate gets the brush off for “misleading” ads. The Telegraph. Retrieved from http://www.telegraph.co.uk/news/uknews/1539715/Colgate-gets-the-brush-off-for-misleading-ads.html.
C-SPAN advertises that they are “available” http://www.c-span.org/about/history/.
doesn’t mean that even one person is watching Nielsen reports that Americans, on average, receive 189 channels but watch only 17 of them. http://www.nielsen.com/us/en/insights/news/2014/changing-channels-americans-view-just-17-channels-despite-record-number-to-choose-from.html.
water use in the city of Rancho Santa Fe Boxall, B. (2014, Dec. 2). Rancho Santa Fe ranked as state’s largest residential water hog. Los Angeles Times. http://www.latimes.com/local/california/la-me-water-rancho-20141202-story.html.
Lovett, I. (2014, Nov. 29). “Where grass is greener, a push to share drought’s burden.” New York Times. http://www.nytimes.com/2014/11/30/us/where-grass-is-greener-a-push-to-share-droughts-burden.html.
flying is actually safer now http://www.flightsafety.org; Grant, K. B. (2014, Dec. 30). Deadly year for flying—but safer than ever. http://www.cnbc.com/id/102301598.
Newton’s law of cooling For an initial temperature of 155 degrees Fahrenheit, the formula is
f(t) = 80e−0.08t + 75.
C-SPAN is available in 100 million homes Bedard, P. (2010, June 22). “Brian Lamb: C-SPAN now reaches 100 million homes.” U.S. News & World Report. www.usnews.com/news/blogs/washington-whispers/2010/06/22/brian-lamb-c-span-now-reaches-100-million-homes. Retrieved November 22, 2010.
90 percent of the population is within twenty-five miles Based on Huff, op. cit., p. 48.
3,482 active-duty U.S. military personnel who died in 2010 https://www.cbo.gov/sites/default/Files/113th-congress-2013-2014/workingpaper/49837-Casualties_WorkingPaper-2014-08_1.pdf.
total of 1,431,000 people in the military https://www.census.gov/prod/2011pubs/12statab/defense.pdf.
death rate in 2010 http://www.cdc.gov/nchs/fastats/deaths.htm.
general population of the United States includes Based on an example from Huff, op. cit., p. 83.
increase in the number of doctors I thank my student Alexandra Ghelerter for this example. Barnett, A. (1994). How numbers are tricking you. Retrieved from http://www.sandiego.edu/statpage/barnett.htm.
nuances often tell a story This is Best’s term.
there are six different indexes Davidson, A. (2015, July 1). The economy’s missing metrics. New York Times Magazine.
July 2015 that the unemployment rate dropped Shell, A. (2015, July 2). Wall Street weighs Fed’s next move after jobs data. USA Today Money. http://americasmarkets.usatoday.com/2015/07/02/wall-street-gets-what-it-wants-in-june-jobs-count/.
reported the reason for the apparent drop Schwartz, N. D. (2015, July 3). Jobless rate fell in June, with wages staying flat. New York Times, B1.
batting averages for the 2015 season Stats from http://mlb.mlb.com/stats/sortable.jsp#elem=[object+Object]&tab_level=child&click_text=Sortable+Player+hitting&game_type=%27R%27&season=2015&season_type=ANY&league_code=%27MLB%27§ionType=sp&statType=hitting&page=1&ts=1457286793822&playerType=QUALIFIER&timeframe=.
top three causes of death in 2013 http://www.cdc.gov/nchs/fastats/leading-causes-of-death.htm.
attitudes do not seem to fall upon racial lines This is entirely hypothetical.
Another hurdle: You want age variability This is from Huff, op. cit., p. 22.
71 percent of which British? Ibid.
answer falsely just to shock the pollster Many years ago, Chicago columnist Mike Royko encouraged readers to lie to exit pollers on Election Day in the hope that inaccurate data and being made to look foolish would end the practice of TV commentators calling the result of an election before all the votes were counted. I have no data on how many people lied to the exit pollers because of Royko’s column, but the fact that exit polls are still a thing suggests it wasn’t enough.
the price you pay for not hearing from everyone Taken from http://www.aapor.org/Education-Resources/Election-Polling-Resources/Margin-of-Sampling-Error-Credibility-Interval.aspx.
Note that these ranges overlap This is a good rule of thumb, but in some cases this quick method will be inaccurate. See Schenker, N., & Gentleman, J. F. (2001). On judging the significance of differences by examining the overlap between confidence intervals. American Statistician, 55(3), 182–186.
Five times out of a hundred I’m intentionally not making a distinction here between frequentist and Bayesian probability estimates, a distinction that comes up in Part Two.
Margin of error (image) From Wikipedia.
formula for calculating the margin of error For large populations, the 95 percent confidence interval can be estimated as ±1.96 × sqrt [p(1-p)/n]. To obtain a 99 percent confidence interval, multiply by 2.58 instead of 1.96. Yes, the interval is larger when you’re more confident (which should make sense; if you want to be more sure that the range you quote includes the true value, you need a larger range). For smaller populations, the formula is to first compute the standard error:
sqrt [{(Observed proportion) × [1 − (Observed proportion)}/sample size]
The width of the 95 percent confidence interval then is ±2 × standard error.
For example, if you sampled fifty overpasses in a large city, you might have found that 20 percent of them needed repair. You calculate the standard error as:
sqrt [(.2 × .8)/50] = sqrt (.16/50) = .057.
So the width of your 95 percent confidence interval is ±2 × .057 = ±.11 or ±11%. Thus the 95 percent confidence interval is that 20 percent of the overpasses in this town need repair, plus or minus 11 percent. In a news report, the reporter might say that the survey showed 20 percent of overpasses need repair, with a margin of error of 11 percent. To increase the precision of your estimate, you need to sample more. If you go to 200 overpasses (assuming you obtain the same 20 percent figure), your margin of error reduces to about six percent.
this conventional explanation is wrong Lusinchi, D. (2012). “President” Landon and the 1936 Literary Digest poll: were automobile and telephone owners to blame? Social Science History, 36(1), 23–54.
An investigation uncovered serious flaws Clement, S. (2013, June 4). Gallup explains what went wrong in 2012. Washington Post. https://www.washingtonpost.com/news/the-fix/wp/2013/06/04/gallup-explains-what-went-wrong-in-2012/.
http://www.gallup.com/poll/162887/gallup-2012-presidential-election-polling-review.aspx.
trying to figure out what proportion of jelly beans Taken from http://www.ropercenter.uconn.edu/support/polling-fundamentals-total-survey-error/.
what magazines people read Elaborated from an example in Huff, op. cit., p. 16.
Gleason scoring This definition taken verbatim from http://www.cancer.gov/publications/dictionaries/cancer-terms?cdrid=45696. Accessed March 20, 2016.
they had made an error in measurement Jordans, F. (2012, Feb. 23). CERN researchers find flaw in faster-than-light measurement. Christian Science Monitor. http://www.csmonitor.com/Science/2012/0223/CERN-researchers-find-flaw-in-faster-than-light-measurement.
1960 U.S. Census study recorded This is from De Veaux, R. D., & Hand, D. J. (2005). How to lie with bad data. Statistical Science, 20(3), 231–238, p. 232. They cite Kruskal, W. (1981). Statistics in society: problems unsolved and unformulated. Journal of the American Statistical Association, 76(375), 505–515, and Coale, A. J., & Stephan, F. F. (1962). The case of the Indians and the teen-age widows. Journal of the American Statistical Association, 57, 338–347.
claimed measurement error as part of their defense Kryk, J. Patriots strike back with compelling explanations to refute deflate-gate chargers. Ottowa Sun, May 15, 2015. http://www.ottawasun.com/2015/05/14/patriots-strike-back-with-compelling-explanations-to-refute-deflate-gate-chargers.
statistic you encounter may not have defined homelessness This example from Spirer, H., Spirer, L., & Jaffe, A. J. (1998). Misused Statistics, 2nd ed., revised and expanded. New York: Marcel Dekker, p. 16.
Imagine that you’ve been hired by a political candidate This example based on one in Huff, op. cit., p. 80.
A newspaper reports the proportion of suicides From Best (2005), op. cit.
I’m not going to wear my seat belt because This example comes from Best, J. (2012), and my childhood friend Kevin.
the idea of symmetry and equal likelihood The principle of symmetry can be broadly construed to include instances where outcomes are not equally likely but still prescribed, such as a trick coin that is weighted to come up heads two-thirds of the time, or a roulette wheel in which some of the troughs are wider than others.
If we run the experiment on a large number of people We could also conduct the experiment with a small number of people many times, in which case we would expect to obtain different numbers. In this case, the true probability of the drug working is going to be somewhere close to the average (the mean) of the numbers obtained in all the experiments, but it’s an axiom of statistics that larger samples lead to more accurate results.
Both classic and frequentist probabilities deal with Classic probability can be thought of in two different ways: empirical and theoretical. If you’re going to toss a coin or draw cards from a shuffled deck, each time you do this is like a trial in an experiment that could go on indefinitely. In theory, you could get thousands of people to toss coins and pick cards for several years and tally up the results to obtain the proportion of time that different outcomes occur, such as “getting heads” or “getting heads three times in a row.” This is an empirically derived probability. If you believe the coin is fair (that is, there’s no manufacturing defect that causes it to come up on one side more than the other), you don’t need to do the experiment, because it should come up heads half of the time (probability = .5) in the long run, and we arrive at this theoretically, based on the understanding that there are two equally likely outcomes. We could run a similar experiment with cards and determine empirically and theoretically that the chances of drawing a heart are one in four (probability = .25) and that the chances of drawing the four of clubs is one in fifty-two (probability ≅ .02).
When a court witness testifies about the probability Aitken, C. G. G., & Taroni, F. (2004). Statistics and the Evaluation of Evidence for Forensic Scientists, 2nd ed. Chicester, UK: John Wiley & Sons.
In Tversky and Kahneman’s experiments Tversky, A., & Kahneman, D. (1974). Judgment under uncertainty: heuristics and biases. Science, 185(4157), 1124–1131.
A telltale piece of evidence that this is subjective For further discussion, and more formal treatment, see Iversen, G. R. (1984). Bayesian Statistical Inference. Thousand Oaks, CA: Sage, and references cited therein.
the case of Sally Clark I thank my student Alexandra Ghelerter for this example. See also Nobles, R., & Schiff, D. (2007). Misleading statistics within criminal trials. Medicine, Science and the Law, 47(1), 7–10.
relative incidence of pneumonia http://www.nytimes.com/health/guides/disease/pneumonia/prognosis.html.
Bayes’s rule to calculate a conditional probability Bayes’s rule is:
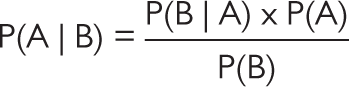
The probability that a woman has breast cancer This paragraph, and this discussion, quotes nearly verbatim from Krämer, W., & Gigerenzer, G. (2005). How to confuse with statistics or: the use and misuse of conditional probabilities. Statistical Science, 20(3), 223–230.
To make the numbers work out easily How do you know what number to choose? Sometimes it takes trial and error. But it’s also possible to figure it out. Because the probability is .8 percent, or eight people per thousand, if you chose to build a table for 1,000 women you’d end up with eight in one of the squares, and that’s okay, but later on we’re going to be multiplying that by 90 percent, which will give us a decimal. There’s nothing wrong with that, it’s just less convenient for most people to work with decimals. Increasing our population by an order of magnitude to 100 gives us all whole numbers, but then we’re looking at larger numbers than we need. It doesn’t really matter because all we’re looking for is probabilities and we’ll be dividing one number by another anyway for the result.
If you read that more automobile accidents occur at seven p.m. Still confused? If there were eight times as many cars on the road at seven p.m. than at seven a.m., the raw number of accidents could be higher at seven p.m., but that does not necessarily mean that the proportion of accidents to cars is greater. And that is the relevant statistic to you: not how many accidents happen at seven p.m., but how many accidents occur per thousand cars on the road. This latter formulation quantifies your risk. This example is modified from one in Huff, op. cit., p. 78, and discussed by Krämer & Gigerenzer (2005).
90 percent of doctors treated the two Cited in Spirer, Spirer, & Jaffe, op. cit., p. 197: Thompson, W. C., & Schumann, E. L. (1987). Interpretation of statistical evidence in criminal trials, Law and Human Behavior, 11(167).
One surgeon persuaded ninety women From Spirer, Spirer, & Jaffe, op. cit., first reported in Hastie, R., & Dawes, R. M. (1988). Rational Choice in an Uncertain World. New York: Harcourt Brace Jovanovich.
The original report of the surgeon’s work appeared in McGee, G. (1979, Feb. 6). Breast surgery before cancer. Ann Arbor News, p. B1 (reprinted from the Bay City News).
As sociologist Joel Best says Best, op. cit., p. 184.