7.6SQL Performance Optimization
The SQL performance optimization tool—the SQL Performance Tuning Worklist—is a new development available as of AS ABAP 7.4 and was ported up until Release 7.02. It can be used to combine data from a static code analysis (e.g., the data associated with a check run in the ABAP Test Cockpit) with runtime measurements from the SQL Monitor (or Coverage Analyzer [Transaction SCOV]) to determine the points where optimization is promising for SAP HANA. We’ll now show you how to link the results of a static analysis with the results of the SQL Monitor. This link uses a join that is based on the call point.
In Section 7.3, you learned how to perform static code analyses, and, in Section 7.5.2, we explained how to use Transaction SQLM to collect data. These two pools of data can now be linked to each other in Transaction SWLT.
Don’t make any restrictions or changes on the General tab. Then, on the Static Checks tab (see Figure 7.43), select the Use Static Check Data checkbox. Then select an ABAP Code Inspector or ABAP Test Cockpit check that was run previously. A check run can be used both from the local and from a remote system (using the RFC Destination field).
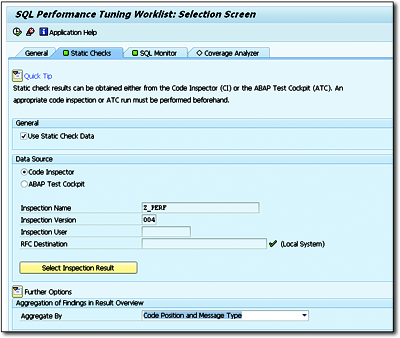
Figure 7.43Transaction SWLT: Static Checks
Then select the Use SQL Monitor Data checkbox on the SQL Monitor tab (see Figure 7.44). To select a snapshot, click on Manage/Create Snapshot. You can use the local system, a remote system that is connected via RFC, or a file import as the data source. An SQL Monitor snapshot must have been created first, however.
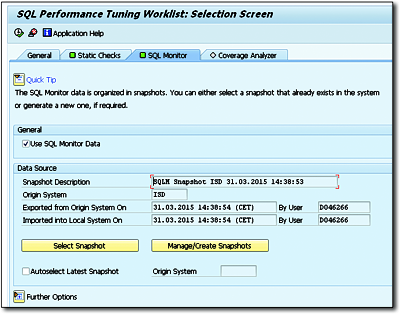
Figure 7.44Transaction SWLT: SQL Monitor Data
You can now run the analysis by clicking on the  icon.
icon.
The result list includes a screen that is divided into three sections (see Figure 7.45):
-
Result Overview
This area contains the data from the SQL Monitor. As soon as you double-click a data record in this area, the data is filled in the lower screen areas. If you select an entry in the Include Name column, you navigate directly to the call point in the ABAP program. -
SQL Monitor Results
In the list on the lower left-hand side of the screen, you see the relevant caller for the SQL statement (Request Entry Point, first program in the ABAP call hierarchy) and the most important measurement readings for this from the SQL Monitor. When you select the table name, you call Transaction SE12 (ABAP Data Dictionary) for this table. -
Static Check Findings
In the list on the lower right-hand side of the screen, you see the consolidated results from the Code Inspector and the ABAP Test Cockpit. From here, you can call the documentation for the check, or you can select the entry in the Additional Information column to navigate directly to detailed information about the results in the Code Inspector or the ABAP Test Cockpit.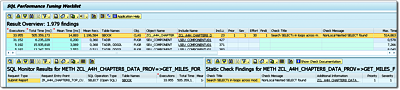
Figure 7.45Transaction SWLT: Analysis
The upper area of the screen shows the data from the SQL Monitor and the corresponding results of the ABAP Code Inspector check (both aggregated by call point; see the top right area of Figure 7.45). When you click on the Include Name field, the system takes you directly to the call point of the SQL statement. If you double-click a row of the results overview, you receive the SQL Monitor results in the bottom left area (not aggregated). Clicking on Request Entry Point or Table Names takes you to the request entry point or DDIC. The ABAP Code Inspector results are displayed in nonaggregated form in the Static Check Findings area. When you click on the link in the Additional Information field, the system takes you to the results of the Code Inspector check, for example, the call hierarchy of an SQL statement in loops.
The SQL Performance Tuning Worklist is a very powerful tool that can be used to plan optimization projects for SAP HANA very efficiently. If SQL statements are assigned to applications, they can also be assigned to business processes. Runtime measurements show which SQL statements require a large amount of time or run very frequently. The static analysis shows where there is potential for optimization and how time-consuming such an optimization would be. Combining this data into one transaction is extremely useful for detecting the source code with the best cost-benefit ratio for applying optimizations.
Compared to the SQL Monitor, the main result list contains some additional columns. From the DDIC, you obtain the following information for the database tables:
-
Buffering Type
Buffering type associated with the table. -
Columns
Number of columns in the table. -
Key Columns
Number of key columns. -
Width in Bytes
Row length in bytes. -
Storage Type
Table type (Column Store and Row Store). -
Size category
Size category for the table. -
Table Class
Table type (Transparent, Pool, and Cluster).
You also obtain information about the Code Inspector checks:
-
Priority
This is the priority of the message as configured in the Code Inspector. -
Severity
This value depends on the relevant check. (For more information, refer to the documentation for the Code Inspector.) It specifies the severity of the result. For the SELECT * check, this column specifies how many superfluous columns were read. In general, the following applies: the higher this value, the greater the negative impact on performance. -
Effort
This value depends on the relevant check (see the documentation for the Code Inspector) and is an estimate of the effort associated with the correction. In general, the following applies: the higher this value, the greater the effort. -
Findings
This is the number of Code Inspector results for this SQL statement.
You can use these columns to compare the results and prioritize where an optimization would be most beneficial.