So-called Ponzi schemes are illegal, at least when conducted in the private sector. The Securities and Exchange Commission (SEC) discusses them in this way:
What is a Ponzi scheme?
A Ponzi scheme is an investment fraud that involves the payment of purported returns to existing investors from funds contributed by new investors…. In many Ponzi schemes, the fraudsters focus on attracting new money to make promised payments to earlier-stage investors to create the false appearance that investors are profiting from a legitimate business.
Why do Ponzi schemes collapse?
With little or no legitimate earnings, Ponzi schemes require a consistent flow of money from new investors to continue. Ponzi schemes tend to collapse when it becomes difficult to recruit new investors or when a large number of investors ask to cash out.1
In 2009, Bernie Madoff was sentenced to 150 years in prison (the maximum sentence allowable) for running what has been called the biggest Ponzi scheme in US history, defrauding thousands of investors of many billions of dollars.2 However, there is an even bigger Ponzi scheme that has been foisted on Americans: Social Security (and Medicare).
Think about it: the government taxes current workers in order to pay current retirees their Social Security and Medicare benefits. When today’s workers grow old and retire, they in turn will receive their benefit payments from payroll taxes taken from future workers. The whole system depends on bringing in new “participants,” or else it collapses. Indeed, as we will soon see, the system is collapsing, because of shifting demographics.
For these reasons, Social Security and Medicare are quite understandably referred to as Ponzi schemes—and not just by its critics, but even by supporters such as liberal economists Paul Samuelson and Paul Krugman.3
Precisely because of the Ponzi game aspect, the Social Security and Medicare programs will constitute a growing burden on the general taxpayer, as we will explain shortly. This is why analysts have been wringing their hands over “entitlement spending” for decades—they know that these programs contain the seeds of the government’s fiscal destruction. Furthermore, it’s not really Social Security that’s the problem: it’s Medicare that will break the bank (i.e. taxpayer) if the country remains on its historical trajectory.
Why is this relevant to us, in our discussion of US health care? The answer is that Medicare epitomizes the problems that occur when health care is paid for—and ultimately controlled by—the federal government. So long as politicians (from both parties) were handing out money to the politically active retirees, spending surged, such that Social Security and Medicare absorbed growing shares of the federal budget. Analysts kept warning that eventually this trend would make the programs crowd out defense and other spending items, ultimately bankrupting the government. But very few people in Washington really cared; they kept postponing the day of reckoning with little tweaks, which would include rising tax burdens on workers (that’s what the “FICA” deductions from your paycheck are).
As we’ll discuss in Part II of this book, the financial projections actually did improve significantly after the passage of the Affordable Care Act, but only by building in assumptions of draconian cuts to Medicare spending. As usual, the bulk of those painful projected budget cuts conveniently occur in the future, when other people will be in office.
The whole episode thus serves as a useful case study in what happens when the federal government gets a foothold in the provision of health care. Compared to their promised flow of benefits from the federal government, American seniors would have far more disposable wealth today had they never had their paychecks taxed to fund Social Security and Medicare during their working careers. Yet because Americans were allegedly too shortsighted or weak-willed to save for their own retirement and medical expenses, the federal government came in, forced participation in these “social insurance” programs, and in the process bankrupted the whole system. Note that we use the term “bankrupt” quite literally: as we will soon document, the government’s own actuaries report that Social Security and Medicare are in the hole by many trillions of dollars.
Given that this is what happened with the major “social insurance” programs—one of which deals specifically with medical spending—run by the government so far, it gives us little hope for the future now that the Affordable Care Act has significantly expanded the federal government’s role in US health care for everyone, not just seniors and the poor.
Before we dive into the scary numbers regarding Medicare’s impact on the federal budget, it’s important to first explain why demographics matter so much when it comes to Social Security and Medicare. The answer is that they are indeed Ponzi schemes, where the original “investors” are paid not with the genuine earnings created from the wise investment of their initial contributions, but instead with the money flowing in from the next wave of “investors.” It is the Ponzi nature of government social insurance programs that makes them so vulnerable to demographic shifts, where the United States has been “growing older,” meaning that over time there are fewer and fewer workers supporting each retiree.
In contrast, if the default situation were for the members of each household to take care of their own financial future, then demographic shifts would be irrelevant. For example, picture a 23-year-old who has graduated from college and is now starting his serious career. He knows that decades down the road, he may lack the ability and desire to work full-time, and he also knows that in his old age he will face much higher medical expenses. To deal with these facts of life, during his prime working years our young man faithfully puts aside a portion of his income in a growing stockpile of assets (stocks, bonds, life insurance, precious metals, real estate, etc.). When he decides to retire at age 73, he has accumulated (say) $2 million worth of assets. He then begins drawing down these holdings, selling them off in order to enjoy a pleasant lifestyle—which includes routine medical treatment for a person of his age and health status. At that point, whether the United States has more workers than retirees is an interesting bit of trivia that has virtually no bearing on the lifestyle our now-73-year-old man can enjoy, because he has provided for his own retirement.
Although it’s obvious that on paper our hypothetical man is immune to demographic trends (because of his stockpile of financially assets), you might have a gut feeling that somehow he really is dependent on young workers to grow food, provide medical services, and so on. However, this intuition is wrong; there really is an important difference between a person funding his retirement and medical expenses through genuine saving, versus Ponzi-type transfer payments. The easiest way to visualize this crucial difference is to abstract away from the financial assets, and instead imagine that our hypothetical man during his working career directly invests in physical capital (not financial capital). In other words, imagine that over the decades our man builds up a growing stockpile of tools and equipment, which he stores in a warehouse, and which finally hits a market value of $2 million by the time he turns 73 and is ready to retire. At this point, he puts his physical capital “to work” by renting out his hammers, power saws, forklifts, etc. to the next generation of workers who have entered the labor force. His physical capital augments their raw labor power, increasing the total amount produced. The older man’s “cut” of the total output, then, is what he gets to enjoy as his retirement living. In this scenario, our 73-year-old can live a comfortable lifestyle while not lifting a finger, and the young workers don’t need to cut back their own lifestyle in any way to provide for him, because he is merely enjoying the increment in output that his large stockpile of tools and equipment makes physically possible. His existence isn’t a burden on the rest of society; he actually helps the workers when he brings his warehouse of goodies to the table.
Our simplistic story captures the essence of what happens in the real world when someone saves in the present in return for a greater amount of enjoyment in the distant future. The economy simply “rebalances” its mix of output, so that it cranks out fewer movie theaters but more factories. This change in the mix of output obviously means that people today won’t get to enjoy as many movies, but the extra factories mean that people in the future will be more productive, and hence have a higher standard of living because of today’s discipline.
Now let’s tweak our story yet again. Rather than our hypothetical 23-year-old setting aside a portion of his earnings in stocks, bonds, and other private-sector assets, instead suppose that the government confiscates some of his earnings while giving the 23-year-old its solemn promise that the government will fund his lifestyle and medical bills when he retires.
Now if the government took the funds and itself invested in stocks, bonds, and other assets, it would effectively be acting as a giant (and involuntary) mutual fund, and we would merely be arguing over whether the government versus citizens were better at investing for their future.
Yet in reality, the government doesn’t invest the money it takes in payroll taxes the same way that a private individual would when saving for retirement. No; the politicians take those payroll “contributions” and they spend them right away. For example, they might send the money as benefit checks to current retirees, who can now afford to go out to more dinners and pay for medical treatment.
Thus, when the government muscles in and takes over old-age financial planning, it greatly reduces the total amount of genuine saving and investment that occurs. Yes, the young worker still lives below his means, because he has money taken from every paycheck that is earmarked for social insurance programs (these deductions aren’t income taxes, but instead are called “FICA” or “payroll taxes”). But the government’s programs then allow older people to simultaneously live above their means. So there is no net or aggregate saving occurring; the worker’s saving is offset by the beneficiary’s consumption.
Now we see why demographics matter so much for government social insurance programs. When our hypothetical man reaches age 73 and wants to retire, he doesn’t possess implicit ownership claims on a stockpile of $2 million worth of physical tools and equipment. No; society didn’t have the physical resources to build those tools and equipment over his working career, because the government squandered the man’s savings on current spending each year. Therefore, our 73-year-old has nothing to bring to the table that will augment output. If he is to eat, then the young workers at that time will have give up some of the food that is actually due to their own labor efforts. Since he now really is “skimming off the top” of what the young people are producing, we can see why the overall ratio between retirees and workers is very significant, and how the whole system creates needless conflict between young workers and old retirees.
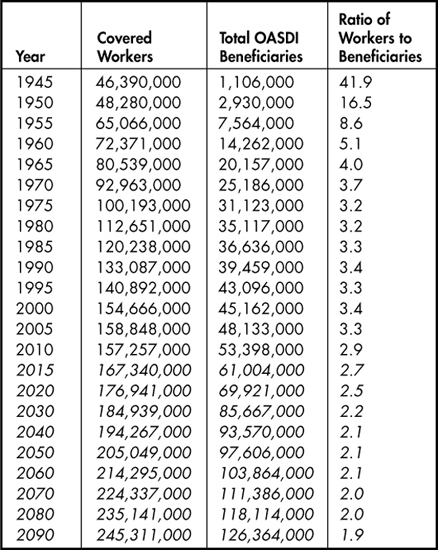
Later in this chapter, when we review the Trustee Report for Social Security and Medicare, we will see the absolutely shocking figures for how deep in the hole these popular programs are. The main explanation is that the benefits the government promises to retirees cannot be funded with the existing level of FICA “payroll contributions” as the ratio of retirees to workers grows. To understand just how enormous this demographic shift has been—the “aging of America”—since Social Security was created in 1935 and Medicare was created in 1965, consider the following table presented by the Social Security Administration:
Table 3-1. Ratio of Old Age, Survivors, and Disability Insurance (OASDI) Covered Workers to Beneficiaries, 1945-2090 (projections in italics)
As Table 3-1 illustrates, the demographics have moved against Social Security (and thus against Medicare) as the population distribution has skewed more heavily to older Americans. With baby boomers retiring and fertility rates seeing a general decline, the number of workers supporting each beneficiary has steadily dropped since the creation of Social Security and other government social insurance programs. As the table shows, back in 1965 there were four workers whose payroll deductions supported each beneficiary. By 2010 it had dropped to fewer than three workers per beneficiary, and in the “Intermediate” cost scenario, the government’s Trustees project the number will drop to a mere two workers supporting each beneficiary by the year 2070.
To reiterate: these demographic shifts would be largely irrelevant in a private-sector voluntary framework, where the default position is for every person or household to save aside enough funds to finance the retirement years, including standard medical expenses in old age. Yet because Social Security and Medicare spend the money as soon as workers “contribute” it from their payroll deductions, there is no pool of savings for older Americans to draw upon when they retire. Instead, the government must pay current beneficiaries out of the payroll taxes levied upon current workers. Such a Ponzi setup, when coupled with the demographic trends outlined in Table 3-1, is a ticking time bomb— albeit one with a very long fuse.
In this section we summarize the financial position of the federal government’s major entitlement programs as of 2009. We chose this year to take a snapshot of how things stood before passage of the Affordable Care Act (in March 2010).
The following chart is taken from the Congressional Budget Office’s (CBO) June 2009 long-term budget outlook. Specifically, this shows the “Alternative Fiscal Scenario” in which policymakers are assumed to behave as they have done historically:
Figure 3-1. CBO Long-Term Federal Budget Outlook, “Alternative Fiscal Scenario,” 1962 to 2080, as of June 2009

As Figure 3-1 shows, it is a bit misleading when pundits discuss the need to reform “entitlement spending.” Even though Social Security is literally bankrupt, in an accounting sense—as we’ll discuss shortly—it did not pose a runaway threat to the overall budget, the way Medicare and Medicaid did as of 2009. The analysts at the CBO predicted that Social Security spending, as a share of the total economy, would drift upward to 6 percent of GDP by the year 2035, but after that they predicted Social Security expenditures would very gently recede compared to the size of the overall economy.4
In contrast, the figure shows that as of 2009, CBO-projected federal spending on Medicare and Medicaid would continue an upward climb as far as the eye could see. If we include state-level spending, the CBO predicted that total spending on Medicare and Medicaid would reach a shocking 22 percent of the entire economy (15 percent for Medicare, 7 percent for Medicaid) by 2080. In the CBO forecast, health care spending on the elderly (Medicare) grows so much faster than Social Security because it suffers from a double whammy: not only does the proportion of elderly in the population grow, but health care costs in general are expected to continue expanding faster than the overall economy.
Another way of illustrating the “ticking time bomb” aspect of federal entitlement programs is to consider their share of the overall federal budget. For example, in Table 3-2 we show the CBO’s forecast for the respective federal budget shares of major spending categories for the year 2050:
TABLE 3-2. CBO 2009 Forecast of Federal Spending by Category, in Year 2050, Assuming Historical Policy Trends

As Table 3-2 shows, back in 2009 the CBO projected that by 2050, what is called “non-discretionary spending”—including the major entitlements and interest on the federal debt—would absorb so much of the budget that only 24 percent would be left for things like the Departments of Defense, Education, and Transportation, as well as NASA and federally funded poverty relief. Note too that this “crowding out” of federal spending by entitlements and interest payments wouldn’t be due to budget austerity; by 2050 the CBO projected that total federal spending would absorb a whopping 42 percent of the entire US GDP. To get a frame of reference: federal spending was 27 percent of the economy in 2009 when the forecast came out, and that included large expenditures related to the Troubled Asset Relief Program (TARP) and the American Recovery and Reinvestment Act, also known as the “Obama stimulus package.”
To be clear, nobody really expected these CBO projections to come to fruition. They merely served to underscore just how unsustainable the federal entitlement programs had become. Thus far, we’ve shown the relation of Social Security and Medicare to the federal budget and overall US economy. In the next section, we’ll walk through the internal structure of the programs to show just how absurd the government’s promises have been.
Another way to gauge just how bankrupt—literally—the government’s social insurance programs are is to quote from the official Trustee Report. Table 3.3 reproduces a portion of the Trustees’ projections as of January 1, 2009:
TABLE 3-3. Trustee 2009 Present-Value Estimates of 75-Year Open-Group Obligations for Government Social Insurance Programs (trillions)
The figures in this table are staggering once we understand their meaning. First we have to set the context, because there are various accounting tricks people can play with these numbers. For example, for years before the 2008 recession hit, the Social Security Administration had been running cash-flow surpluses, meaning that it was collecting more in payroll “contributions” than it paid out to beneficiaries. Unfortunately, those surpluses weren’t invested in productive enterprises to generate future income for the program (the way a private retirement program would have done). Instead, the federal government spent the extra money, with the Treasury issuing IOUs to the Social Security Administration. This is the Social Security “Trust Fund”—a record of how much one part of the federal government owes to another part. As of January 1, 2009 (when the numbers here were estimated), the Social Security Trust Fund held $2.4 trillion in assets. But to repeat, those “assets” were merely pieces of paper saying that the US Treasury owed the Social Security Administration money.
Another accounting trick is that the SMI program (which includes Medicare Part B and Part D) has a formal funding requirement for any shortfall, whereas the HI and OASDI programs do not. Thus, the official figures of the “unfunded liability” of these programs exclude the $24.3 trillion shortfall that SMI faced when the previous table was compiled. But it obviously doesn’t make the financial burden of Medicare any easier if we simply assert, “Congress in the future has to pay for this.” The fact that its projected spending will exceed dedicated premium payments means that the general taxpayer will be on the hook to cover the shortfall.
In light of these considerations, we have chosen to highlight the “Budget Perspective” in Table 3-3, because this comes closest to what the average person has in mind when wondering, “How deep in the hole are these programs?” In the words of the Trustee Report: “From the 75-year budget perspective, the present value of the additional resources that would be needed to meet projected expenditures, at current-law levels for the three programs combined, is $45.8 trillion” (emphasis added).5
Such a gigantic number may cause your eyes to glaze over, but it’s crucial to understand what it actually means. First, just to get a feel for how enormous the figure is, consider that in 2009, the total GDP of the United States was only $14.4 trillion—meaning that the official budget hole from the three social insurance programs was more than triple the size of the economy’s entire output.
Yet it might still be hard to grasp just how severe the figure is. The $45.8 trillion number is a present-value calculation. The Trustee Report was saying that in 2009, the federal government would have needed $45.8 trillion right then to invest and start earning interest, so that over the next 75 years the government could draw down this side fund rather than hit up the taxpayers.
For one final clarification, the $45.8 trillion figure assumed payroll taxes and Medicare premium payments remained at scheduled 2009 levels. In the projections underlying Table 3-3, over the 75-year window workers still have money taken out of their paychecks, and the elderly still make premium payments for Medicare. That $45.8 trillion side fund was nonetheless needed to cover the projected shortfall between these dedicated revenue streams and the spending on the programs.
Thus we see that it is by no means metaphorical when critics deride the Social Security and Medicare programs as being “bankrupt.” If a private company had such books for its contractually guaranteed employee retirement and health insurance programs, it clearly would be declared insolvent.
In this chapter, we have described the financial position of the government’s major social insurance programs as of 2009, before the introduction of the Affordable Care Act. We explained that voluntary, private-sector planning for old age does not rely on favorable demographics, because each household longitudinally provides for its own future spending during a career of saving and investing.
In contrast, the government has run Social Security and Medicare as giant Ponzi schemes from their very inception, dependent on an influx of new workers to support the obligations due to those entering retirement. Rising medical costs, the aging of the baby boomers, and a decline in fertility rates placed the government’s insurance programs in an untenable position. On the eve of the Affordable Care Act, the government’s own analysts projected that these programs—primarily Medicare—were grossly underfunded by their dedicated mechanisms and would constitute a growing drain on the taxpayer.
As of 2009, every serious analyst knew that “something had to be done” to address the problem of Medicare and other government insurance programs. A rational response would have been, “Hmm, the government has been dabbling in providing health care to a large segment of the population—the elderly—for several decades, and it’s currently run up a funding hole bigger than the entire economy. Let’s try something else.”
Unfortunately, the politicians took America even deeper into the abyss. After blowing up the economics of health care for the elderly, the United States government would embark on “guaranteeing” health care for the entire population.
What could go wrong …?
“Oh, it’s a great healthcare plan… well worth selling the house to pay for.”