
BACKGROUND
Arterial blood pressure (ABP) is an essential cardiovascular vital sign and monitoring parameter for all critically ill patients. ABP may be measured indirectly using an inflatable external cuff or directly by cannulation of a peripheral artery.
Indirect ABP measurement is performed noninvasively and requires the use of an external expandable cuff and a pressure gauge, known as a sphygmomanometer. The cuff is wrapped around an extremity overlying an artery and inflated to a pressure that temporarily occludes arterial blood flow. The cuff is then gradually deflated, and blood pressure is determined by auscultation of Korotkoff sounds or by an automated system that measures oscillations as blood flow resumes.
While inexpensive and easy to perform, indirect ABP measurement has limitations that make it unsuitable for critically ill patients. Auscultation is cumbersome in a busy environment and is impaired by ambient noise. The patient's body habitus as well as improper cuff size, position, or external compression can prevent an accurate measurement.1–3 In critically ill patients, the principal disadvantage of indirect ABP measurement is the inability to provide continuous measurement, which is useful in hemodynamic compromise or vasopressor administration. Indirect measurements also frequently fail to correlate with direct pressure monitoring, especially in times of rapidly changing or unstable hemodynamics.4,5 Finally, repetitive cycling of the blood pressure cuff can result in arm pain, limb edema, ischemia, neuropathy, and, in rare cases, compartment syndrome.6–8
Direct ABP monitoring, in which a catheter is inserted into a peripheral artery and continuously transduced, is the benchmark for arterial pressure measurement and is considered standard of care for most critically ill patients. An ABP catheter enables dynamic monitoring and provides continual vascular access when repetitive blood sampling is required. As discussed later in this chapter, the arterial pressure waveform also offers a wealth of diagnostic information.
GENERAL DEFINITIONS
Systolic blood pressure (SBP) is the peak pressure generated by ventricular contraction, and diastolic blood pressure (DBP) is the lowest pressure observed during ventricular filling. Pulse pressure (PP) is defined as the difference between the systolic and diastolic pressures. Mean arterial pressure (MAP) is the time-weighted average of arterial pressures in a single cardiac cycle, and represents systemic perfusion pressure. MAP is calculated using the following formula:

Noninvasive blood pressure measurement determines SBP, DBP, and MAP by comparison of oscillatory characteristics to cuff pressures, where MAP is the point of maximal oscillations during cuff deflation.9 Direct ABP measurement produces an arterial waveform that consists of a systolic peak and a diastolic trough. MAP is then determined by integrating the area under the curve.10
DIRECT BLOOD PRESSURE MONITORING
Direct ABP monitoring provides continuous, beat-to-beat arterial pressure measurement, which is essential in the management of patients who are hemodynamically unstable, have advanced cardiovascular disease or significant dysrhythmia, require vasopressor support, or whose condition necessitates targeted blood pressure control (Table 4.1). Waveform analysis can also provide significant insight into a patient's physiology, including intravascular volume status, volume responsiveness, and the presence of valvular abnormalities. As previously mentioned, this modality provides dependable vascular access and is indicated in patients with pulmonary compromise or significant acid–base derangements where frequent blood sampling is required. Peripheral arterial catheters may also be placed in patients prior to the administration of thrombolytic therapy to facilitate the collection of laboratory studies.
TABLE 4.1 Comparison of Invasive and Noninvasive Blood Pressure Monitoring in Critically Ill Patients
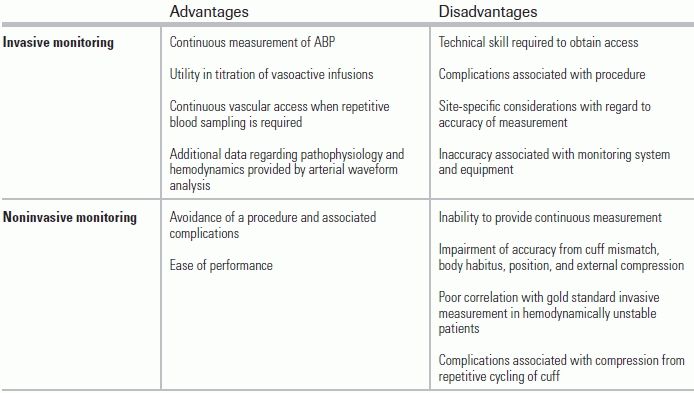
Factors that must be considered in site selection include the presence of adequate collateral circulation and patient comfort, as well as the phenomenon of distal pulse amplification that causes distal SBP measurements to be higher than central SBP, without significant differences in DBP or MAP.
The radial artery is the most commonly used vessel for ABP monitoring due to its superficial location, ease of cannulation, presence of collateral flow, and low risk of complications.11 However, due to its small caliber, this site carries the highest incidence of temporary arterial occlusion, reported to occur in over 25% of procedures performed.11–13 Despite its high incidence, temporary occlusion of the artery does not appear to have serious sequelae in most cases.11 Given its peripheral location, a radial artery catheter provides a less accurate measurement of aortic pressure than do more centrally placed catheters due to distal pulse wave amplification.
The femoral artery is the second most commonly used site. The central location of this vessel allows for more accurate measurement of aortic blood pressure, particularly in patients requiring high-dose vasopressor administration, and its larger caliber mitigates the risk of temporary arterial occlusion seen with radial catheters.11 However, clinicians must be cognizant of—and monitor for—retroperitoneal hemorrhage following cannulation. Historically, there has been reluctance to use this site given its proximity to the anogenital region and the concern that it carries an increased risk of infection. However, published studies do not uniformly substantiate or refute this concern.14,15
The axillary artery has gained popularity in recent decades as it permits measurement of central pressure using a cannulation site that is considered to be in a cleaner location. This approach is more technically challenging than are others, and is often avoided due to the theoretical risk of cerebral embolic events given its proximity to the carotid artery. The incidence of major complications associated with this cannulation site was similar to that of radial and femoral catheterization.11
Arterial catheterization is generally considered to be a safe procedure, but complications can and do occur, and must be factored into site selection (Table 4.2). Risks include temporary arterial occlusion, ischemia, pseudoaneurysm, arteriovenous fistula, infection, bleeding, air embolism, and hematoma.11,16 Patients with preexisting vascular disease, arterial injury, high-dose vasopressor administration, and long-term cannulation may be at higher risk for adverse events.10 Fortunately, serious complications occur in <1% of cases.11 Use of the Allen test does not minimize complications associated with arterial artery cannulation and has been abandoned.
TABLE 4.2 Complications of Arterial Lines

Contraindications are generally relative, site specific, and based upon consideration of risk and benefit. Relative contraindications include significant peripheral vascular disease and Raynaud syndrome due to the associated risk of limb ischemia, and severe coagulopathy or use of thrombolytics given the risk of bleeding. Placement of intra-arterial catheters should also be avoided at sites with signs of obvious infection, burns, vascular trauma, or previous vascular surgery or grafts.17,18 Cannulation ipsilateral to arteriovenous dialysis shunts will yield false results and should be avoided.
THE MONITORING SYSTEM
Data from the monitoring system must be converted into a waveform that can be visualized on the patient's monitor. Monitoring systems consist of several parts beyond the arterial cannula, including a fluid-filled system, transducer, flushing assembly, microprocessor, amplifier, and display.
The arterial pressure waveform is composed of a fundamental wave and a series of harmonic waves. The fundamental wave frequency is equivalent to the pulse rate, and the frequencies of the harmonic waves are multiples of the fundamental frequency. Fourier analysis, the process by which the complex arterial waveform is constructed from these component waves, is performed by the microprocessor, and the arterial waveform is then amplified and visually displayed on the monitor (Fig. 4.1).19

FIGURE 4.1 The arterial pressure waveform (C) is a sum of a fundamental wave (A) and six to eight harmonic waves (B). Summation is performed by Fourier analysis. From Pittman JA, Ping JS, Mark JB. Arterial and central venous pressure monitoring. Int Anesthesiol Clin. 2004;42:13–30.
The dynamic response of the ABP monitoring system is determined by resonant frequency and damping.10,20 Resonant (or natural) frequency is defined as the frequency at which a given material oscillates when disrupted. When a system is stimulated by a frequency that is close to its own resonant frequency, it oscillates and amplifies the incoming signal.9,21 Thus, if the frequencies of the fundamental or harmonic waves of an ABP waveform approach, coincide with, or overlap with the resonant frequency of the ABP monitoring system, amplification occurs and results in elevated SBP and PP measurements. The resonant frequency of the monitoring system is designed to be at least five to eight multiples above the fundamental frequency, and is determined by the physical properties of the system's components. Increasing tubing diameter while reducing tubing length, compliance, and density of the fluid in the system can increase the natural frequency of the monitoring system.
In addition to having a high resonant frequency, the ABP monitoring system must also be properly damped. Damping occurs when the energy in an oscillating system is reduced.21 While some degree of damping, termed critical damping, is essential in the monitoring system, overdamping and underdamping can result in inaccurate measurement of ABP. Overdamping may occur when the system contains excess tubing, stopcocks, occlusion, and air, and can be identified by examining the arterial waveform for a slurred upstroke, absent dicrotic notch, and loss of fine detail.9 Overdamped waves display falsely lower SBPs, falsely higher DBPs, and a narrowed PP, though MAP may still be accurate. Conversely, underdamping results in increased oscillations and therefore a falsely elevated SBP and PP. A patient's physiology can also result in underdamping; tachycardia increases the fundamental frequency given the high pulse rate. As the fundamental frequency approaches the resonant frequency of the monitoring system, oscillations are amplified and the system becomes underdamped.
The “square wave” or “fast flush” test evaluates the dynamic response of the monitoring system and helps predict signal distortion by determining the system's natural frequency and degree of damping. This test is performed by briefly opening the continuous flush valve and increasing the flow of fluid to 30 mL/h, which generates a square wave that can be seen on the patient's monitor. Once the valve is closed, the resulting oscillations on the waveform are examined. The system's natural frequency is inversely proportional to the time between successive oscillation peaks; if the oscillation cycle is shorter, the system has a higher natural frequency. The degree of damping is determined by evaluating the ratio of the amplitudes of adjacent oscillation peaks. The amplitude ratio is then referenced with a graph that contains the corresponding damping coefficient. In an underdamped system, the amplitude ratio of successive oscillation peaks will be higher, and the system will have a lower damping coefficient. Conversely, overdamped systems will have lower amplitude ratios, and an elevated damping coefficient (Fig. 4.2).
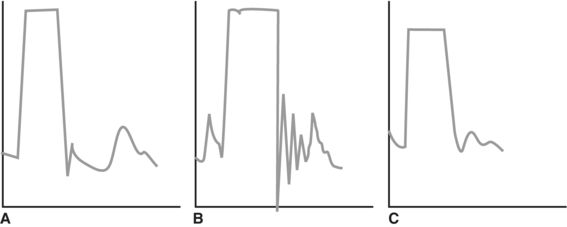
FIGURE 4.2 Square flush test. A:Optimal damping as evidenced by one to two oscillations prior to the return of the waveform. B:Underdamped: excessive oscillation and overestimation of the SBP. C:Overdamped: minimal oscillation and underestimation of the SBP.
Following cannulation and connection to the pressure transducer tubing, the ABP monitoring system must be leveled and zeroed in order to provide consistent and accurate ABP measurements.
Leveling is the process of eliminating the influence of hydrostatic pressure on the measured BP. The transducer is leveled to the phlebostatic axis, defined as the intersection of the 4th intercostal space and the midaxillary line. This external location correlates to the anatomic position of the right atrium, which reflects central blood pressure. If positioned too low, the transducer will produce a deceptively high-pressure reading; if positioned too high, it will produce a deceptively low reading. Occasionally, the transducer is placed at the level of the tragus when cerebral perfusion pressure is the primary concern.
Zeroing is the process of eliminating the effects of atmospheric pressure on measured BP. To zero the system, it is opened to atmospheric pressure and set to a pressure of zero. This ensures that atmospheric pressure is the starting value.
ARTERIAL PRESSURE WAVEFORM ANALYSIS
The arterial waveform consists of five main elements: systolic upstroke, systolic peak, systolic decline, dicrotic notch, and the point of end diastole (Fig. 4.3).
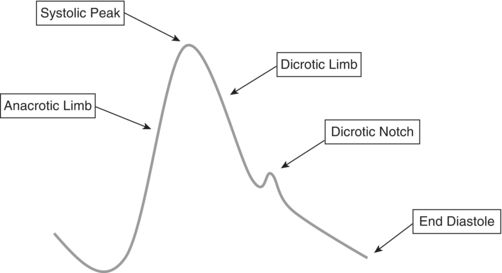
FIGURE 4.3 Arterial pressure waveform.
Close examination of the arterial line waveform can provide diagnostic clues regarding cardiac pathology, such as cardiac tamponade, aortic valvular disease, LV failure, and hypertrophic cardiomyopathy (Fig. 4.4A–D).
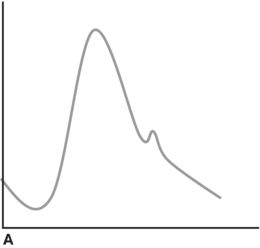

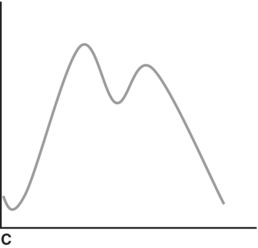
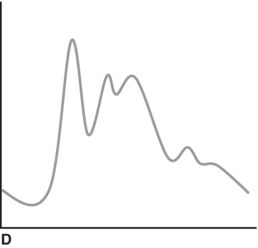
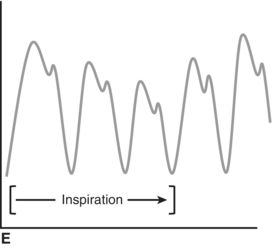
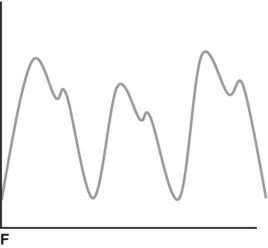
FIGURE 4.4 A: Normal arterial waveform. B: Pulsus parvus and pulsus tardus. C: Bisferiens pulse. D: Spike-and-dome. E: Pulsus paradoxus. F: Pulsus alternans.
CONCLUSION
Direct ABP monitoring is essential in the management of most critically ill patients. In addition to providing the dynamic BP monitoring these patients require, a nuanced appreciation of arterial BP waveforms can greatly assist the clinician in understanding a patient's underlying physiology.
LITERATURE TABLE

1.Bur A, et al. Accuracy of oscillometric blood pressure measurement according to the relation between cuff size and upper-arm circumference in critically ill patients. Crit Care Med. 2000;28:371–376.
2.Hager H, et al. A comparison of noninvasive blood pressure measurement on the wrist with invasive arterial blood pressure monitoring in patients undergoing bariatric surgery. Obes Surg. 2009;19:717–724.
3.Bur A, et al. Factors influencing the accuracy of oscillometric blood pressure measurement in critically ill patients. Crit Care Med. 2003;31:793–799.
4.Horowitz D, Amoateng-Adjepong Y, Zarich S, et al. Arterial line or cuff BP? Chest. 2013;143:270–271.
5.Araghi A, Bander JJ, Guzman JA. Arterial blood pressure monitoring in overweight critically ill patients: invasive or noninvasive? Crit Care. 2006;10:R64.
6.Jeon YS, Kim YS, Lee JA, et al. Rumpel-Leede phenomenon associated with noninvasive blood pressure monitoring—a case report. Korean J Anesthesiol. 2010;59:203–205.
7.Lin CC, Jawan B, de Villa MV, et al. Blood pressure cuff compression injury of the radial nerve. J Clin Anesth. 2001;13:306–308.
8.Alford JW, Palumbo MA, Barnum MJ. Compartment syndrome of the arm: a complication of noninvasive blood pressure monitoring during thrombolytic therapy for myocardial infarction. J Clin Monit Comput. 2002;17:163–166.
9.Ward M, Langton J. Blood pressure measurement. Contin Educ Anaesth Crit Care Pain. 2007;7(4).
10.Schroeder R, Barbeito A, Bar-Yosef S, et al. Miller's Anesthesia. USA: Churchill Livingstone; 2009.
11.Scheer B, Perel A, Pfeiffer UJ. Clinical review: complications and risk factors of peripheral arterial catheters used for haemodynamic monitoring in anaesthesia and intensive care medicine. Crit Care. 2002;6:199–204.
12.Soderstrom CA, Wasserman DH, Dunham CM, et al. Superiority of the femoral artery of monitoring. A prospective study. Am J Surg. 1982;144, 309–312.
13.Bedford RF. Wrist circumference predicts the risk of radial-arterial occlusion after cannulation. Anesthesiology. 1978;48:377–378.
14.Frezza EE, Mezghebe H. Indications and complications of arterial catheter use in surgical or medical intensive care units: analysis of 4932 patients. Am Surg. 1988;64:127–131.
15.Lorente L, Santacreu R, Martin MM, et al. Arterial catheter-related infection of 2,949 catheters. Crit Care. 2006;10:R83.
16.Salmon AA, et al. Analysis of major complications associated with arterial catheterisation. Qual Saf Health Care. 2010;19:208–212.
17.Milzma D, Janchar T. Arterial puncture and cannulation. In: Roberts J, Hedges J, eds. Clinical Procedures in Emergency Medicine. Philadelphia, PA: WB Saunders; 2004:384–400.
18.Stroud S, Rodriguez R. Arterial puncture and cannulation. In: Reichman E, Simon R, eds. Emergency Medicine Procedures. New York, NY: McGraw Hill; 2003:298–410.
19.Pittman JA, Ping JS, Mark JB. Arterial and central venous pressure monitoring. Int Anesthesiol Clin. 2004;42:13–30.
20.Gilbert M. Principles of pressure transducers, resonance, damping and frequency response. Anaest Intens Care Med. 2012;13:1.
21.Boutros A, Albert S. Effect of the dynamic response of transducer-tubing system on accuracy of direct blood pressure measurement in patients. Crit Care Med. 1983;11:124–127.
22.Roth JV. The spike-and-dome arterial waveform pattern. J Cardiothorac Vasc Anesth. 1994;8:484.
23.Lehman L, Saeed M, Talmor D, et al. Methods of blood pressure measurement in the ICU. Crit Care Med. 2013;41:33–40.