APPENDIX 7B
ADDITIONAL FINANCIAL RATIOS
We presented our core financial ratios in Chapter 7. However, there are additional ratios that you may wish to calculate to better evaluate the financial position and operating results of your organization. Or, you may have an earned income venture or for-profit subsidiary, and you wish to apply some business ratios to that venture's or subsidiary's operating results. We will present some liquidity and operating ratios that are commonly used by businesses, and many of these could be applied by health care organizations, colleges, and the for-profit subsidiaries of other nonprofits. We then look at some ratios calculated by charity rating agencies and information providers (Charity Navigator and GuideStar). We follow this with some ratios making use of the information in the Statement of Cash Flows. We then profile some Form 990 ratios that have benchmark data available for your comparison. Finally, we present some of our own faith-based organization benchmark data compiled from audited financials.
7B.1 BUSINESS LIQUIDITY, FUNDING, AND OPERATING RATIOS
(a) LIQUIDITY RATIOS. We briefly list average collection period (ACP), inventory conversion period (ICP), average payment period (APP), operating cycle (OC), and the cash conversion period (CCP) here. For more details, see Chapters 2 and 3 of Zietlow, Hill, and Maness, Short-Term Financial Management, Fifth Edition (consult the Notes following Chapter 7 for full citation).
ICP (also called Days Inventory Held, or DIH) measures the length of time it takes to convert your inventory into sales. Again, shorter is better, because inventories also tie up your cash. The denominator has Cost of Goods Sold, not sales, because inventories are accounted for at cost. To use sales there would also distort the measurement because it includes the mark-up added to your cost.

ACP (also called Day Sales Outstanding, or DSO) measures the length of time it takes to collect credit sales. You want this to be as close to your offered credit period (commonly 30 days) as possible, and higher numbers tie up more of your cash.

Your operating cycle (OC) is the sum of the elapsed times for converting inventories to sales and then collecting on those sales (so that you once again have cash):

Fortunately, you are not out-of-pocket for cash that long, normally. This is because you buy inventories on credit, normally. We adjust for this by first calculating the average payment period (APP), then subtracting that from the operating cycle to get the cash conversion period.
APP (also called Days Payable Outstanding, or DPO) measures the length of time it takes to pay for your credit purchases. You want this to be as close to your suppliers' offered credit periods (commonly 30 days) as possible, but some businesses stretch payables unethically because higher numbers tie up less of their cash as it ties up more of their suppliers' cash.

Many times purchases data are not available to an external analyst, and cost of goods sold is used in the denominator instead.
We may now calculate the cash conversion period (CCP), which shows us for how long the organization has its cash tied up in its operations:

or

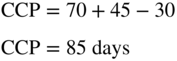
Illustrating, if ICP is 70 days, ACP is 45 days, and APP is 30 days, CCP would be:
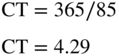
We can use this information to estimate minimum operating cash (MOC; a misnomer since we are really estimating “working capital” here) for an organization. First, we calculate cash turnover (CT), which measures how many times per year cash cycles through the organization:

In our example, since CCP = 85 days:
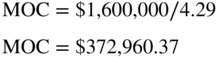
Think of this as similar to inventory turnover, but the turnover is in your inventory of cash. Some organizations estimate their minimum cash by taking some percent of their sales (for example, if set to 8% of sales, and sales are $2 million annually, minimum cash = $160,000 = .08 × $2,000,000). Our CT data, coupled with annual cash expenses, gives us another way to estimate minimum operations-related cash, or MOC (you would hold cash for other reasons, as well, as noted in Chapter 2):

If annual cash expenses are $1,600,000, using our CT of 4.29, we get MOC:
To monetize the effect of this on your annual interest expense, multiply this by your annual cost of capital (this concept is covered in Chapter 10). Assuming your cost of long-term funds is 10%, or 0.10 in decimal form, we get an annual interest expense related to our cash conversion period of $37,296:

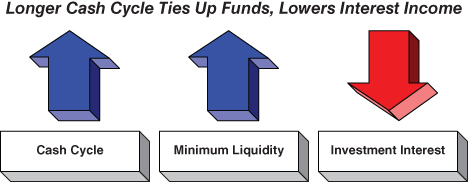
If we could convert our inventories more quickly, collect our receivables more quickly, or renegotiate more favorable payment terms, we could reduce our CCP, increase our CT, reduce our MOC, and thereby reduce the interest expense related to our operating cycle. When the CCP increases, we get the opposite effect, as shown in the following chain reaction diagram:
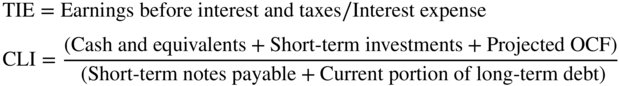
(b) FUNDING RATIOS. The two funding ratios we present here are times interest earned (TIE) and the current liquidity index (CLI). Both ratios reflect on our organization's ability to cover its fixed, financing-related obligations. Higher ratio values are better as they reflect a greater ability to cover those obligations:
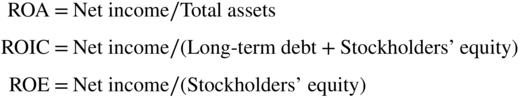
(c) OPERATING RATIOS. Several profitability ratios that businesses use are return on assets (ROA), return on invested capital (ROIC), and return on equity (ROE). Each measures profits (or what nonprofits call net revenue, typically measured by change in net assets, which may be adjusted by the analyst) relative to an important variable: assets invested in the business (ROA), long-term capital invested in the business (ROIC), or stockholder equity invested in the business (ROE). Higher values show greater profitability, and this is positive so long as a company is not underinvesting in training, advertising, new product development, and other forms of research and development:
7B.2 OTHER RATIOS USED BY CHARITY RATING SERVICES
(a) CHARITY NAVIGATOR. Charity Navigator (CN) assigns scores to charities' financial condition based on numerous financial ratios. The pros are: (1) great ratios selection; (2) great scaling of ratio values based both on logic and on the industry (e.g., daycare centers have a different scaling than food banks); (3) its reports draw from a database of peer data that provides good benchmark data (although charities, like businesses, are sometimes diversified and therefore not purely operating in one industry, so the benchmark may be partly inapplicable for comparison purposes); and (4) its scoring system rewards, rather than penalizes, organizations for holding higher cash reserves (see our discussion of liquidity and CN in Chapter 2).
The primary con is: CN's reports and scoring are based only on one year of data, and this is based on the organization's most recently filed, sometimes inaccurate (and non-GAAP), Form 990.
Especially helpful for us in our focus on liquidity, solvency, and financial flexibility is Charity Navigator's focus on “organizational capacity,” which it measures with three ratios:
- Average annual growth of program expenses for the most recent four years.
- This is what many would call a compound annual growth rate of program expenses.
- You may calculate this with a financial calculator or in Excel or using one of the free Internet online calculators.
- Debt ratio.
- Working capital ratio.
Numerator: (Unrestricted Net Assets + Temporarily Restricted Net Assets).
Denominator: Average Total expenses, including payments to affiliates, for the last three years.
Details on Charity Navigator's methodology are available at its website (https://www.charitynavigator.org/index.cfm?bay=content.view&cpid=35).
(b) GUIDESTAR. GuideStar, an information provider that gives ratios and other financial data, has revamped its financial ratio presentation and now markets a Financial SCANSM report that is jointly developed with the Nonprofit Finance Fund. This is an outstanding resource, as it includes (1) a “Financial Health Dashboard” that gives some financial data and financial ratio trend data for up to five years, (2) a “Peer Comparison Dashboard,” which enables the user to search for, select, and then compare the financial data and ratios from up to five peer nonprofits with its own data and ratios, and (3) a “Graphical Analysis” that includes 13 multi-year graphs as well as brief interpretations of the line and bar graph trends in the organization's finances.
GuideStar presents the following ratios, a number of which we presented in Chapter 7:
- Growth rate of Total Revenue, Total Expenses, and Personnel
- Each major revenue source as a % of Total Revenue & Support
- Change in Unrestricted Net Assets, both in $ and as a % of Total Expenses
- Accumulated Depreciation as a % of Land, Buildings, and Equipment
- Debt Ratio
- Months of Expenses held in Cash
- Months of Expenses held in Cash and Investments
- Months of Expenses held in Estimated Unrestricted Liquid Net Assets
These ratios are not only available for a single organization but are also compiled if you do a “Peer Comparison Dashboard” report. In the “Graphical Analysis” report, there are four bars provided in a bar graph for each of the most recent five years: Cash, Receivables, Land, Buildings & Equipment (LBE), and Investments and other. In this way one can see at a glance how the organization's asset composition has changed over those five years. Subscription options and fees as well as a brief video explaining the Financial SCANSM product offering are available at the GuideStar website (https://learn.guidestar.org/products/nonprofit-data-solutions/financial-scan).
7B.3 STATEMENT OF CASH FLOWS RATIOS
Notice that almost all of the other ratios we present in Chapter 7 and the appendixes take information from the Statement of Activities and Statement of Financial Position, but not the Statement of Cash Flows (SCF). The ratios in this section take information from the SCF as well as the SA and SFP, and are helpful for lenders, rating agencies, and other analysts doing evaluations of businesses. Some of these ratios, such as the OCF ratio, will be helpful for all organizations. The others may be helpful in your evaluation of health care and education nonprofits, as well as earned income ventures. (These are presented by John R. Mills and Jeanne H. Yamamura, in “The Power of Cash Flow Ratios,” Journal of Accountancy (October 1998).)
Liquidity and Funding Ratios
- Operating cash flow (OCF) ratio:

where OCF is taken off of the SCF (the subtotal that you will see at the end of the first category of items on the organization's SCF). Current liabilities are on the SFP, but many nonprofits do not classify their SFP, so take A/P + Accrued expenses + Deferred revenue + Short-term portion of N/P to get CL in this case. Compare to similar organizations.
- Funds flow coverage (FFC) ratio:
EBITDA is earnings (or change in net assets) before interest, taxes, depreciation, and amortization. So add back the latter items to the change in net assets to arrive at EBITDA. Interest expense should be the cash amount of interest paid (which may be provided as a supplemental disclosure below the SCF) and debt repayment is the sum of short-term debt and any current maturities of long-term debt (which may represent bonds issued 19 years ago with an original 20-year maturity, so they are now within one year of repayment).

In our presentation here, we have modified the original FFC ratio for nonprofits' tax-exempt status. Done for a business, this ratio has both debt repayment and preferred dividends in the denominator, and each must be divided by (1 − marginal tax rate) to “gross up” the amount to enable the organization to both pay taxes and meet the financial obligation.
Rationale for this ratio, relative to SCF ratio: OCF has interest and taxes already subtracted out; EBITDA does not. Compare the calculated value to that of similar organizations.
- Cash interest coverage ratio:

Again, use cash interest paid and if the ratio value is less than 1.0, there is an immediate risk of potential default on debt obligations.
- Cash current debt coverage ratio:

where, since nonprofits do not have dividends, the numerator is just OCF, and the denominator is all debt maturing within one year, just as in the funds flow coverage ratio (#2 above). Higher ratios are better, but an appropriate minimum value depends on the industry (health care would differ from education, for example).
Measures of Ongoing Financial Health
- Capital expenditure ratio:

This ratio is similar to our OCF/ICF measure in Chapter 7. It separates out from ICF the line item representing additional investment in property, plant, and equipment. If the ratio value is greater than 1.0, the organization has enough cash to cover all capital expenditures and has money left over to meet debt obligations.
- Total debt (cash flow to total debt) ratio:

where total debt includes all short-term and long-term arranged debt. This gives the amount of time it would take to pay off all debt from the organization's operating cash flow, assuming all OCF was to be dedicated to debt repayment. Lower ratio values signal less financial flexibility and potential problems in the future. Compare value to those of similar organizations.
- Total free cash (TFC) flow ratio:
Numerator: Total free cash = (Change in net assets + Accrued and capitalized interest expense + Depreciation and amortization + Operating lease and rental expense − Capital expenditures)
Denominator: Total fixed obligations = (Accrued and capitalized interest expense + Operating lease and rental expense + Current portion of long-term debt + Current portion of capitalized lease obligations)

The numerator is some definition of free cash, and net-free cash flow is defined differently by different analysts. The denominator is the sum of many fixed financial and operating obligations. Because there are so many items in the numerator and denominator, we show them separately. We modified the numerator slightly to change “Net income” to “Change in net assets” and to eliminate dividends. This ratio looks much like a fixed-payment coverage ratio, with the numerator using mostly SA items. The capital expenditures number may include only those capital expenditures necessary to maintain the organization's operating assets (maybe some percentage of total assets, such as 2%, or some percentage of property, plant, and equipment, such as 5%). For assessing long-term growth, you may use actual capital expenditures from the SCF, however.
Organizational Credit Quality
- Cash flow adequacy (CFA) ratio:
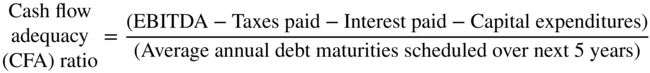
EBITDA is the same as in the FFC ratio (ratio # 2 above). A high ratio value means the organization has good cash flow relative to upcoming debt obligations, and is therefore a high credit-quality borrower from the vantage point of a lender or bond-rating agency.
7B.4 RATIOS WITH COMPARATIVE BENCHMARK DATA AVAILABLE (BASED ON FORM 990)
Greenlee, Randolph, and Richtermeyer (using Form 990 data) have developed a very helpful set of financial ratios, and along with it, benchmark data by industry. In this section we include several exhibits from their analysis.
In Exhibit 7B.1, you see the ratios used for determining whether the nonprofit has adequate resources. PPE refers to property, plant, and equipment. Notice that these are liquidity and funding ratios.
| Ratio Definitions: Adequacy of Financial Resources |
| Defensive interval (DEI) = (end-of-year: cash + savings + accounts receivable + grants receivable + receivables due from officers and directors + prepaid expenses) ÷ (total expenses − depreciation and depletion) |
| Liquid funds (LF) = (end-of-year: cash + savings + accounts receivable + prepaid expenses) ÷ [total expenses − (depreciation + depletion)] |
| Accounts payable aging (APA) = (end-of-year: accounts payable + accrued expenses) ÷ [total expenses − (depreciation + depletion) ÷ 12] |
| Savings (SAV) = total revenue ÷ total expenses |
| Contributions and grants (CNG) = (government grants + total contributions) ÷ total revenue |
| Debt (DEB) = end-of-year total liabilities ÷ end-of-year total assets |
Source: Janet S. Greenlee, David W. Randolph, Sandra B. Richtermeyer, “Better Analytical Reviews of Charitable Organizations,” The CPA Journal (July 2011): 32–36. Used by permission.
Exhibit 7B.1 Greenlee, Randolph and Richtermeyer Resource Adequacy Ratio Definitions
In Exhibit 7B.2, we see the ratios used for evaluating the uses to which funds are put.
| Ratio Definitions: Use of Financial Resources to Execute the Charity's Mission |
| Fund-raising efficiency (FE) = (direct public support + cash contributions) ÷ total functional expense, fund raising |
| Fund-raising expense (FX) = fund-raising expense ÷ total expense |
| Management expense (MX) = management and general expense ÷ total expense |
| Program service expense (PX) = program service expense ÷ total expense |
| Program service expense to average total assets (PA) = program service expense ÷ [(beginning-of-year total assets + end-of-year total assets) ÷ 2] |
| Return on investment (ROI) = (interest + dividends) ÷ [(beginning-of-year investments in securities + end-of-year investments in securities) ÷ 2] |
Source: Janet S. Greenlee, David W. Randolph, Sandra B. Richtermeyer, “Better Analytical Reviews of Charitable Organizations,” The CPA Journal (July 2011): 32–36. Used by permission.
Exhibit 7B.2 Greenlee, Randolph and Richtermeyer Resource Utilization Ratio Definitions
In Exhibit 7B.3, we see the industries into which nonprofits were categorized for purposes of displaying benchmark ratio standards for your resource adequacy comparisons.
| Ratios: Adequacy of Financial Resources Median by Sector and Quartile | |||||||
| Revenues | DEI | LF | APA | SAV | CNG | DEB | |
| Arts, Culture, Humanities (AR) | |||||||
| 1. | <$371,256 | 6.4426 | 6.4191 | .3232 | 1.0416 | .5759 | .0687 |
| 2. | $371,256–$2,801,306 | 4.1503 | 3.8862 | .5443 | 1.0466 | .6475 | .0593 |
| 3. | $2,801,307–$11,692,850 | 4.7207 | 4.1535 | .9006 | 1.1768 | .6224 | .0870 |
| 4. | >$11,692,850 | 4.3348 | 3.7558 | 1.4940 | 1.1742 | .6130 | .1407 |
| Number of Charities | 1,018 | 1,018 | 831 | 1,021 | 969 | 896 | |
| Education (ED) | |||||||
| 1. | <$1,011,853 | 7.3704 | 7.1821 | .3881 | 1.0957 | .4909 | .0830 |
| 2. | $1,011,853–$5,256,342 | 5.1615 | 5.0615 | .6699 | 1.0997 | .4960 | .1874 |
| 3. | $5,256,343–$16,815,517 | 4.9639 | 4.8577 | .9589 | 1.1278 | .2813 | .2422 |
| 4. | >$16,815,517 | 4,3907 | 4.2631 | 1.1198 | 1.2540 | .3293 | .2210 |
| Number of Charities | 1,990 | 1,988 | 1,610 | 2,018 | 1,761 | 1,728 | |
| Hospitals (EH) | |||||||
| 1. | <$53,984,502 | 3.4751 | 3.4146 | 1.4472 | 1.0435 | .0101 | .4113 |
| 2. | $53,984,502–$130,000,000 | 2.9060 | 2.8991 | 1.4809 | 1.0393 | .0060 | .4659 |
| 3. | $130,000,001–$277,000,000 | 2.6718 | 2.6605 | 1.4945 | 1.0407 | .0054 | .4812 |
| 4. | >$277,000,000 | 2.6168 | 2.6048 | 1.5121 | 1.0548 | .0096 | .4748 |
| Number of Charities | 2,052 | 2,052 | 2,034 | 2,055 | 1,786 | 2,053 | |
| Environment (EN) | |||||||
| 1. | <$333,660 | 10.9358 | 8.1989 | .3446 | 1.0492 | .7566 | .0483 |
| 2. | $333,660–$1,797,858 | 5.8867 | 5.4327 | .4115 | 1.0795 | .6682 | .0297 |
| 3. | $1,797,859–$8,794,508 | 4.5703 | 4.1595 | .6909 | 1.1557 | .7519 | .0539 |
| 4. | >$8,794,508 | 4.6026 | 4.0636 | 1.1933 | 1.1402 | .8181 | .1311 |
| Number of Charities | 418 | 418 | 337 | 423 | 399 | 364 | |
| Health (HE) | |||||||
| 1. | <$1,791,674 | 8.7627 | 8.4565 | .5777 | 1.0877 | .6553 | .0876 |
| 2. | $1,791,674–$7,728,327 | 4.1113 | 3.8563 | .9509 | 1.0761 | .4748 | .1746 |
| 3. | $7,728,328–$21,921,284 | 3.3515 | 3.1256 | 1.0637 | 1.0655 | .3135 | .2679 |
| 4. | >$21,921,284 | 2.9931 | 2.8116 | 1.2643 | 1.0412 | .0919 | .4475 |
| Number of Charities | 2,052 | 2,051 | 1,826 | 2,089 | 1,625 | 1,938 | |
| Human Service (HU) | |||||||
| 1. | <$525,222 | 5.2200 | 5.0460 | .8334 | 1.0048 | .7024 | .1956 |
| 2. | $525,222–$2,543,398 | 4.3086 | 4.0494 | .7855 | 1.0201 | .5890 | .3044 |
| 3. | $2,543,399–$10,920,557 | 3.4256 | 3.1380 | .9538 | 1.0393 | .3127 | .3260 |
| 4. | >$10,920,557 | 2.8956 | 2.7839 | 1.2606 | 1.0358 | .0833 | .5740 |
| Number of Charities | 4,033 | 4,028 | 3,534 | 4,065 | 3,334 | 3,752 | |
| Public and Social Benefit (PU) | |||||||
| 1. | < $687,956 | 7.3913 | 7.2192 | .5074 | 1.0724 | .6922 | .1592 |
| 2. | $687,956–$4,230,047 | 7.4127 | 6.4111 | .5370 | 1.1908 | .7935 | .1392 |
| 3. | $4,230,048–$18,324,309 | 5.8485 | 5.2439 | .5053 | 1.3695 | .7738 | .1592 |
| 4. | >$18,324,309 | 4.8516 | 4.4807 | .7470 | 1.1820 | .8217 | .1866 |
| Number of Charities | 1,457 | 1,455 | 1,124 | 1,503 | 1,173 | 1,238 | |
| Religion (RE) | |||||||
| 1. | < $169,014 | 2.3442 | 2.3442 | .3074 | 1.0246 | .9996 | .2514 |
| 2. | $169,014–$754,205 | 3.4724 | 3.4100 | .1184 | 1.0654 | .9090 | .2566 |
| 3. | $754,206–$2,875,491 | 3.7834 | 3.7761 | .3931 | 1.1039 | .6679 | .3952 |
| 4. | >2,875,491 | 4.0632 | 4.0632 | .9023 | 1.2170 | .5545 | .1473 |
| Number of Charities | 344 | 344 | 215 | 355 | 299 | 251 | |
Source: Janet S. Greenlee, David W. Randolph, Sandra B. Richtermeyer, “Better Analytical Reviews of Charitable Organizations,” The CPA Journal (July 2011): 32–36. Used by permission.
Exhibit 7B.3 Greenlee, Randolph and Richtermeyer Resource Adequacy Ratio Benchmarks
Finally, in both tables in Exhibit 7B.4, we have the comparative ratio benchmarks for resource utilization. Compare your organization's Form 990–based ratios to these benchmarks to give a sense of how your organization matches up.
| Ratios: Use of Financial Resources to Execute the Charity's Mission Median, by Sector and Quartile | |||||||
| Revenues | FE | FX | MX | PX | PA | ROI | |
| Arts, Culture, Humanities (AR) | |||||||
| 1. | < $371,256 | 23.8293 | .0383 | .1690 | .8226 | .2260 | .0465 |
| 2. | $371,256–$2,801,306 | 13.6292 | .0668 | .1700 | .7500 | .1748 | .0356 |
| 3. | $2,801,307–$11,692,850 | 13.4409 | .0743 | .1582 | .7609 | .1202 | .0366 |
| 4. | > $11,692,850 | 17.7102 | .0600 | .1371 | .7921 | .1635 | .0302 |
| Number of Charities | 724 | 730 | 997 | 1,003 | 1,003 | 608 | |
| Education (ED) | |||||||
| 1. | < $1,011,853 | 23.0391 | .0419 | .1235 | .8832 | .2353 | .0378 |
| 2. | $1,011,853–$5,256,342 | 21.2065 | .0366 | .1416 | .8390 | .2154 | .0403 |
| 3. | $5,256,343–$16,815,517 | 14.3380 | .0367 | .1472 | .8179 | .2154 | .0389 |
| 4. | > $16,815,517 | 15.8052 | .0433 | .1218 | .8326 | .1845 | .0328 |
| Number of Charities | 1,160 | 1,169 | 1,864 | 2,000 | 1,998 | 1,239 | |
| Hospitals (EH) | |||||||
| 1. | < $53,984,502 | 8.6281 | .0043 | .1520 | .8571 | .6397 | .0473 |
| 2. | $53,984,502–$130,000,000 | 8.7257 | .0019 | .1537 | .8463 | .7716 | .0495 |
| 3. | $130,000,001–$277,000,000 | 7.5654 | .0020 | .1340 | .8656 | .8455 | 0470 |
| 4. | > $277,000,000 | 13.4050 | .0015 | .1279 | .8702 | .7902 | .0425 |
| Number of Charities | 477 | 498 | 1,996 | 2,030 | 2,029 | 1,383 | |
| Environment (EN) | |||||||
| 1. | < $333,660 | 33.4627 | .0383 | .1212 | .8631 | .3446 | .0483 |
| 2. | $333,660–$1,797,858 | 22.9503 | .0593 | .1466 | .8019 | .1538 | .0297 |
| 3. | $1,797,859–$8,794,508 | 20.3131 | .0760 | .1184 | .8013 | .1962 | .0539 |
| 4. | > $8,794,508 | 18.2616 | .0571 | .0969 | .8118 | .2203 | .1311 |
| Number of Charities | 297 | 298 | 406 | 419 | 419 | 242 | |
| Health (HE) | |||||||
| 1. | < $1,791,674 | 18.2403 | .0624 | .1339 | .8517 | .2288 | .0386 |
| 2. | $1,791,674–$7,728,327 | 18.8132 | .0528 | .1354 | .8365 | .3136 | .0360 |
| 3. | $7,728,328–$21,921,284 | 16.2440 | .0229 | .1299 | .8550 | .6083 | .0376 |
| 4. | > $21,921,284 | 18.2270 | .0121 | .1073 | .8767 | .9028 | .0448 |
| Number of Charities | 792 | 807 | 1,956 | 2,033 | 2,032 | 1,158 | |
| Human Service (HU) | |||||||
| 1. | < $525,222 | 23.3920 | .0344 | .1325 | .8896 | .2604 | .0392 |
| 2. | $525,222–$2,543,398 | 18.4174 | .0432 | .1241 | .8583 | .2907 | .0460 |
| 3. | $2,543,399–$10,920,557 | 16.8319 | .0321 | .1185 | .8598 | .3969 | .0474 |
| 4. | > $10,920,557 | 17.1286 | .0117 | .1104 | .8771 | .4447 | .0453 |
| Number of Charities | 1,722 | 1,748 | 3,670 | 4,000 | 3,997 | 1,666 | |
| Public and Social Benefit (PU) | |||||||
| 1. | < $687,956 | 19.3500 | .0588 | .1493 | .8551 | .1177 | .0361 |
| 2. | $687,956–$4,230,047 | 24.8112 | .0591 | .1216 | .8475 | .0990 | .0350 |
| 3. | $4,230,048–$18,324,309 | 42.9367 | .0348 | .0998 | .8645 | .1133 | .0338 |
| 4. | >$18,324,309 | 48.6445 | .0293 | .0773 | .8842 | .2314 | .4052 |
| Number of Charities | 697 | 703 | 1,420 | 1,478 | 1,478 | 924 | |
| Religion (RE) | |||||||
| 1. | < $169,014 | 63.2568 | .0198 | .1270 | .9155 | 1.0535 | .2514 |
| 2. | $169,014–$754,205 | 30.0097 | .0283 | .1464 | .8101 | .2681 | .2566 |
| 3. | $754,206–$2,875,491 | 30.0097 | .0283 | .1464 | .8101 | .2681 | .2019 |
| 4. | >$2,875,491 | 24.4025 | .0394 | .1382 | .8407 | .2585 | .1473 |
| Number of Charities | 145 | 146 | 307 | 345 | 345 | 160 | |
Source: Janet S. Greenlee, David W. Randolph, Sandra B. Richtermeyer, “Better Analytical Reviews of Charitable Organizations,” The CPA Journal (July 2011): 32–36. Used by permission.
Exhibit 7B.4 Greenlee, Randolph, and Richtermeyer Resource Utilization Ratio Benchmarks
7B.5 COMPARATIVE BENCHMARK DATA FOR FAITH-BASED ORGANIZATIONS (BASED ON SA AND SFP)
(a) RATIO MEDIANS: FAITH-BASED ORGANIZATIONS. Here are some ratio medians we have compiled with the assistance of Capin Crouse LLP for faith-based organizations. All of them are based on audited financial statements, not Form 990 data.
Note: NA means not available; lambda requires a forecast of the new period's operating cash flow. Source: © 2006 Capin Crouse LLP and John T. Zietlow. All rights reserved worldwide.