Chapter 2
Family trees
organising materials and processes
Abstract
Classification is the first step in creating an information management system for materials and processes. In it, the records for the members of each Universe (materials or processes) are indexed by their position in tree-like hierarchies, making retrieval easy. There are six broad families of materials for mechanical design: metals, ceramics, glasses, polymers, elastomers, and hybrids that combine the properties of two or more of the others. Processes, too, can also be grouped into families: those that create shape, those that join, and those that modify the surface to enhance its properties or to protect or decorate it. The members of the families can be organised into a hierarchical tree-like catalogue, allowing them to be looked up in much the same way that you would look up a member of a company in a management sheet. This structure forms the basis of computer-based material selection systems. It enables a unique way of presenting data for materials and processes as property charts, two of which appear in this chapter.
Keywords
Classification; Computer-aided information management; Information management; Materials tree; Process tree; Process–property interaction
2.1. Introduction and synopsis
A successful product – one that performs well, gives pleasure to the user, and is good value for money – uses the best materials for the job and fully exploits their potential and characteristics.
The families of materials – metals, polymers, ceramics and so forth – are introduced in Section 2.2. But it is not, in the end, a material that we seek in design; it is a certain profile of properties – the one that best meets the needs of the design. The members of each family have characteristics in common – a sort of ‘family likeness’ – which is useful when deciding which family offers the best starting point for a given design. Section 2.2 explains how this enables a classification scheme for materials, allowing information about them to be organised.
Choosing a material is only half the story. The other half is the choice of a process route to shape, join and finish it. Section 2.3 introduces process families and their attributes. Choice of material and process are tightly coupled: a given material can be processed in some ways but not others, and a given process works with some materials but not with others. On top of that, the act of processing can change, even create, the properties of the material (Section 2.4). Process families, too, exhibit family likenesses – commonality in the materials that members of a family can handle, or the shapes they can make. Section 2.3 introduces a classification for processes that parallels that for materials.
Family likenesses are most strikingly seen in material property charts, which are a central feature of this book (Section 2.5). These are charts with material properties as axes showing the location of the families and their members. Materials have many properties. They can be thought of as the axes of a ‘material–property’ space – each chart is a two-dimensional slice through this space. Each material family occupies a discrete part of this space, distinct from the other families. The charts give an overview of materials and their properties; they reveal aspects of the science underlying the properties, and they provide a powerful tool for materials selection. Process attributes can be treated in a similar way to create process attribute charts. We leave these for Chapter 18.
The classification systems of Sections 2.2 and 2.3 provide a structure for computer-based information management, which is introduced in Section 2.6. In common with the rest of the book, the chapter ends with a summary, further reading and exercises.
2.2. Organising materials: the materials tree
Classifying materials. It is conventional to classify the materials of engineering into the six broad families shown in Figure 2.1: metals, polymers, elastomers, ceramics, glasses and hybrids – composite materials made by combining two or more of the others. There is sense in this: the members of a family have certain features in common – similar properties, similar processing routes and, often, similar applications.
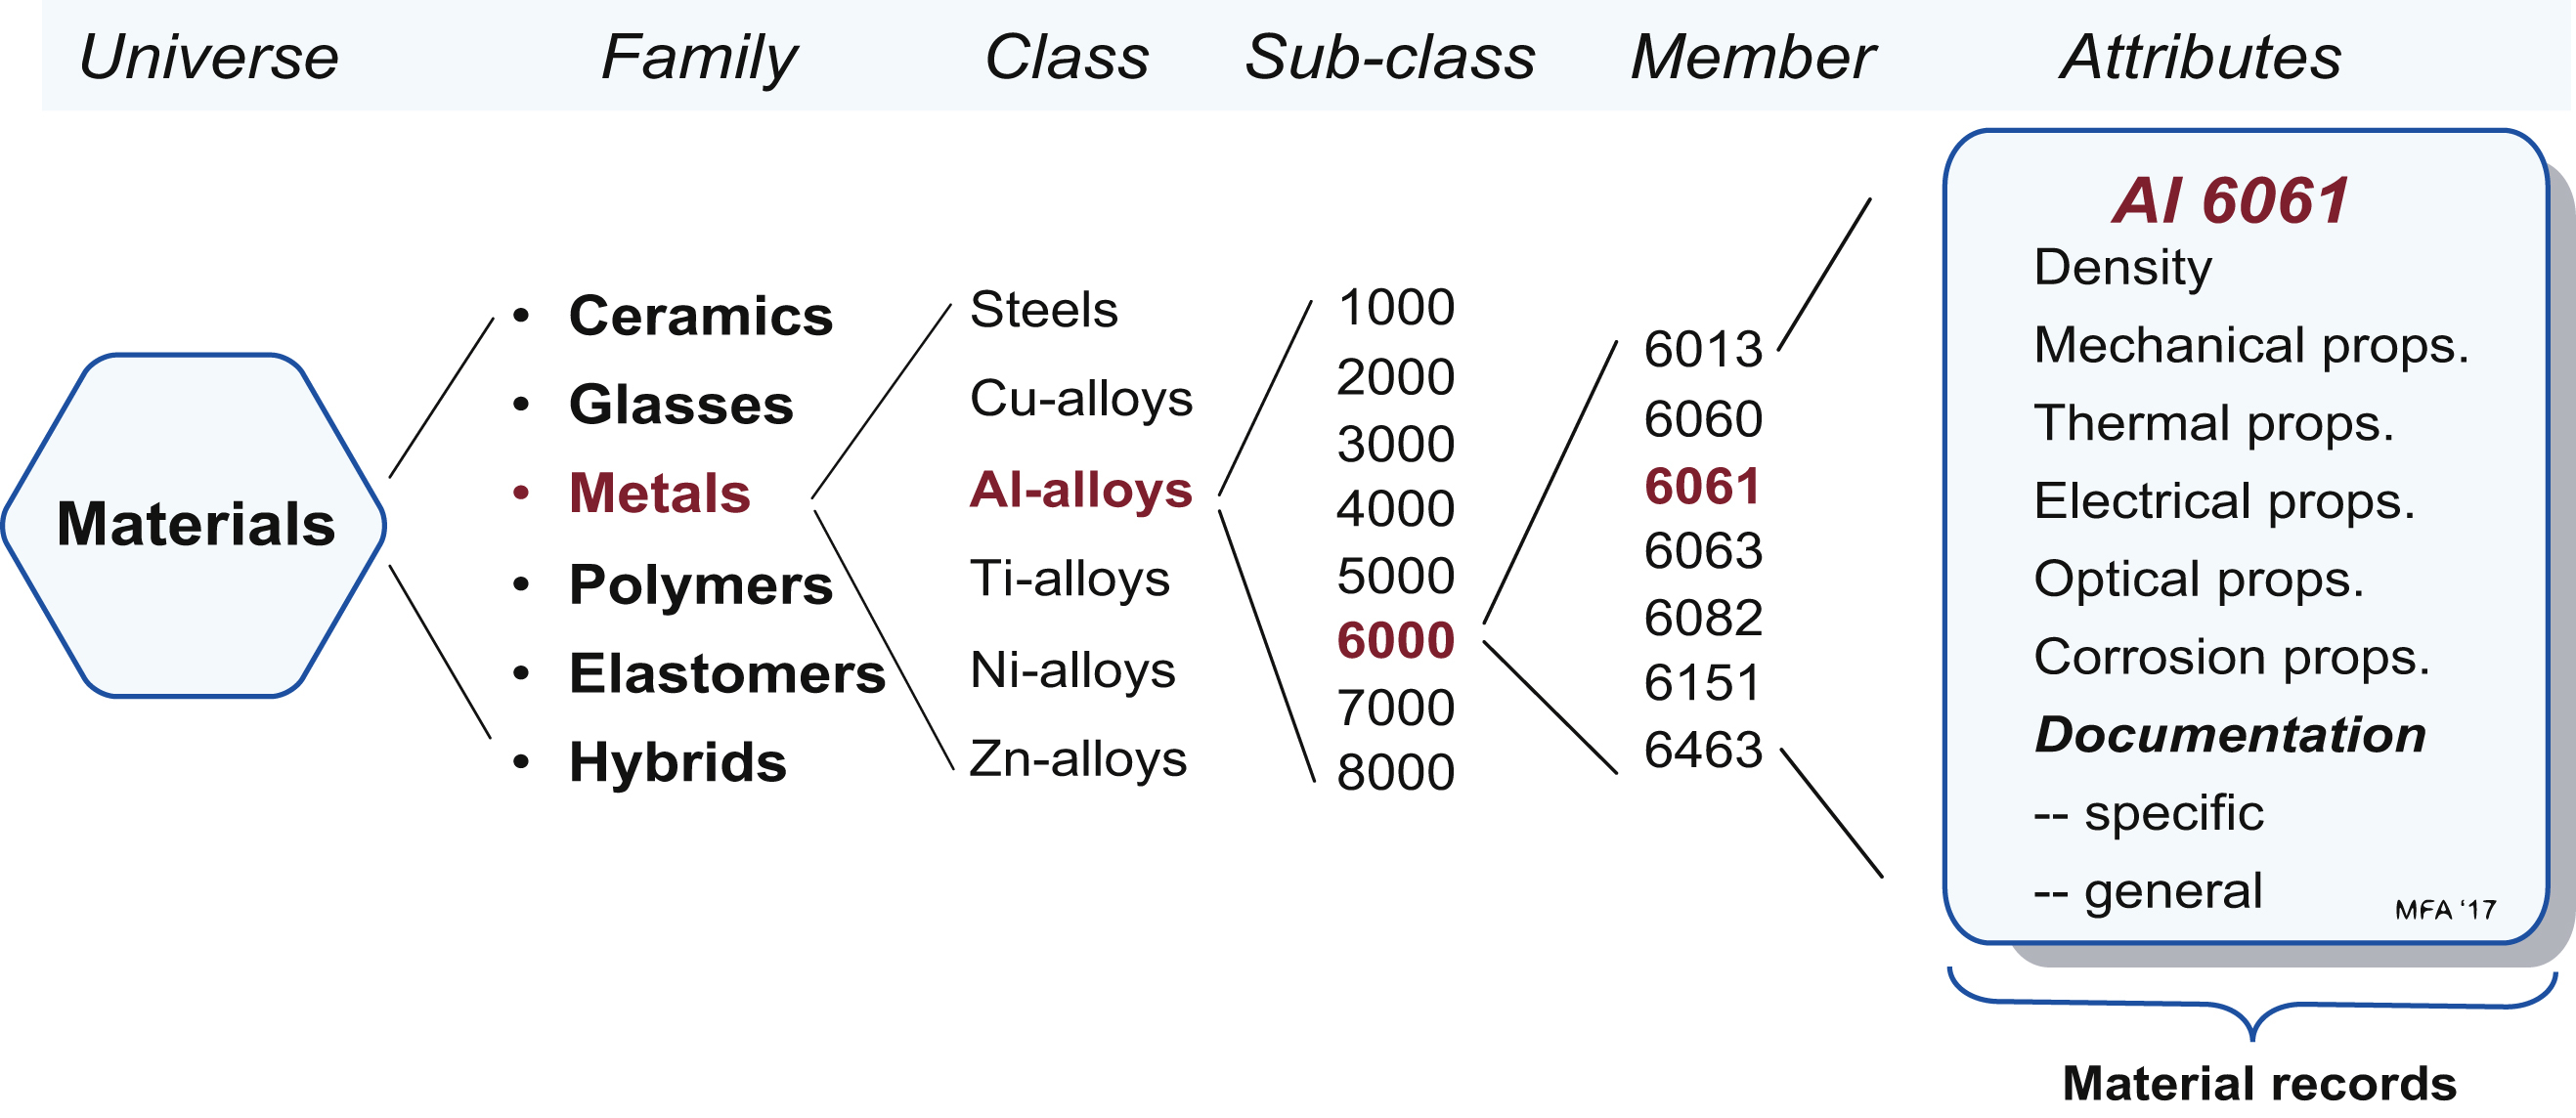
Figure 2.2 illustrates how the families are expanded to show classes, sub-classes and members, each of which is characterised by a set of attributes: its properties. As an example, the Materials Universe contains the family Metals, which in turn contains the class Aluminium alloys, which contains the sub-class the 6000 series, within which we find the particular member Alloy 6061. It, and every other member of the Universe, is characterised by a set of attributes that include not only the properties mentioned in Chapter 1, but also its processing characteristics and its typical applications. We call this its property profile.

As already mentioned, the members of one family have certain characteristics in common. Here, briefly, are some of them. Metals have relatively high stiffness, measured by the elastic modulus E. Most, when pure, are soft and easily deformed, meaning that the yield strength σy is low. They can be made stronger by alloying and by mechanical and heat treatment, increasing σy, but they remain ductile, allowing them to be formed by deformation processes like rolling or forging. And, broadly speaking, they are tough, with a usefully high fracture toughness, K1c. They are good electrical and thermal conductors. But metals have weaknesses too: they are reactive, and most corrode rapidly if not protected.
Ceramics are non-metallic, inorganic solids, like porcelain or alumina – the material of the insulator casing of the spark plug in a petrol engine. They have many attractive features: they are stiff, hard and abrasion resistant; they retain their strength at high temperatures; and they resist corrosion well. Most are good electrical insulators. They, too, have their weaknesses: unlike metals, they are brittle, with low K1c. giving ceramics a low tolerance for stress concentrations (like holes or cracks) or for high contact stresses (at clamping points, for instance).
Glasses are non-crystalline (‘amorphous’) solids, a term explained more fully in Chapter 4. The commonest are the soda-lime and boro-silicate glasses familiar as bottles and Pyrex ovenware, but there are many more. The lack of crystal structure suppresses plasticity, so, like ceramics, glasses are hard and remarkably corrosion resistant. They are excellent electrical insulators, and of course, they are transparent to light. But like ceramics, they are brittle and vulnerable to stress concentrations.
Polymers are organic solids based on long-chain molecules of carbon atoms (or, in a few, silicon). Polymers are light – their densities ρ are less than those of the lightest metals. Compared with other families, they are floppy, with moduli E that are roughly 50 times less than those of metals. But they can be strong, and because of their low density, their strength per unit weight is comparable to that of metals. Their properties depend on temperature, so a polymer that is tough and flexible at room temperature may be brittle at the −4°C of a household freezer, yet turn rubbery at the 100°C of boiling water. Few have useful strength above 150°C. If these aspects are allowed for in the design, the many advantages of polymers can be exploited. They are easy to shape (which is why they are called ‘plastics’). Complicated parts performing several functions can be moulded from a polymer in a single operation. Their properties are well suited for components that snap together, making assembly fast and cheap. And by accurately sizing the mould and pre-colouring the polymer, no finishing operations are needed. Good design exploits these properties.
Elastomers, the material of rubber bands and running shoes, are polymers with the unique property that their stiffness, measured by E, is extremely low – 500 to 5000 times less than those of metals – and they can be stretched to many times their starting length yet recover their initial shape when released. Despite their low stiffness, they can be strong and tough – think of car tires.
Hybrids are combinations of two (or more) materials in an attempt to get the best of both. Glass- and carbon-fibre reinforced polymers (GFRP and CFRP) are hybrids; so, too, are sandwich structures, foams and laminates. And almost all the materials of nature – wood, bone, skin, leaf – are hybrids. Bone, for instance, is a mix of collagen (a polymer) with hydroxyapatite (a mineral). Hybrid components are expensive, and they are relatively difficult to form and join. So despite their attractive properties, the designer will use them only when the added performance justifies the added cost. Today's growing emphasis on high performance, light weight and fuel efficiency provide increasing drivers for their use.
2.3. Organising processes: the process tree
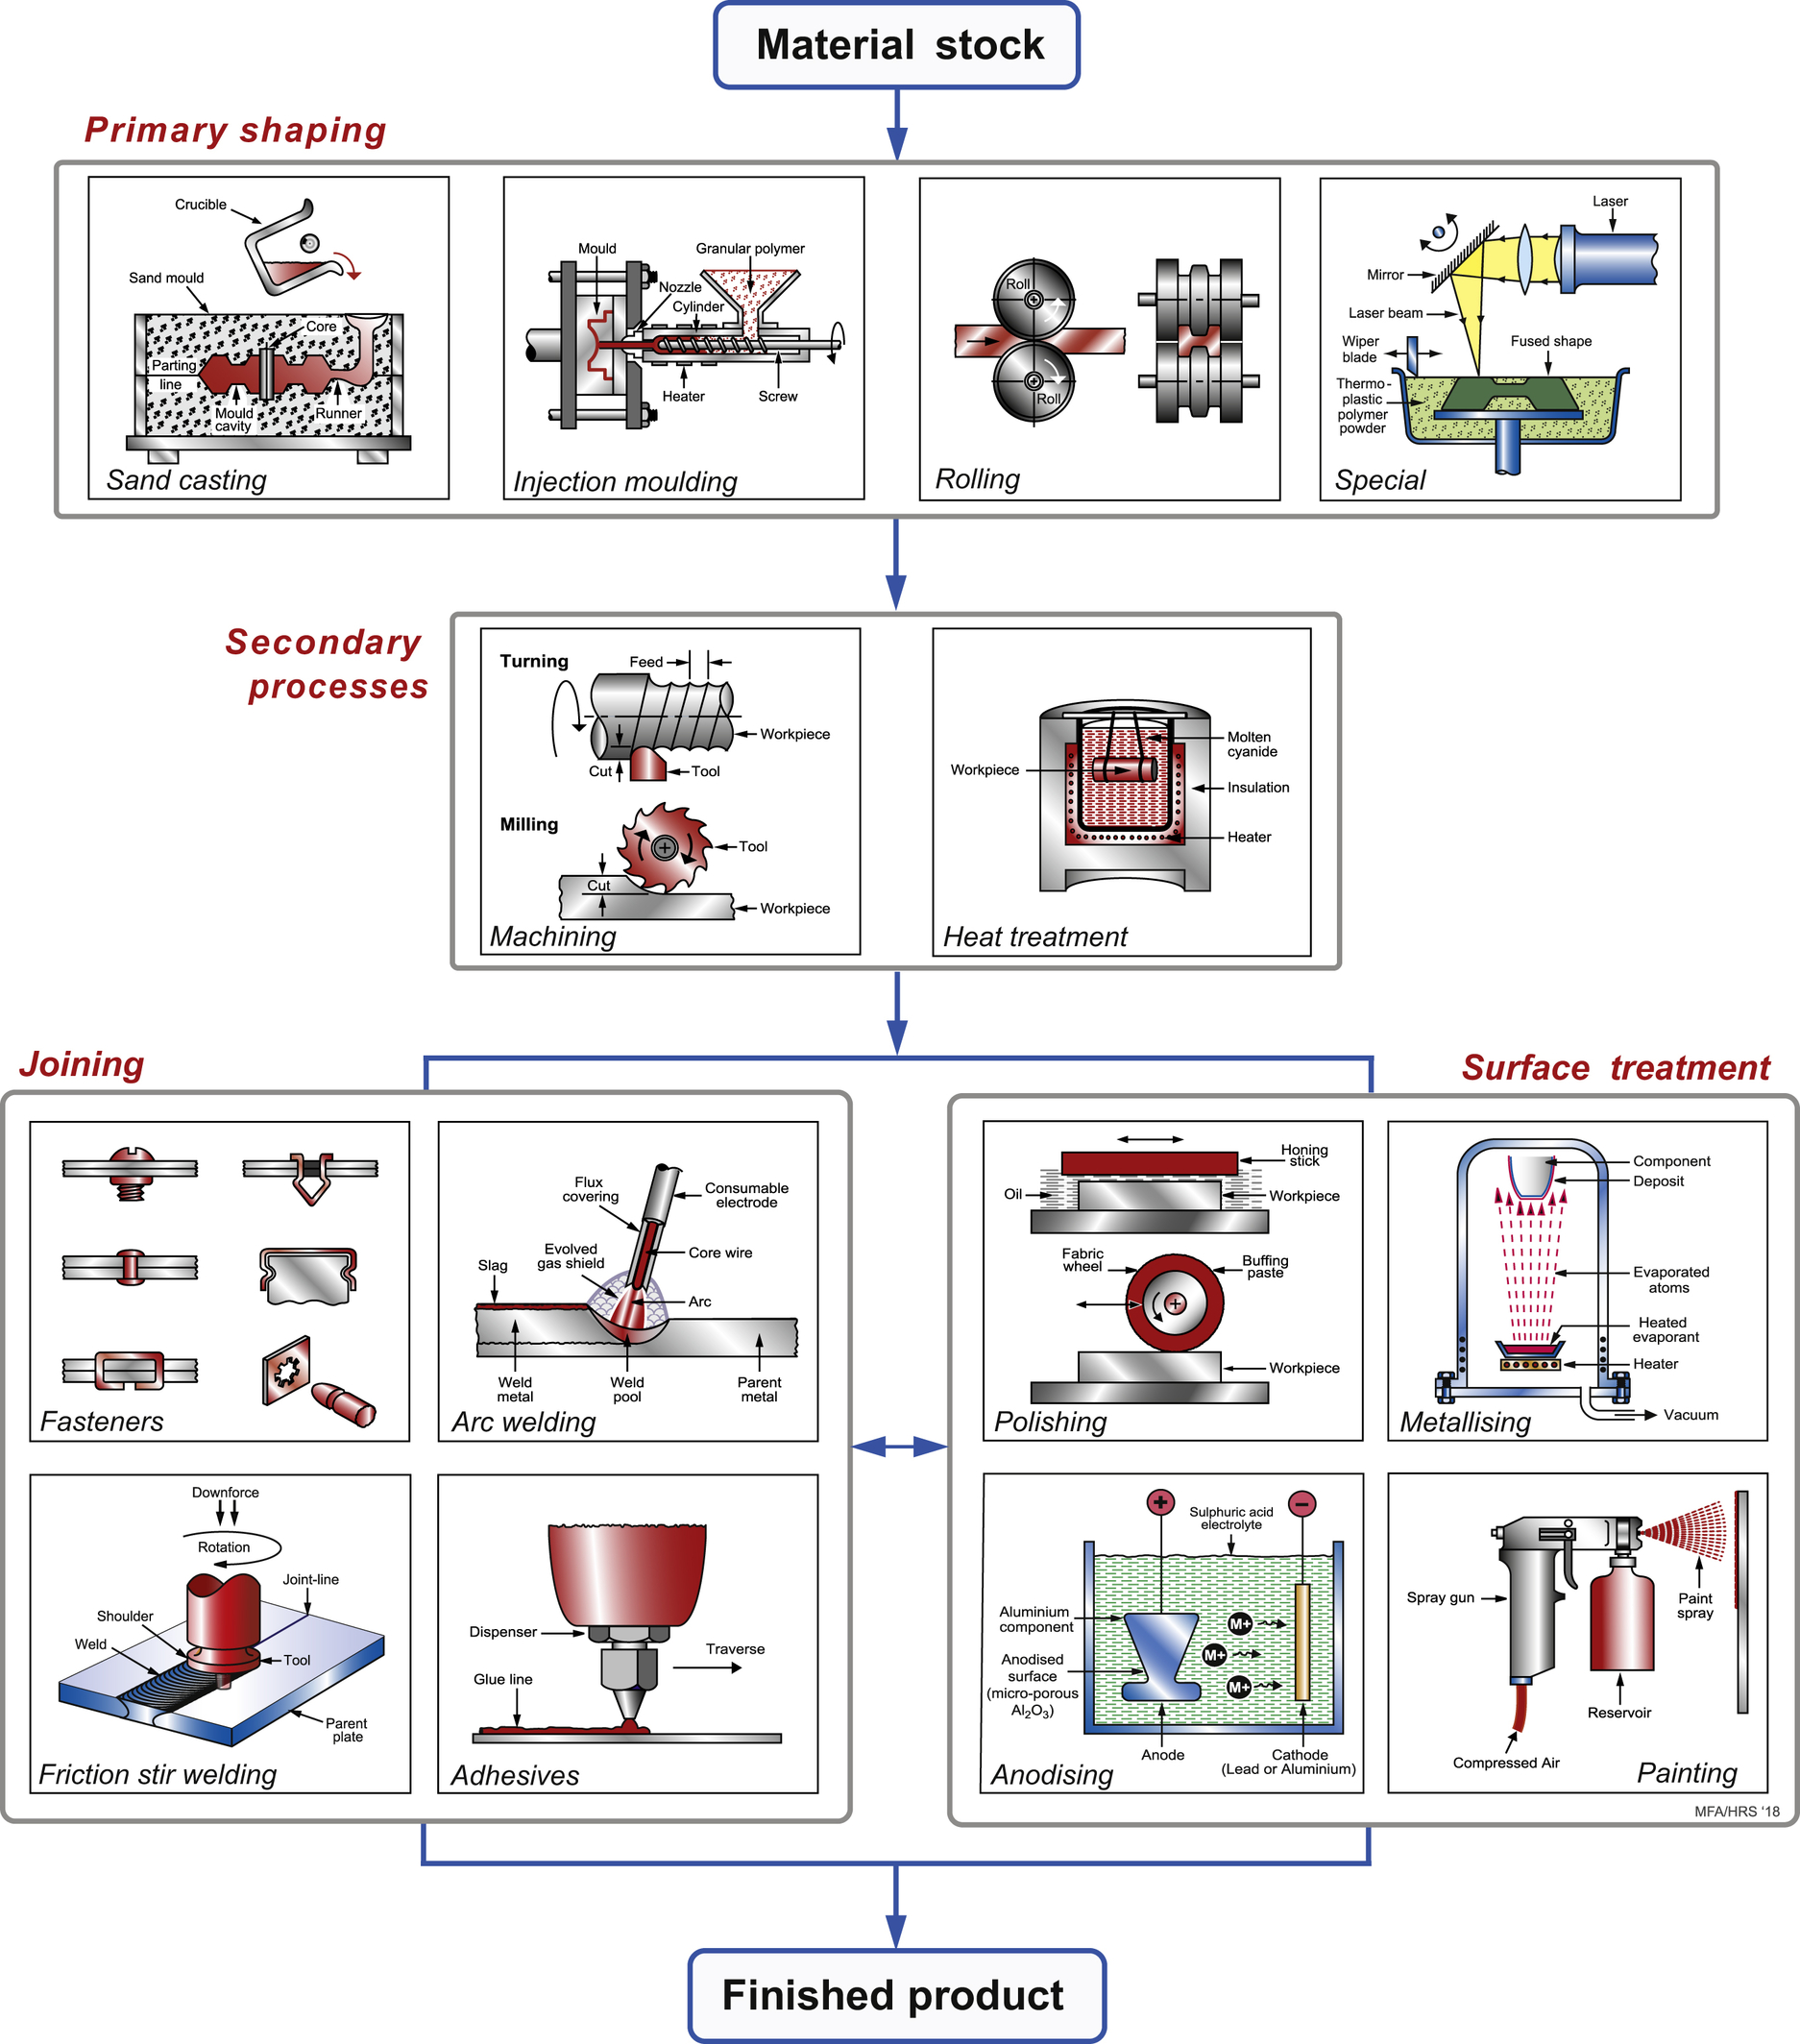
A process is a method of shaping, joining or finishing a material. Casting, injection moulding, fusion welding and electro-polishing are all processes, and there are hundreds of them to choose from (Figures 2.3 and 2.4). It is important to select the right process route at an early stage in the design before the cost penalty of making changes becomes large. The choice for a given component depends on the material of which it is to be made; on its shape, dimensions and precision; and on how many are to be made – in short, on the design requirements.

The choice of material limits the choice of process. Polymers can be moulded; other materials cannot. Ductile materials can be forged, rolled and drawn, but those that are brittle must be shaped in other ways. Materials that melt at modest temperatures to low-viscosity liquids can be cast; those that do not have to be processed by other routes. Shape, too, influences the choice of process. Slender shapes can be made easily by rolling or drawing but not by casting. Hollow shapes cannot be made by forging, but they can by casting or moulding.
Classifying processes
Manufacturing processes are organised under the headings shown in Figure 2.3. Primary processes create shapes. The first row lists six primary forming processes: casting, moulding, deformation, powder methods, methods for forming composites, and special methods including additive manufacture. Secondary processes modify shapes or properties; here they are shown as machining, which adds features to an already shaped body, and heat treatment, which enhances bulk properties. Below these come joining, and, finally, surface treatment. Figure 2.4 illustrates some of these; it is organised in the same way as Figure 2.3. The figure is a sort of flow chart: a progression through a manufacturing route. It should not be treated too literally; the order of the steps can be varied to suit the needs of the design.
Information about processes can be arranged in a hierarchical classification like that used for materials, giving each process a place. Figure 2.5 shows part of the hierarchy. The Process Universe has three families: shaping, joining and surface treatment. In this figure, the shaping family is expanded to show classes: casting, deformation, moulding and so on. One of these, moulding, is again expanded to show its members: rotation moulding, blow moulding, injection moulding and so forth. Each process is characterised by a set of attributes: the materials it can handle, the shapes it can make, their size, precision and an economic batch size (the number of units that it can make most economically).

The other two families are partly expanded in Figure 2.6. There are three broad classes of joining process: adhesives, welding and fasteners. In this figure, one of them, welding, is expanded to show its members. As before, each member has attributes. The first is the material or materials that the process can join. After that, the attribute list differs from that for shaping. Here the geometry of the joint and the way it will be loaded are important, as are requirements that the joint can or cannot be disassembled, be watertight or be electrically conducting.

The lower part of the figure expands the family of surface treatment processes. Some of the classes it contains are shown; one, coating, is expanded to show some of its members. Finishing adds cost; the only justification for applying a finishing process is that it hardens, protects or decorates the surface in ways that add value.
We will return to process selection in Chapter 18, exploring how far a database of processes and their attributes can take us in design.
2.4. Process–property interaction
Processing can change properties. If you deform a metal, it gets harder (‘work hardening’); if you then heat it up, it gets softer again (‘annealing’). If polyethylene (PE) – the stuff of plastic bags – is drawn to a fibre, its strength is increased by a factor of five because the polymer chains are drawn into alignment. Soft, stretchy rubber is made hard and brittle by vulcanising. Glass can be chemically and thermally treated to give it the impact resistance to withstand a projectile (‘bulletproof glass’). And composites like carbon fibre-reinforced epoxy have no useful properties at all until processed – prior to processing, they are just a soup of resin and a sheaf of fibres.
Joining, too, changes properties. Fusion welding involves the local melting and re-solidifying of the faces of the parts to be joined. As you might expect, the weld zone has properties that differ from those of the material far from the weld – usually worse. Surface treatments, by contrast, are generally chosen to improve properties: electroplating to improve corrosion resistance, or carburising to improve wear.
We return to process–property interactions in depth in Chapter 19, but many examples of the effect of processing on properties will be encountered on the way.
2.5. Material property charts
Data sheets for materials list their properties, but they give no perspective and present no comparisons. The way to achieve these is to plot material property charts. They are of two types: bar charts and bubble charts.
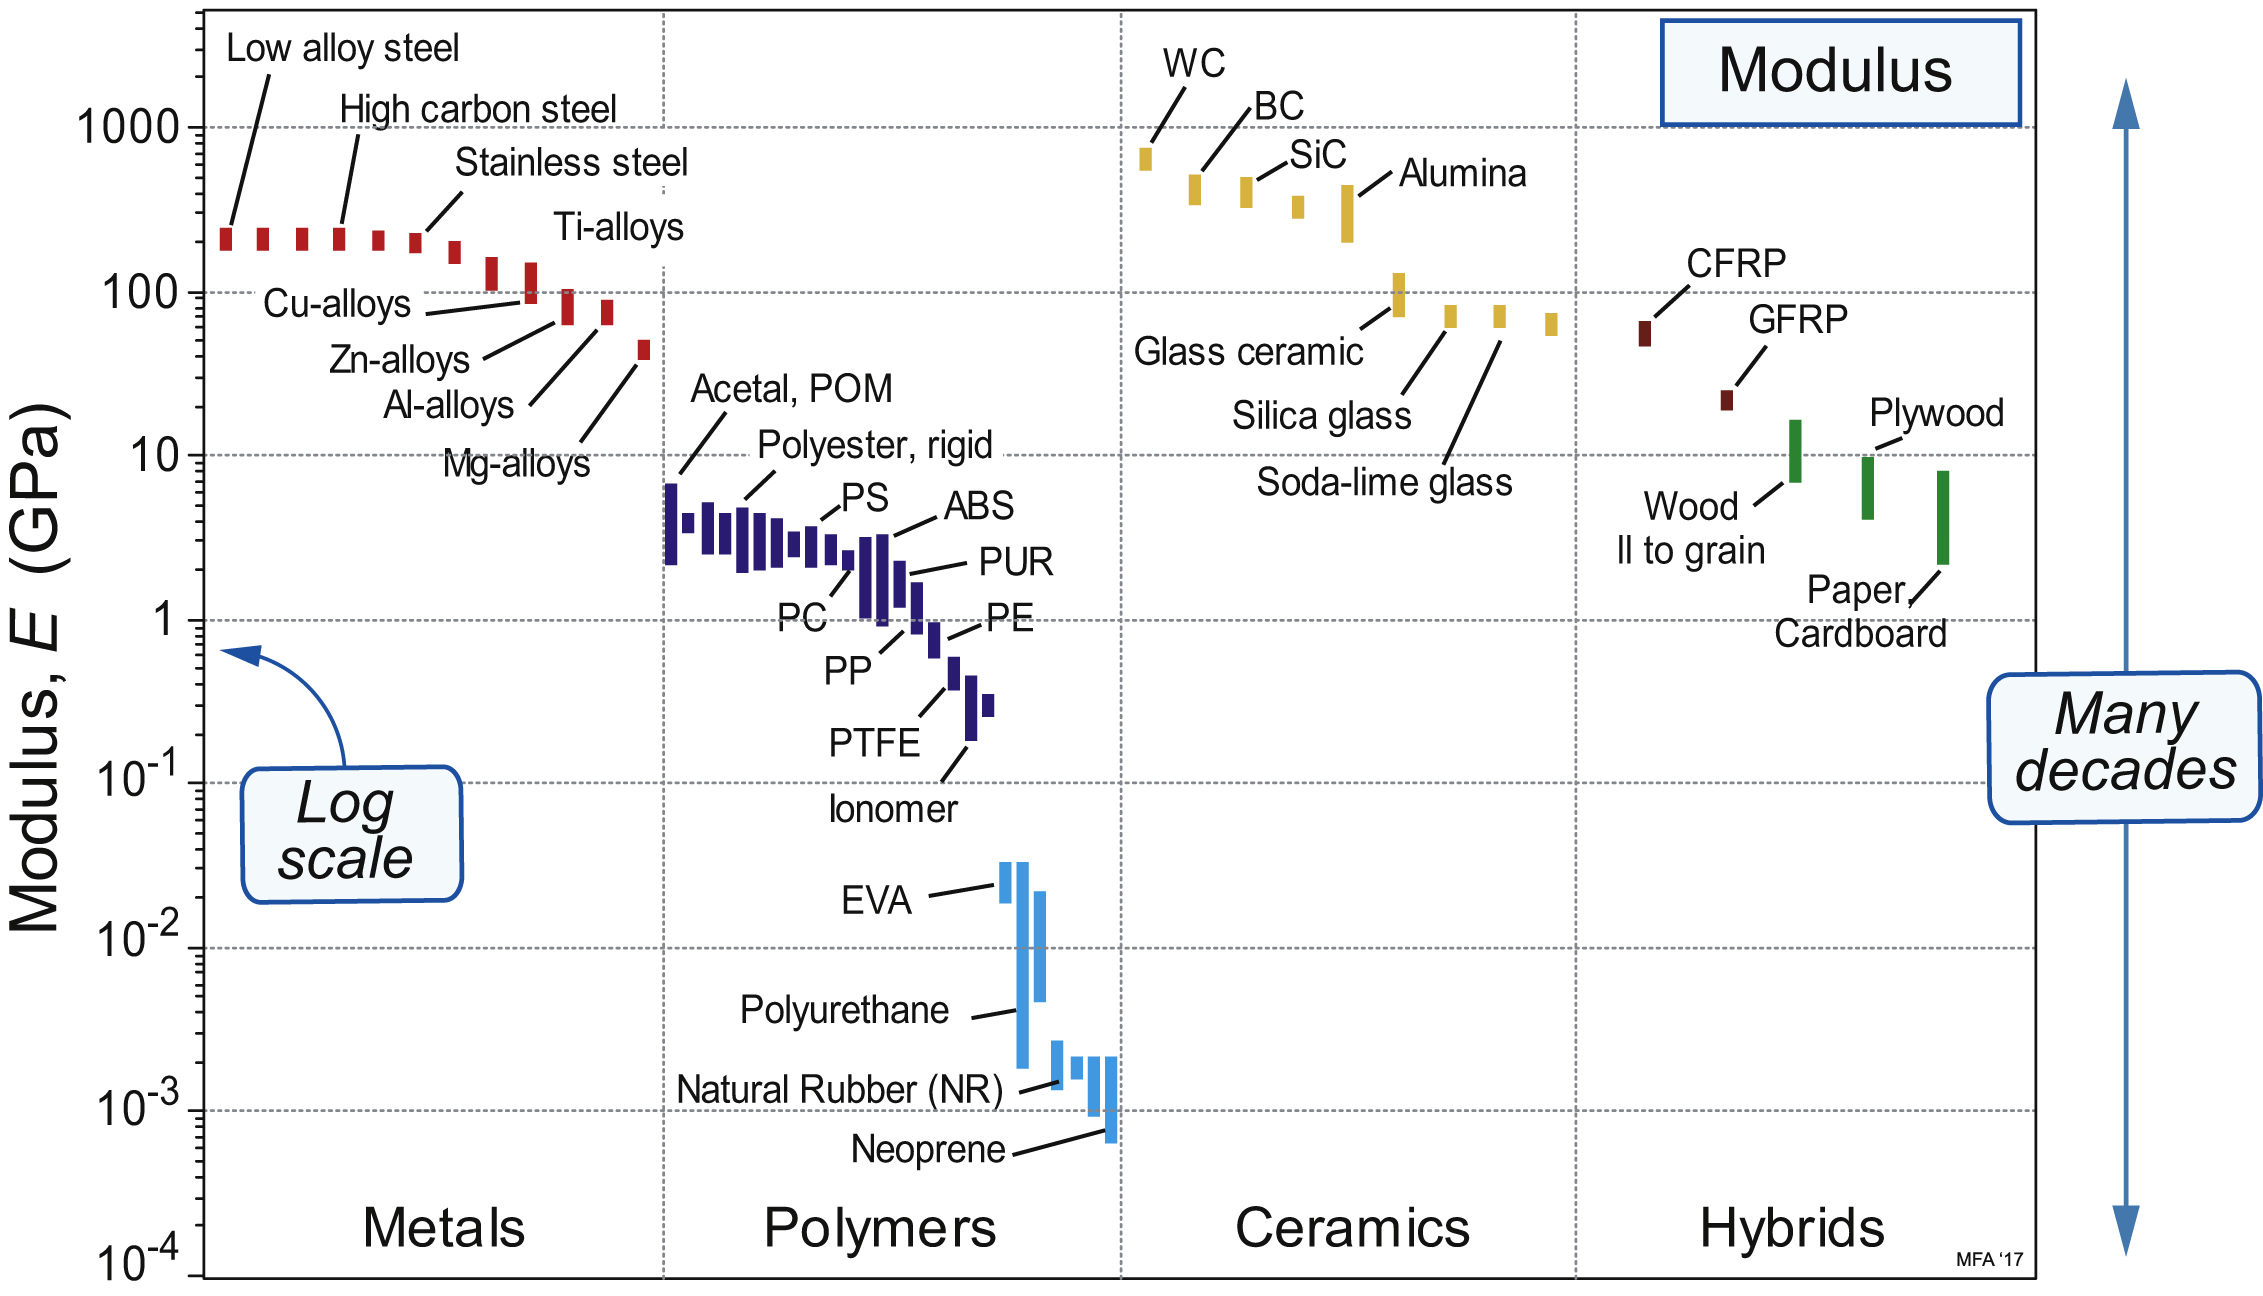
A bar chart is simply a plot of one property for all the materials of the Universe, or a subset of them. Figure 2.7 shows an example: it is a bar chart for modulus E. The largest is more than 10 million times greater than the smallest – many other properties have similarly large ranges – so it makes sense to plot them on logarithmic1, not linear scales, as here. The length of each bar shows the range of the property for each material, here segregated by family. The differences between the families now become apparent. Metals and ceramics have high moduli. Those of polymers are smaller, by a factor of about 50, than those of metals, while those of elastomers are some 500 times smaller still.
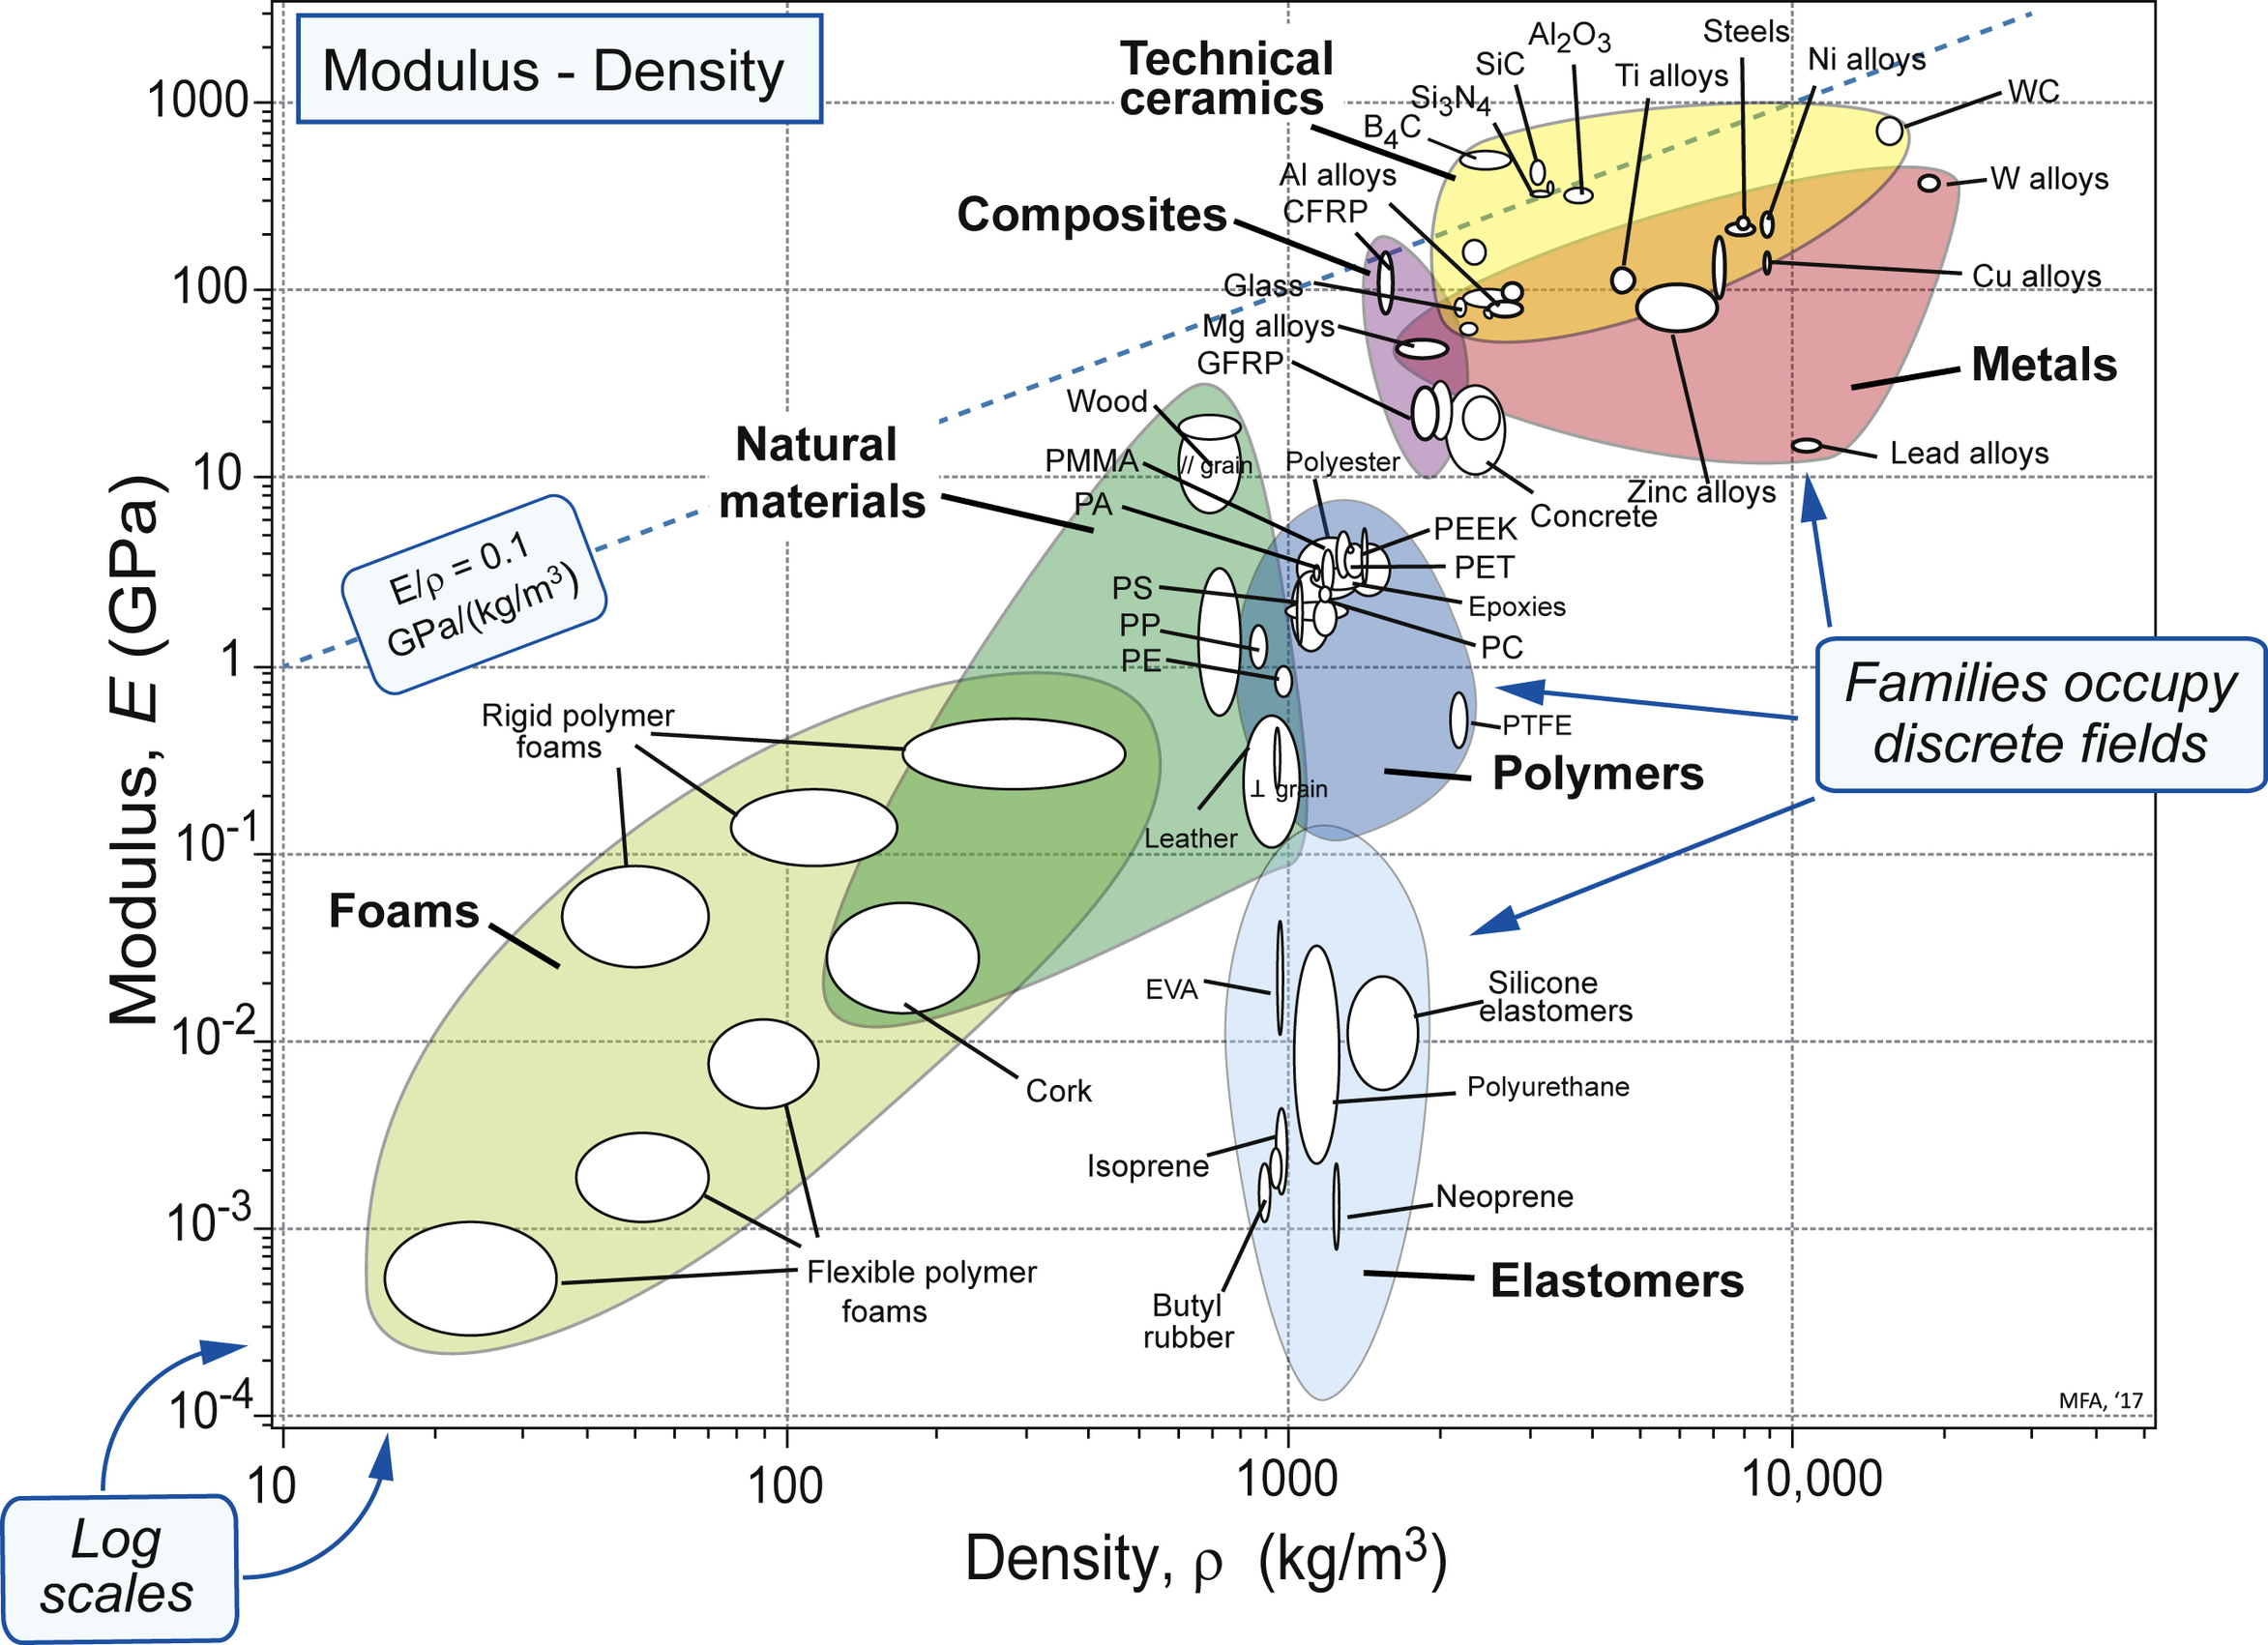
More information is packed into the picture if two properties are plotted to give a bubble chart, as in Figure 2.8, here showing modulus E and density ρ. As before, the scales are logarithmic. Now the families are more distinctly separated: all metals lie in the reddish zone near the top right; all polymers lie in the dark-blue envelope in the centre, elastomers in the lighter blue envelope below, ceramics in the yellow envelope at the top. Each family occupies a distinct, characteristic field. Within these fields, individual materials appear as smaller ellipses.
Material property charts like these are a core tool used throughout this book:
- • They give an overview of the physical, mechanical and functional properties of materials, presenting the information about them in a compact way.
- • They reveal aspects of the physical origins of properties, a help in understanding the underlying science.
- • They become a tool for optimised selection of materials to meet given design requirements, and they help us understand the use of materials in existing products.
2.6. Computer-aided information sources for materials and processes
Computer-based products are now available to manage information about materials and processes, making it easier to find data and to manipulate it. They vary greatly in their breadth of coverage and the audience at which they are aimed. We end this chapter with a list of some of these (Table 2.1).
Table 2.1
| ASM International (http://www.asminternational.org/online-databases-journals) ASM offers an extensive library of micrographs, phase diagrams, crystallographic structures, and failure case studies. |
| CES EduPack (http://www.grantadesign.com/education/). A comprehensive suite of databases for materials and processes with editions for general engineering, aerospace, polymers engineering, materials science, environmental design and industrial design. It includes powerful search, selection and eco-auditing tools. (The property charts in this book were made with this software). |
| DoITPoMS (https://www.doitpoms.ac.uk/) A free teaching resource created by the Materials Science Department of Cambridge University. |
| F∗A∗C∗T (http://www.crct.polymtl.ca/fact/) Thermodynamic data for engineering alloys and compounds. |
| Matbase (www.matbase.com). A database of the technical properties of materials, originally from the Technical University of Denmark. |
| Matdata (www.matdata.com). A well-documented database of the properties of metals. |
| Materia (www.materia.nl). A database aimed at industrial design, with images of some 2000 products. |
| Material Connexion (www.materialconnexion.com). A materials library emphasising industrial design with records for some 7000 materials, each with an image, a description and a supplier. |
| MatWeb (www.matweb.com). A large database of the engineering properties of materials, drawn from suppliers' data sheets. |
2.7. Summary and conclusions
Classification is the first step in creating an information management system for materials and processes. In it the records for the members of each Universe are indexed, so to speak, by their position in the tree-like hierarchies of Figures 2.2, 2.5 and 2.6. Each record has a unique place, making retrieval easy.
There are six broad families of materials for mechanical design: metals, ceramics, glasses, polymers, elastomers, and hybrids that combine the properties of two or more of the others. Processes, similarly, can be grouped into families: those that create shape, those that join, and those that modify the surface to enhance its properties or to protect or decorate it. This structure forms the basis of computer-based materials selection systems, now widely available. Property charts are a unique and powerful way of presenting data for materials – two examples appeared in this chapter. They become one of the central features of the chapters that follow.
2.9. Exercises
| Exercise E2.1 | Material properties from experience. List the six main classes of engineering materials. Use your own experience to rank them approximately: (a) by stiffness (modulus, E). A sheet of a material that has a high modulus is hard to bend when in the form of sheet. A sheet of material with a low modulus is floppy. (b) by thermal conductivity (λ). Materials with high conductivity feel cold when you pick them up on a cold day. Materials with low conductivity may not feel warm, but they don't freeze your hands as quickly as those with high conductivity. |
|---|---|
| Exercise E2.2 | Classification (1). A good classification looks simple – think, for instance, of the periodic table of the elements. Creating it in the first place, however, is not so simple. This chapter introduced two hierarchical classifications that work, meaning that every member of the classification has a unique place in it, and any new member can be inserted into its proper position without disrupting the whole. This exercise and the three that follow ask you to create hierarchical classifications following the Universe – Family – Class – Member pattern. Make sure that each level of the hierarchy properly contains all those below it. There may be more than one way to do this, but one is usually better than the others. Test it by thinking how you would use it to find the information you want. Classify the different ways in which sheets of paper can be attached to each other, temporarily or permanently. The Universe is ‘Paper attachment’. Create the Family level by listing the distinctly different mechanisms for attachment. Then add the Class level – the distinct subsets of each family. |
| Table Continued | |

| Exercise E2.3 | Classification (2). In how many ways can wood be treated to change its surface appearance and feel? The Universe is ‘Wood surface treatment’. Develop the classification further using distinct finishing techniques at the Family level and subsets of these at the Class level based on your own observation of wood products. |
|---|---|
| Exercise E2.4 | Classification (3). You run a bike shop that stocks bikes of many types (children's bikes, street bikes, mountain bikes, racing bikes, folding bikes, etc.), prices and sizes. You need a classification system to allow customers to look up your bikes on the internet. The Universe is ‘Bicycles’. Develop the Family and Class levels of the classification and note the further levels of hierarchy that would be needed to uniquely classify a given bike. |
| Exercise E2.5 | Classification (4). You are asked to organise the inventory of fasteners in your company. Fasteners come in various sizes and materials, and there is more than one type. What would be a logical hierarchical classification for the Universe of Fasteners? |
| Exercise E2.6 | Shaping. What is meant by a shaping process? The four products below were shaped using the following processes: A: Additive manufacturing B: Casting C: Forging and milling D: Turning  |
| Exercise E2.7 | Joining. The four products below illustrate the four joining methods: A: Adhesives B: Arc welding C: Brazing D: Threaded fasteners  |
| Exercise E2.8 | Surface treatment. The four products below illustrate the four surface treatment methods: A: Anodising B: Chrome plating C: Enamelling D: Powder coating  |
| Exercise E2.9 | Use of property charts (1). Examine the Modulus chart of Figure 2.7. By what factor, on average, are polymers less stiff than metals? By what factor is neoprene less stiff than polypropylene (PP)? |
| Exercise E2.10 | Use of property charts (2). Wood is a natural polymer, largely made up of cellulose and lignin, and they, like engineering polymers, are almost entirely hydrogen, carbon, oxygen and a little nitrogen. Has nature devised a cocktail of these elements that has a higher modulus than any bulk synthetic polymer? Engineering polymers and woods appear on the charts of Figures 2.7 and 2.8. Use either one to answer the question. |
| Exercise E2.11 | Use of property charts (3). Windows can be made of glass (house windows), polycarbonate (PC) (conservatory roofs) or poly-methyl-methacrylate, PMMA (aircraft cockpit canopies). Would a glass window be more flexible than a replacement of the same thickness made of polycarbonate? Would it be heavier? Use the bubble chart of Figure 2.8 to find out. |
| Table Continued | |

| Exercise E2.12 | Use of property charts (4). Do zinc alloys have a higher specific stiffness E/ρ than polypropylene (PP)? Use the bubble chart of Figure 2.8 to find out (E is the modulus; ρ is the density). Contours of E/ρ are diagonal contours on the axes of this figure – one is shown at E/ρ = 0.1 GPa/(kg/m3). Draw a line parallel to this one, passing through zinc alloys. If PP lies above this line, it has higher E/ρ; if below, it has a lower value. |
|---|
