Chapter 10
Fracture- and fatigue-limited design
Abstract
Elastic deformation is recoverable. Plastic deformation is gradual and detectable before really bad things happen. Failure by fast fracture is none of these and has caused many great engineering disasters: collapsed bridges, burst boilers, rail accidents, aircraft crashes. The understanding of fast fracture and the development of robust design methods to deal with it are relatively new – before 1950 little was known. This chapter describes the ways in which the stress intensity factor K1 is calculated, and the various scenarios in which the fracture toughness K1c is relevant, ending with examples of their application (including failure by fatigue). Fracture is not always bad: enabling controlled fracture allows you to get at the contents of shrink-wrapped packages and to access food and drugs in tamper-proof containers, for example. The trick is to design stress concentrations along the desired fracture path and choose a material with adequate strength but modest ductility.
Keywords
Ductility; Endurance limit; Engineering disasters; Fatigue; Fracture; Fracture toughness; Fracture-limited design; Fracture-safe design
10.1. Introduction and synopsis
It is very hard to build a structure that is completely without cracks. As explained in Chapter 8, cracks caused by shrinkage in casting and welding, by the cracking of inclusions during rolling or just caused by careless machining, are commonplace. And even if there are no cracks to start with, cyclic loading (Chapter 9) and corrosion (Chapter 14) can introduce them later.
This creates the need for design methods to deal with cracked structures. The idea of the tensile stress intensity factor K1 caused by a crack was introduced in Chapter 8. It depends on crack length, component geometry, and the way the component is loaded. We start with standard solutions for the stress intensity K1 associated with generic configurations – there are others, but this is enough to get started. Cracks will not propagate if K1 is kept below the fracture toughness K1c of the material.
This might suggest that the best material to resist fracture is the one with the highest K1c, and in load-limited design it is. But sometimes the requirement is not to carry a given load without failure, but to store a given energy (springs) or allow a given deflection (elastic couplings) without failure. Then the best choice of material involves combinations of K1c and Young's modulus E, as we will see in Section 10.3.
Cyclic loading, too, causes fracture. Chapter 9 explained how accumulating fatigue damage causes cracks to form and grow, a little on each cycle, until the length is such that the stress intensity exceeds K1c, when fast fracture follows. Stress intensities in cyclic loading are given by the same standard solutions as for static loading. Pre-existing cracks will not propagate if the cyclic stress intensity range, ΔK, is below the threshold range ΔKth, and they will not form in uncracked structures if the stress amplitude is below the endurance limit, σe.
The chapter concludes with case studies illustrating how these ideas enable no-fail or fail-safe design.
10.2. Standard solutions to fracture problems
As we saw in Chapter 8, sharp cracks concentrate stress in an elastic body. To summarise, the local stress falls off as 1/r1/2 with radial distance r from the crack tip. A tensile stress σ, applied normal to the plane of a crack of length 2c contained in an infinite plate, gives rise to a local stress field σ1 that is tensile in the plane containing the crack and given by
 (10.1)
where r is measured from the crack tip and Y is a constant. The mode 1 stress intensity factor, K1, is defined as
 (10.2)
The crack propagates when
 (10.3)
where K1c is the fracture toughness, a material property.
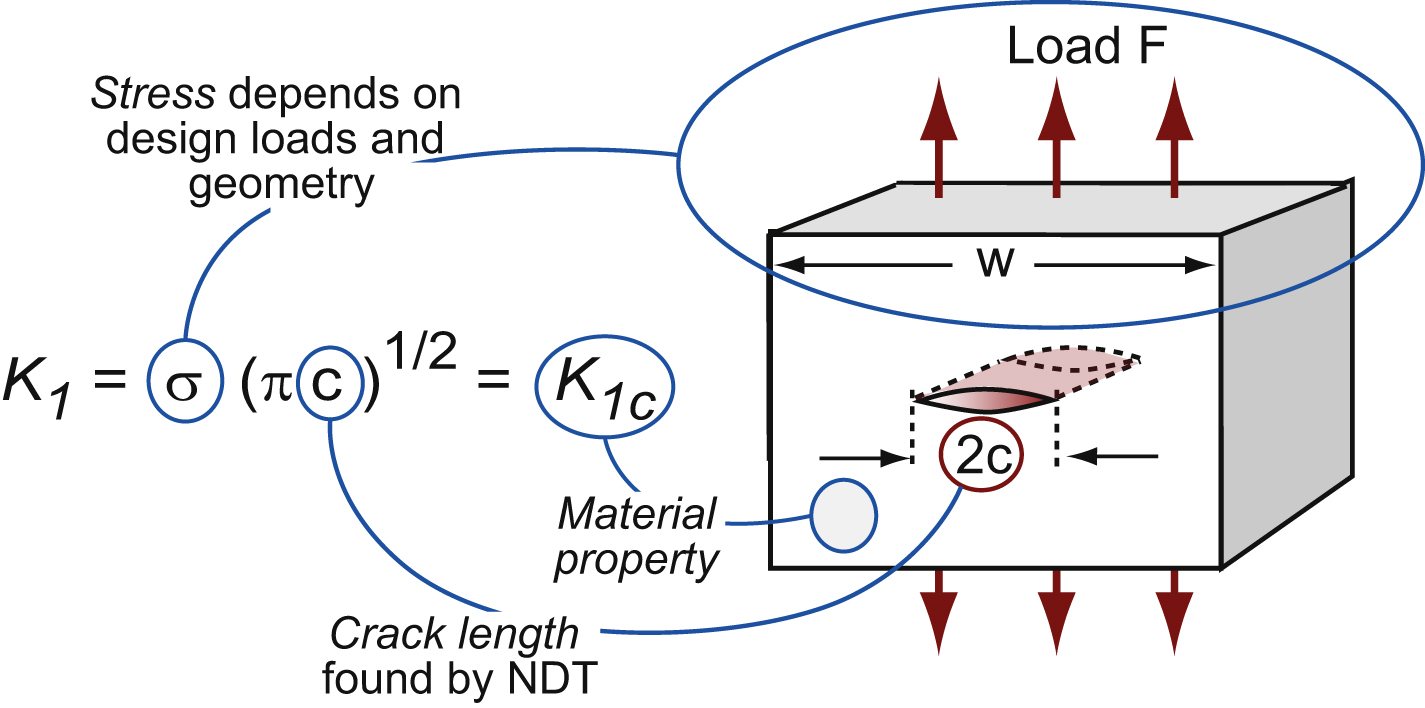
Equation (10.3), illustrated in Figure 10.1, summarises the key factors. In the design of a component to avoid fracture, we can manipulate the geometry and loads, we can monitor it using non-destructive testing (NDT) to be sure it contains no crack larger than an acceptable value, and we can choose materials with adequate fracture toughness.
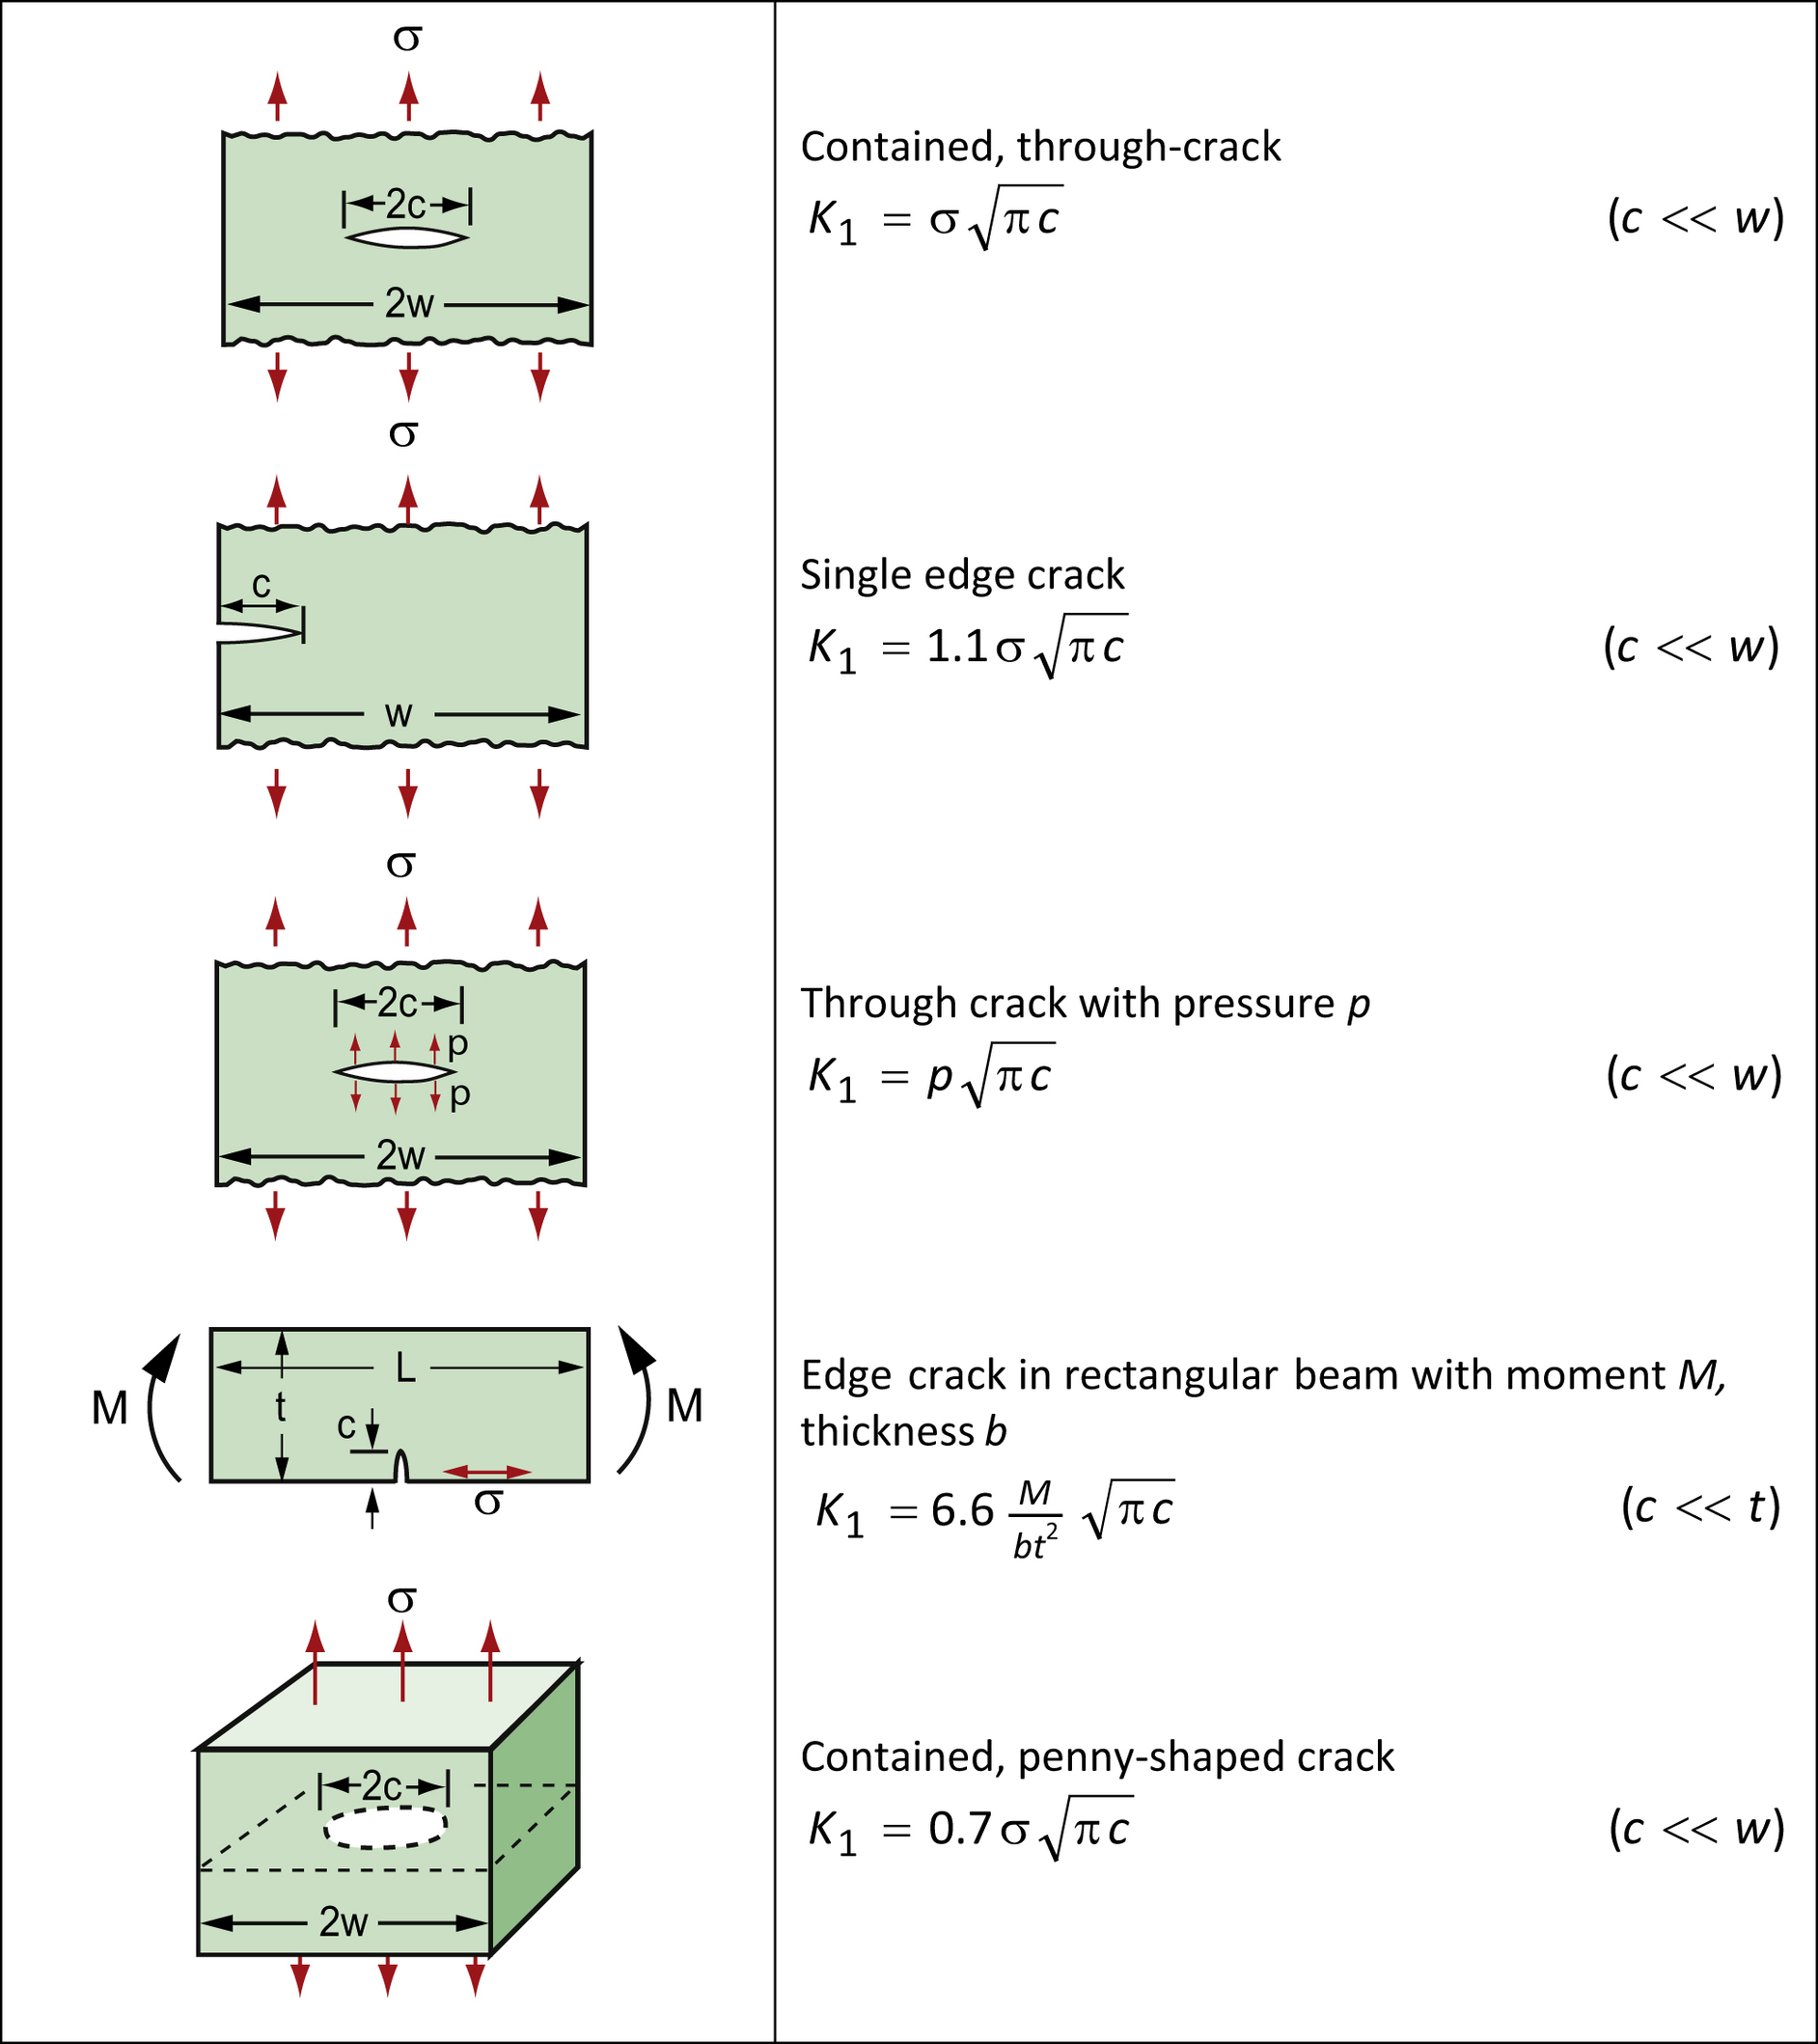
Expressions for K1 for various geometries and modes of loading are given in Figure 10.2. When the stress is uniform and the crack length is small compared with all specimen dimensions, Y is equal to or close to 1. As the crack extends in a uniformly loaded component, it interacts with the free surfaces, requiring correction factors. If, in addition, the stress field is non-uniform (as it is in an elastically bent beam), Y differs from 1. More accurate approximations and other less common loading geometries can be found in the references listed in Further Reading.
Example 10.1
The fourth case in Figure 10.2 shows the stress intensity for an edge-cracked beam carrying a bending moment M. Show that this is consistent with the second case in the figure, and hence explain a key assumption about the stress state in the fourth case.
Answer
For the beam in bending (case 4), the maximum stress σmax at the surface is given by equation (5.3):


Substituting σ = σmax into the second case in Figure 10.2 shows that the two solutions are the same. The key assumption is that the linear drop in bending stress below the surface can be neglected, so that the maximum bending stress can be approximated as a uniform tensile stress. This is reasonable, as the solution is only valid if the crack length c is short compared to the beam thickness t.
Example 10.2
In Example 5.5, a polystyrene (PS) ruler of width b = 25 mm and thickness t = 4.6 mm was loaded as a 250 mm long cantilever with an end load of 10 N. If the PS ruler has a 0.25 mm deep transverse scratch across its top surface near to the support of the cantilever, can it actually carry the load of 10 N without failing by fast fracture? Use K1c = 0.7 MPa.m1/2 for PS.
Answer
Use the fourth solution in Figure 10.2 for an edge crack in a beam in bending (noting that the crack length c = 0.25 mm is small compared to the thickness t = 4.6 mm). For a cantilever, the bending moment near the support is M = FL. Substituting for M in case 4, we find that for fast fracture when K1 = K1c, the end load would be
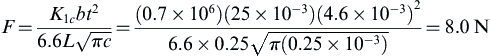
So with a 0.25 mm deep scratch, the ruler will snap below the target end load of 10 N.
10.3. Material indices for fracture-safe design
Among mechanical engineers there is a rule of thumb already mentioned: avoid materials with a fracture toughness K1c less than 15 MPa.m1/2. The K1c–E chart of Figure 8.8 shows that almost all metals pass: most have values of K1c in the range 20–100 in these units. Just a few fail: white cast iron and some powder metallurgy products have values as low as 10 MPa.m1/2. Ordinary engineering ceramics have values in the range 1–6 MPa.m1/2; mechanical engineers view them with deep suspicion. But engineering polymers have even smaller values of K1c in the range 0.5–3 MPa.m1/2 and yet engineers use them all the time. What is going on here?
In a load-limited design – the structural member of a bridge or the wing spar of an aircraft, for instance (Figure 10.3(a) and (b)) – the part will fail in a brittle way if the stress exceeds that given by equation (10.3). To maximise the load we want materials with highest values of
 (10.4)
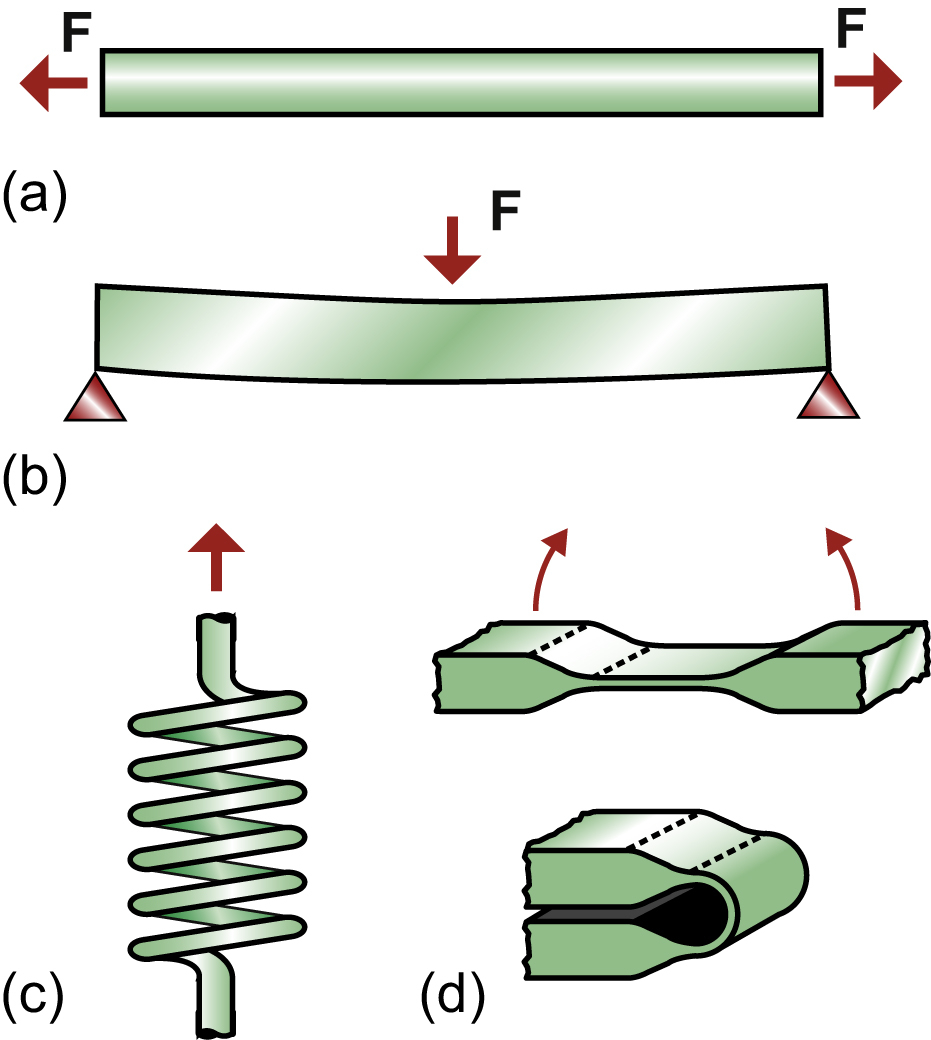
But not all designs are load-limited; some are energy-limited, others are deflection-limited, as sketched in Figure 10.3, and then the criterion for selection changes.
Energy-limited design
Springs, and containment systems for turbines and flywheels (to catch the bits if they disintegrate), are energy-limited. Take the spring (Figure 10.3(c)) as an example. The elastic energy stored per unit volume, Ue, in uniaxial tension is
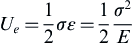
In bending or torsion, this equation still applies, with σ replaced by the maximum stress, and a numerical correction. In Chapter 7 we considered the limit of yielding on elastic energy storage, but if cracks are present, the maximum stress may be limited by fracture, via equation (10.3). In that case, the maximum energy per unit volume that the spring can store scales as
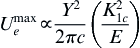
So, for a given initial flaw size c, the elastic stored energy is maximised by choosing materials with large values of
 (10.5)
Deflection-limited design
There is a third scenario: that of deflection-limited design (Figure 10.3(d)), as in snap-on bottle tops, elastic hinges, and couplings. These must allow sufficient elastic displacement to permit the snap action or flexure without failure, requiring a large failure strain εf. The strain is related to the stress by Hooke's law, ε = σ/E, and the stress is limited by the fracture equation (10.3). Thus the failure strain is
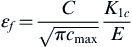
The best materials for deflection-limited design are those with large values of
 (10.6)
Plotting indices on charts
Figure 10.4 shows the K1c–E chart again. It allows materials to be compared by values of fracture toughness, M1, by toughness, M2, and by values of the deflection-limited index, M3. As noted earlier, almost all metals have values of K1c above 15 MPa.m1/2, shown as a horizontal selection line for load-limited design. Composites are just about there; polymers and ceramics are not.
The line showing M2 in Figure 10.4 is placed at the value 1 kJ/m2. Materials with values of M2 greater than this have a degree of shock resistance with which engineers feel comfortable (another rule of thumb). Metals, composites, and many polymers qualify; ceramics do not. When we come to deflection-limited design, the picture changes again. The second sloping line shows the index M3 = K1c/E at the value 10−3 m1/2. It illustrates why polymers find such wide application: when the design is deflection-limited, polymers – particularly nylons (PA), polycarbonate (PC), and ABS – are better than the best metals.
The figure gives further insights. Mechanical engineers' love of metals (and, more recently, of composites) is inspired not merely by the appeal of their K1c values. Metals are good by all three criteria (K1c, K 1 c 2 / E and K 1 c 2 / E  ). Polymers have good values of K1c/E and are acceptable by
 K 1 c 2 / E  . Ceramics are poor by all three criteria. Herein lie the deeper roots of the engineers' distrust of ceramics.
). Polymers have good values of K1c/E and are acceptable by . Ceramics are poor by all three criteria. Herein lie the deeper roots of the engineers' distrust of ceramics.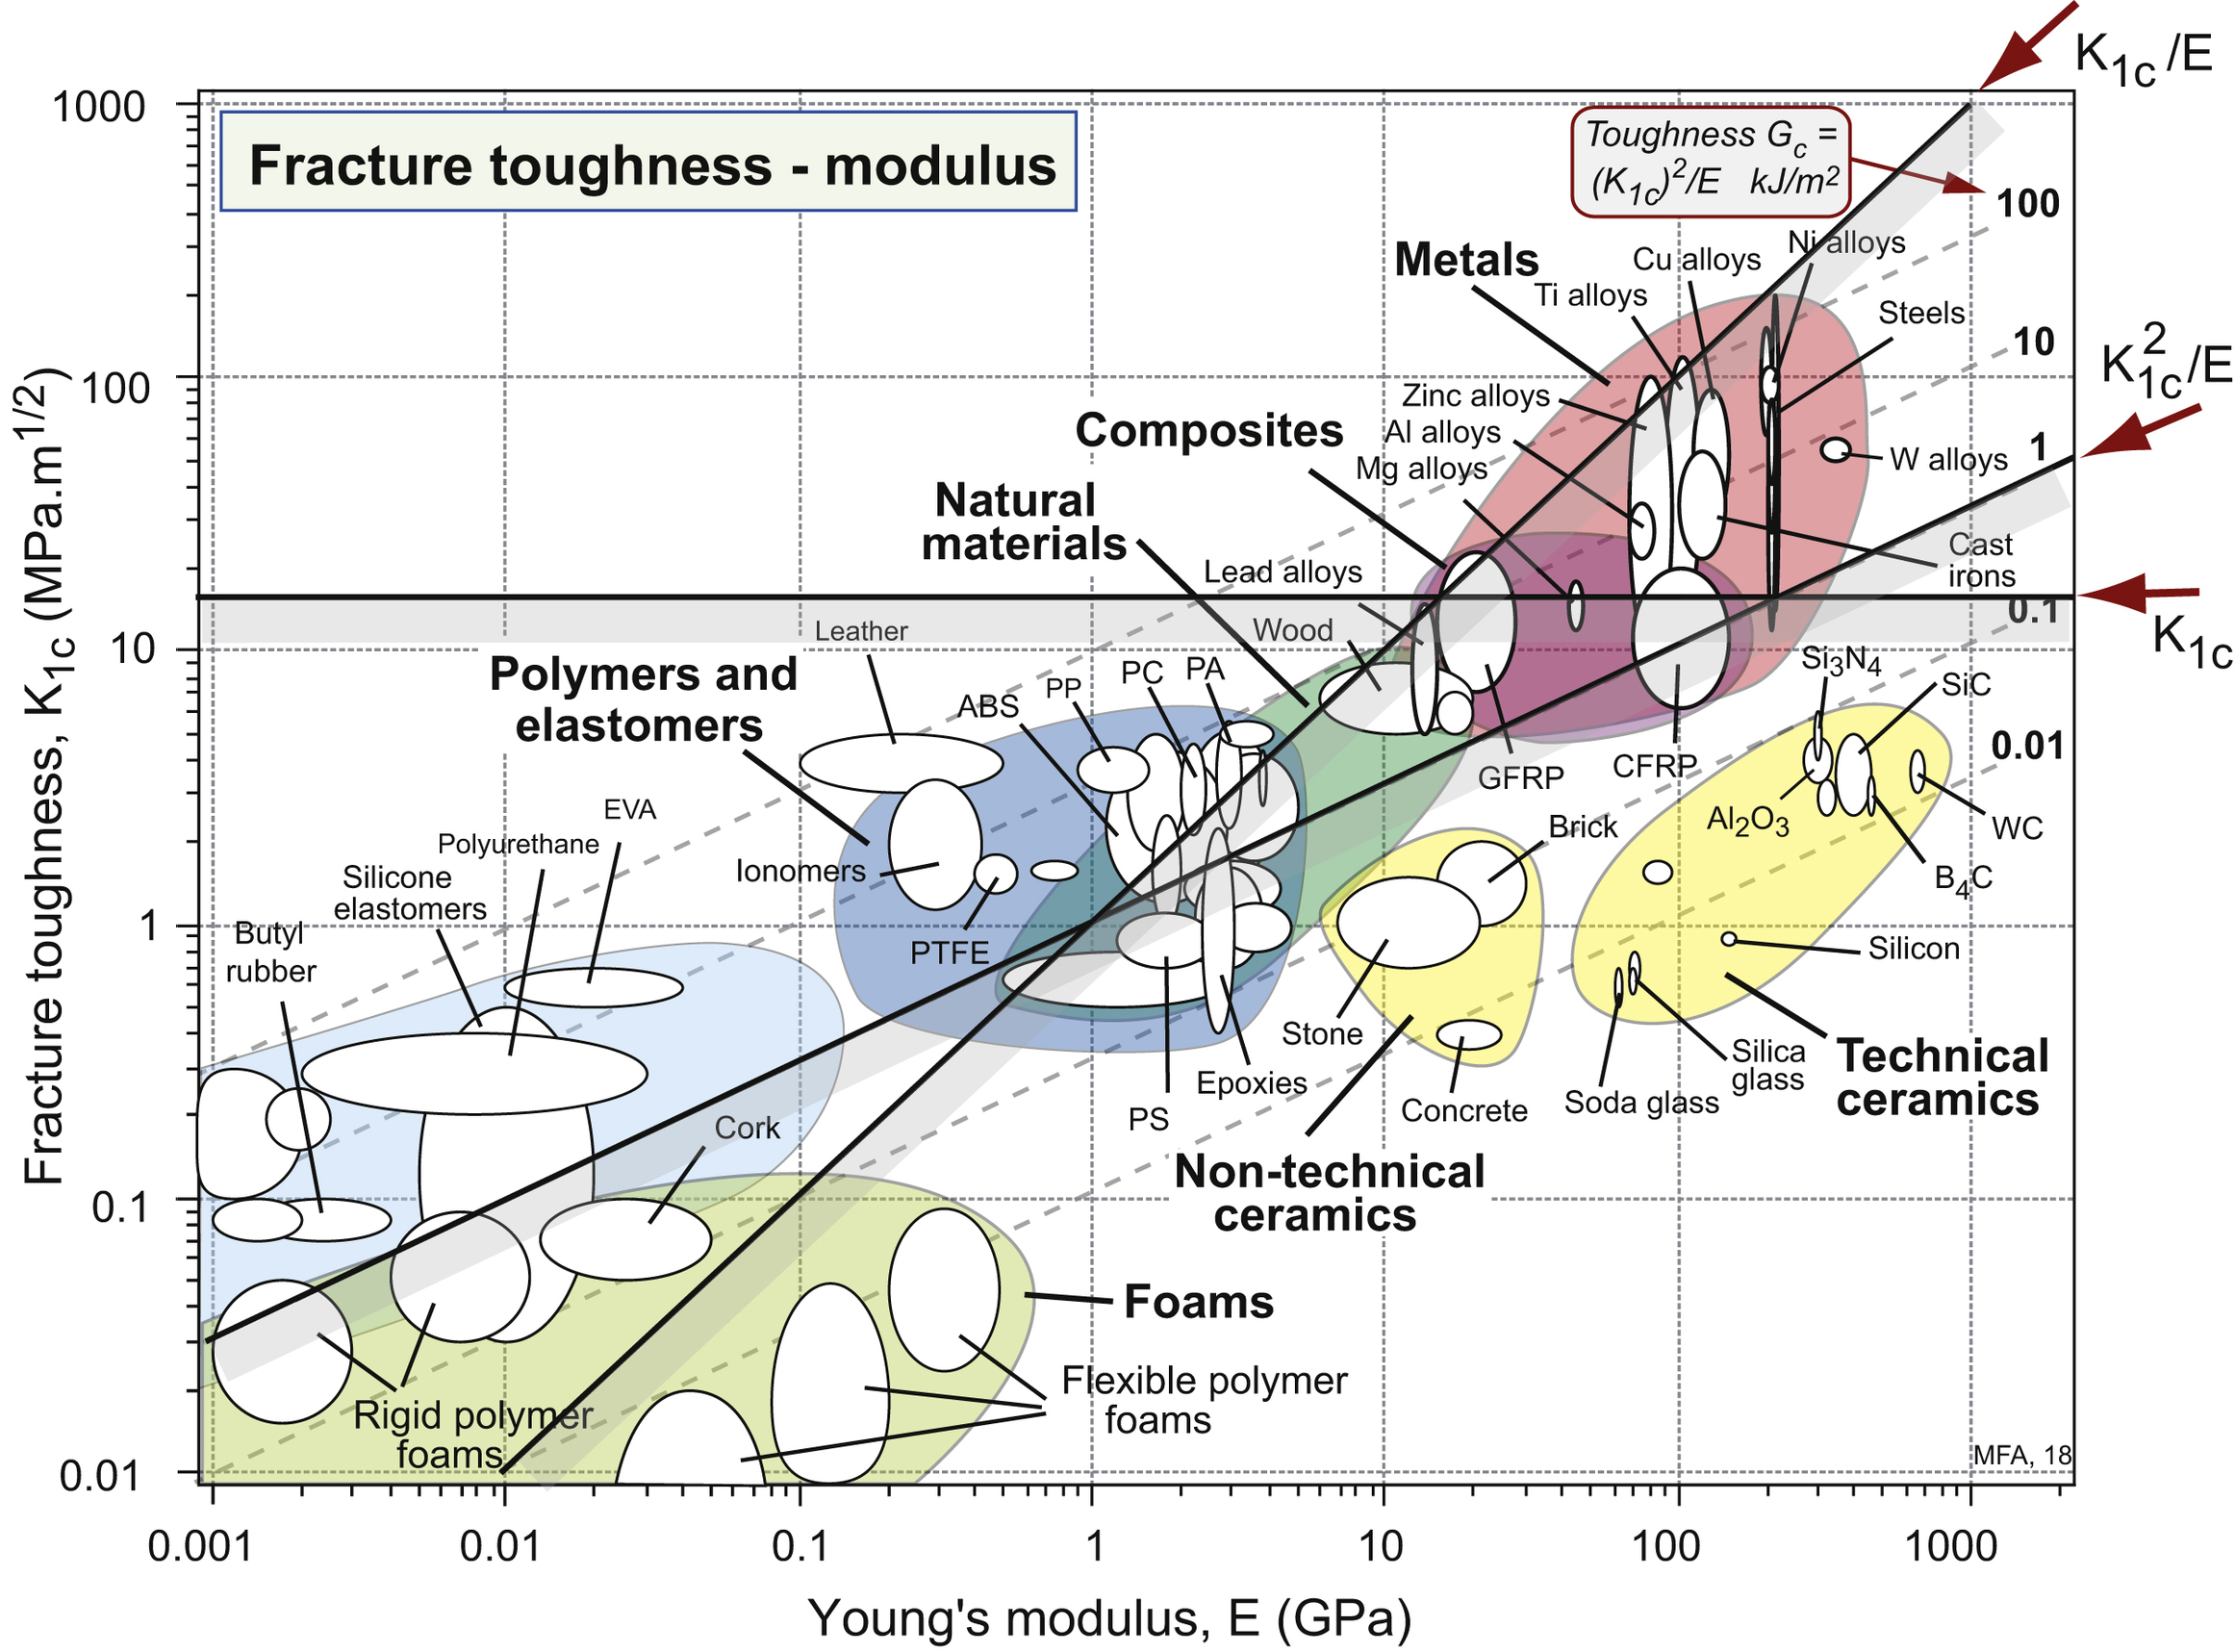


10.4. Case studies
Forensic fracture mechanics: pressure vessels
An aerosol or fizzy beverage can is a pressure vessel. So, too, is a propane gas cylinder, the body of an airliner, the boiler of a power station, and the containment of a nuclear reactor. Their function is to contain a gas under pressure – CO2, propane, air, steam. Failure can be catastrophic. Think of the bang that a party balloon can make, then multiply it by 1014 – yes, really – and you begin to get an idea of what happens when a large pressure vessel explodes. When working with pressure, safety is an issue, as the following example illustrates.
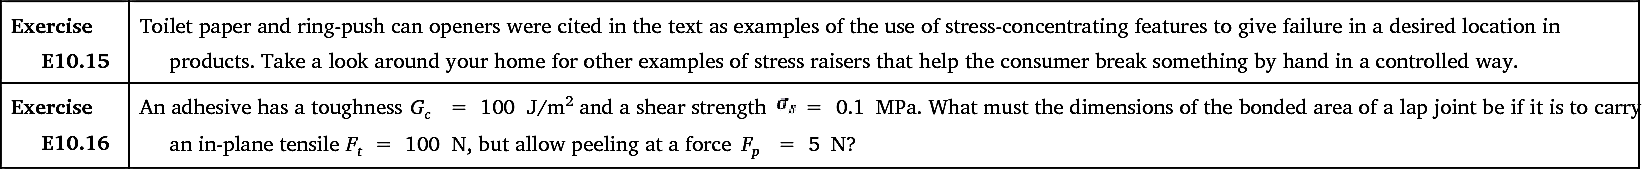
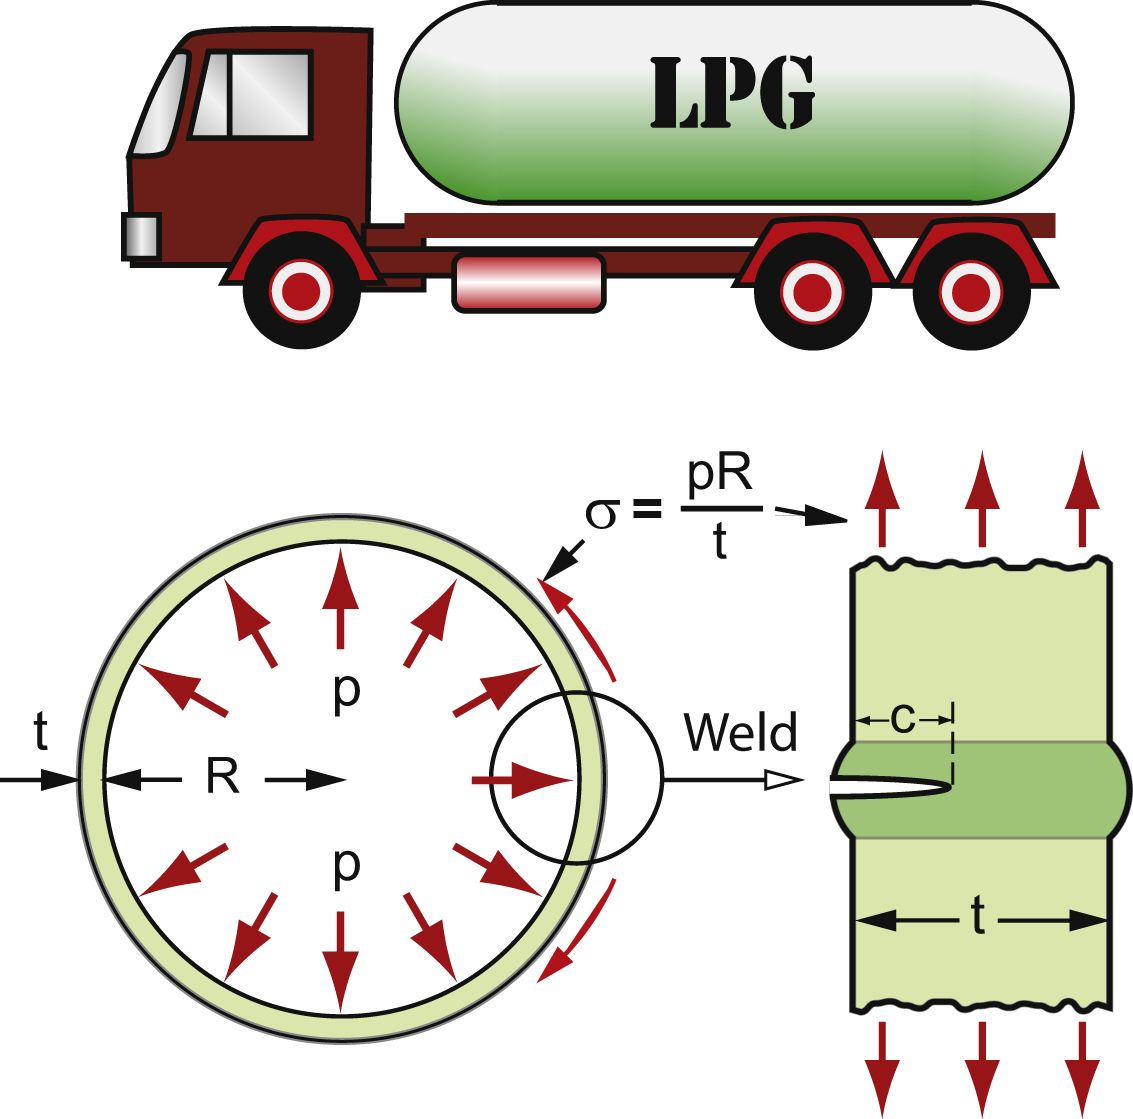
A truck-mounted propane tank (Figure 10.5) was filled, then driven to the driver's home where he parked it in the sun and went inside to have lunch, leaving the engine running. As he was drinking his coffee the tank exploded causing considerable property damage and one death. The tank was made of rolled AISI 1030 steel plate formed into a cylinder, with a longitudinal seam weld and two domes joined to the rolled plate by circumferential welds. The failure occurred through the longitudinal weld, causing the tank to burst (see chapter opening picture). Subsequent examination showed that the weld had contained a surface crack of depth 10 mm that had been there for a long time, as indicated by discoloration and by ‘striations’ showing that it was growing slowly by fatigue each time the tank was emptied and refilled. At first sight it appeared that the crack was the direct cause of the failure.
That's where fracture mechanics comes in. Measurements on a section of the tank wall gave a fracture toughness of 45 MPa.m1/2. The specification for the tank is listed in Table 10.1. It was designed for a working pressure of 1.4 MPa, limited for safety at 1.5 MPa by a pressure release valve.
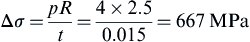
The tensile stress in the wall of a thin-walled cylindrical pressure vessel of radius R and wall thickness t containing a pressure p (Figure 10.5) was given in Chapter 4. With the values listed in the table the working stress in the tank should have been
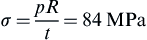 (10.7)
A plate with a fracture toughness 45 MPa.m1/2 containing a surface crack of depth 10 mm will fail at a stress (assuming Y ≈ 1) of
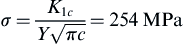
This is three times higher than the expected stress in the tank wall. The pressure needed to generate this stress is 4.2 MPa – far higher than the limit set by the safety valve of 1.5 MPa.
At first it appears that the calculations cannot be correct since the tank had a relief valve set just above the working pressure, so the discrepancy prompted the investigators to look further. An inspection of the relief valve showed rust and corrosion, rendering it inoperative. Further tests confirmed that heat from the sun and from the exhaust system of the truck raised the temperature of the tank, vaporising the liquefied gas, and driving the pressure up to the value of 4.2 MPa needed to make the crack propagate. The direct cause of the failure was the jammed pressure release valve. The crack would not have propagated at the normal operating pressure.
This story indicates that we need a way to design such that there is warning before cracks propagate unstably. In other words, we need fail-safe design.
Fail-safe design
If structures are made by welding or riveting, it is wise to assume that cracks are present – either because the process can lead to various forms of cracking, or because stress concentrations and residual stresses around the joints accelerate the formation of fatigue cracks. A number of techniques exist for detecting cracks and measuring their length, without damaging the component or structure; this is called NDT. X-ray imaging is one – alloy wheels for cars are checked in this way. Ultrasonic testing is another: sound waves are reflected by a crack and can be analysed to determine its size. Surface cracks can be revealed with fluorescent dyes. When none of these methods can be used, then proof testing – filling the pressure vessel with water and pressurising it to a level above the planned working pressure – demonstrates that there are no cracks large enough to propagate during service. All these techniques have a resolution limit, or a crack size clim, below which detection is not possible. They do not demonstrate that the component or structure is crack-free, only that there are no cracks larger than the resolution limit. Proof testing is the safest, though it is expensive, since it does guarantee a maximum crack size that could be present. The other techniques carry a risk of operator error, with cracks being overlooked.
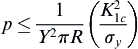
The first condition, obviously, is to design in such a way that the stresses are everywhere less than that required to make a crack of length clim propagate. Applying this condition gives the allowable pressure
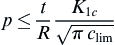 (10.8)
The largest pressure (for a given R, t, and clim) is carried by the material with the greatest value of
(10.9)– our load-limited index of Section 10.3.
But this design is not fail-safe. If the inspection is faulty, or if, by some mechanism such as fatigue, a crack of length greater than clim appears, catastrophe follows. Greater security is obtained by requiring that the crack will not propagate even if the stress is sufficient to cause general yield, for then the vessel will deform stably in a way that can be detected. This condition, called the yield-before-break criterion, is expressed by setting the fracture stress σ equal to the yield stress σy, giving
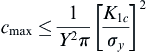 (10.10)
Using this criterion, the tolerable crack size, and thus the integrity of the vessel, is maximised by choosing a material with the largest value of
 (10.11)
Large pressure vessels cannot always be X-rayed or ultrasonically tested; and proof testing may be something we wish to conduct infrequently, due to the cost. But since cracks can grow slowly because of corrosion or cyclic loading, a single examination at the beginning of service life is not sufficient. Then safety can be ensured by arranging that a crack remains stable, even if it is long enough to penetrate all the way from the inner to the outer surface of the vessel. The vessel will leak, but this is not catastrophic and can be detected. This condition, called the leak-before-break criterion, is achieved by setting c = t in equation (10.3), assuming the crack starts as a crack in one face and grows through the thickness to the other face, giving
 (10.12)
Example 10.3
A cylindrical steel pressure vessel of 5 m diameter is to hold a pressure p of 4 MPa. The fracture toughness is 110 MPa.m1/2. What is the greatest wall thickness that can be used while ensuring that the vessel will fail by leaking rather than fracture, should a crack grow within the wall? Assume a semi-circular surface crack of length c, for which K 1 = σ π c  , assuming that the crack is orientated normal to the maximum stress σ in the wall.
, assuming that the crack is orientated normal to the maximum stress σ in the wall.Answer
For the vessel to leak, the crack length c has to reach the wall thickness t without fracture. Consequently, c = t and K 1 c = σ π t .  The greatest hoop stress in the vessel wall drives the crack, so
 σ = p R / t  Combining these gives an equation for the maximum wall thickness for which the crack will penetrate the wall without fast fracture, with R = 2.5 m:
The greatest hoop stress in the vessel wall drives the crack, so Combining these gives an equation for the maximum wall thickness for which the crack will penetrate the wall without fast fracture, with R = 2.5 m: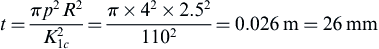
The wall thickness t of the pressure vessel must also contain the pressure p without yielding. From equation (10.7), the maximum pressure that can be carried is when the stress σ = σy giving

The pressure that can be carried increases with the wall thickness, but there is an upper limit on the thickness given by the leak-before-break criterion, equation (10.12). Substituting for thickness into the previous equation (again with σ = σy) gives
So the pressure is carried most safely by the material with the greatest value of
 (10.13)
Both M4 and M5 could be made large by using a material with a low yield strength, σy: lead, for instance, has high values of both M4 and M5, but you would not choose it for a pressure vessel. That is because the vessel wall must also be reasonably thin, for both acceptable mass and economy of material. From equation (10.7), thickness is inversely proportional to the yield strength, σy, so we also seek a reasonably high value of
 (10.14)
narrowing further the choice of material.
All of these criteria can be explored using the K1c − σy chart introduced in Chapter 8 (Figure 10.6). The indices M1, M4, M5, and M6 can be plotted onto it as lines of slope 0, 1, 1/2, and as lines that are vertical. Take ‘leak-before-break’ as an example. A diagonal line corresponding to a constant value of M 5 = K 1 c 2 / σ y  links materials with equal performance; those above the line are better. The line shown in the figure excludes everything but the toughest steels, copper, nickel, and titanium alloys. A second selection line for M6 at σy = 200 MPa narrows the selection further. A more detailed treatment to minimise mass would seek to maximise the specific strength, σy/ρ. Exercises at the end of this chapter develop further examples of the use of these indices.
links materials with equal performance; those above the line are better. The line shown in the figure excludes everything but the toughest steels, copper, nickel, and titanium alloys. A second selection line for M6 at σy = 200 MPa narrows the selection further. A more detailed treatment to minimise mass would seek to maximise the specific strength, σy/ρ. Exercises at the end of this chapter develop further examples of the use of these indices.
Boiler failures used to be commonplace – there are even songs about it. Now they are rare, though when safety margins are pared to a minimum (rockets) or maintenance is neglected (the propane tank) pressure vessels still occasionally fail. This relative success is one of the major contributions of fracture mechanics to engineering practice and public safety.
Materials to resist fatigue: con-rods for high-performance engines
The engine of a family car is designed to tolerate speeds up to about 6000 rpm – 100 revolutions per second. That of a Formula 1 racing car revs to about three times that. Comparing an F1 engine to that of a family car is like comparing a Rolex watch to an alarm clock, and their cost reflects this: about £150,000 per engine. Performance, here, is everything.
The connecting rods of a high-performance engine are critical components: if one fails the engine self-destructs. Yet to minimise inertial forces and bearing loads, each must weigh as little as possible. This implies the use of light, strong materials, stressed near their limits. When minimising cost not maximising performance is the objective, con-rods are made from cast iron. But here we want performance. What, then, are the best materials for such con-rods?
An F1 engine is not designed to last long – about 30 h – but 30 h at around 15,000 rpm means about 3 × 10⁶ cycles of loading and that means high-cycle fatigue. For simplicity, assume that the shaft has a uniform section of area A and length L (Figure 10.7) and that it carries a cyclic load ± F. Its mass is
 (10.15)
where ρ is the density. The fatigue constraint requires that

where σe is the endurance limit of the material of which the con-rod is made. Using this to eliminate A in equation (10.15) gives an equation for the mass:
containing the material index
 (10.16)
Materials with high values of this index are identified by creating a chart with σe and ρ as axes, applying an additional, standard constraint that the fracture toughness exceeds 15 MPa.m1/2 (Figure 10.8). Materials near the top-left corner are attractive candidates: high-strength magnesium, aluminium, and ultra-high-strength steels; best of all are titanium alloys and CFRP. This last material has been identified by others as attractive in this application. To go further we need S–N curves for the most promising candidates. Figure 10.9 shows such a curve for the most widely used titanium alloys, Ti–6Al–4V (‘Ti-6-4’). The safe stress amplitude at R = −1 for a design life of 2.5 × 10⁶ cycles can be read off: it is 620 MPa.
If the selection is repeated using the much larger CES databases, some other exotic materials emerge: aluminium reinforced with ceramic fibres (SiC, boron, or Al2O3), beryllium alloys, and a number of high-performance carbon-reinforced composites. A con-rod made of CFRP sounds a difficult thing to make, but at least three prototypes have been made and tested. They use a compression strut (a CFRP tube) with an outer wrapping of filament-wound fibres to attach the bearing housings (made of titanium or aluminium) to the ends of the strut.
Rail cracking
At 12.23 p.m. on 7 October 2000, the 12.10 express train from King's Cross (London) to Leeds (in the north of England) entered a curve just outside Hatfield at 115 mph – the maximum permitted for that stretch of line – and left the track. Four people died. More are killed on British roads every day, but the event brought much of the railway system, and through this, the country, to a near halt. It was clear almost immediately that poor maintenance and neglect had allowed cracks to develop in much of the country's track; it was an extreme case of this cracking that caused the crash.
Rail-head cracking is no surprise – rails are replaced regularly for that reason. The cracks develop because of the extreme contact stresses – up to 1 GPa – at the point where the wheels contact the rail (Figure 10.10(a)). This deforms the rail surface, and because the driving wheels also exert a shear traction in a direction opposite to that of the motion of the train, the surface layer is very heavily sheared. Cracks nucleate in this layer after about 60,000 load cycles, and because of the shearing they lie nearly parallel to the surface, as in Figure 10.10(b). The deformation puts the top of the rail into compression, balanced by tension in the main web. Welded rails are also pre-tensioned to compensate for thermal expansion on a hot day, so this internal stress adds to the pre-tension that was already there.
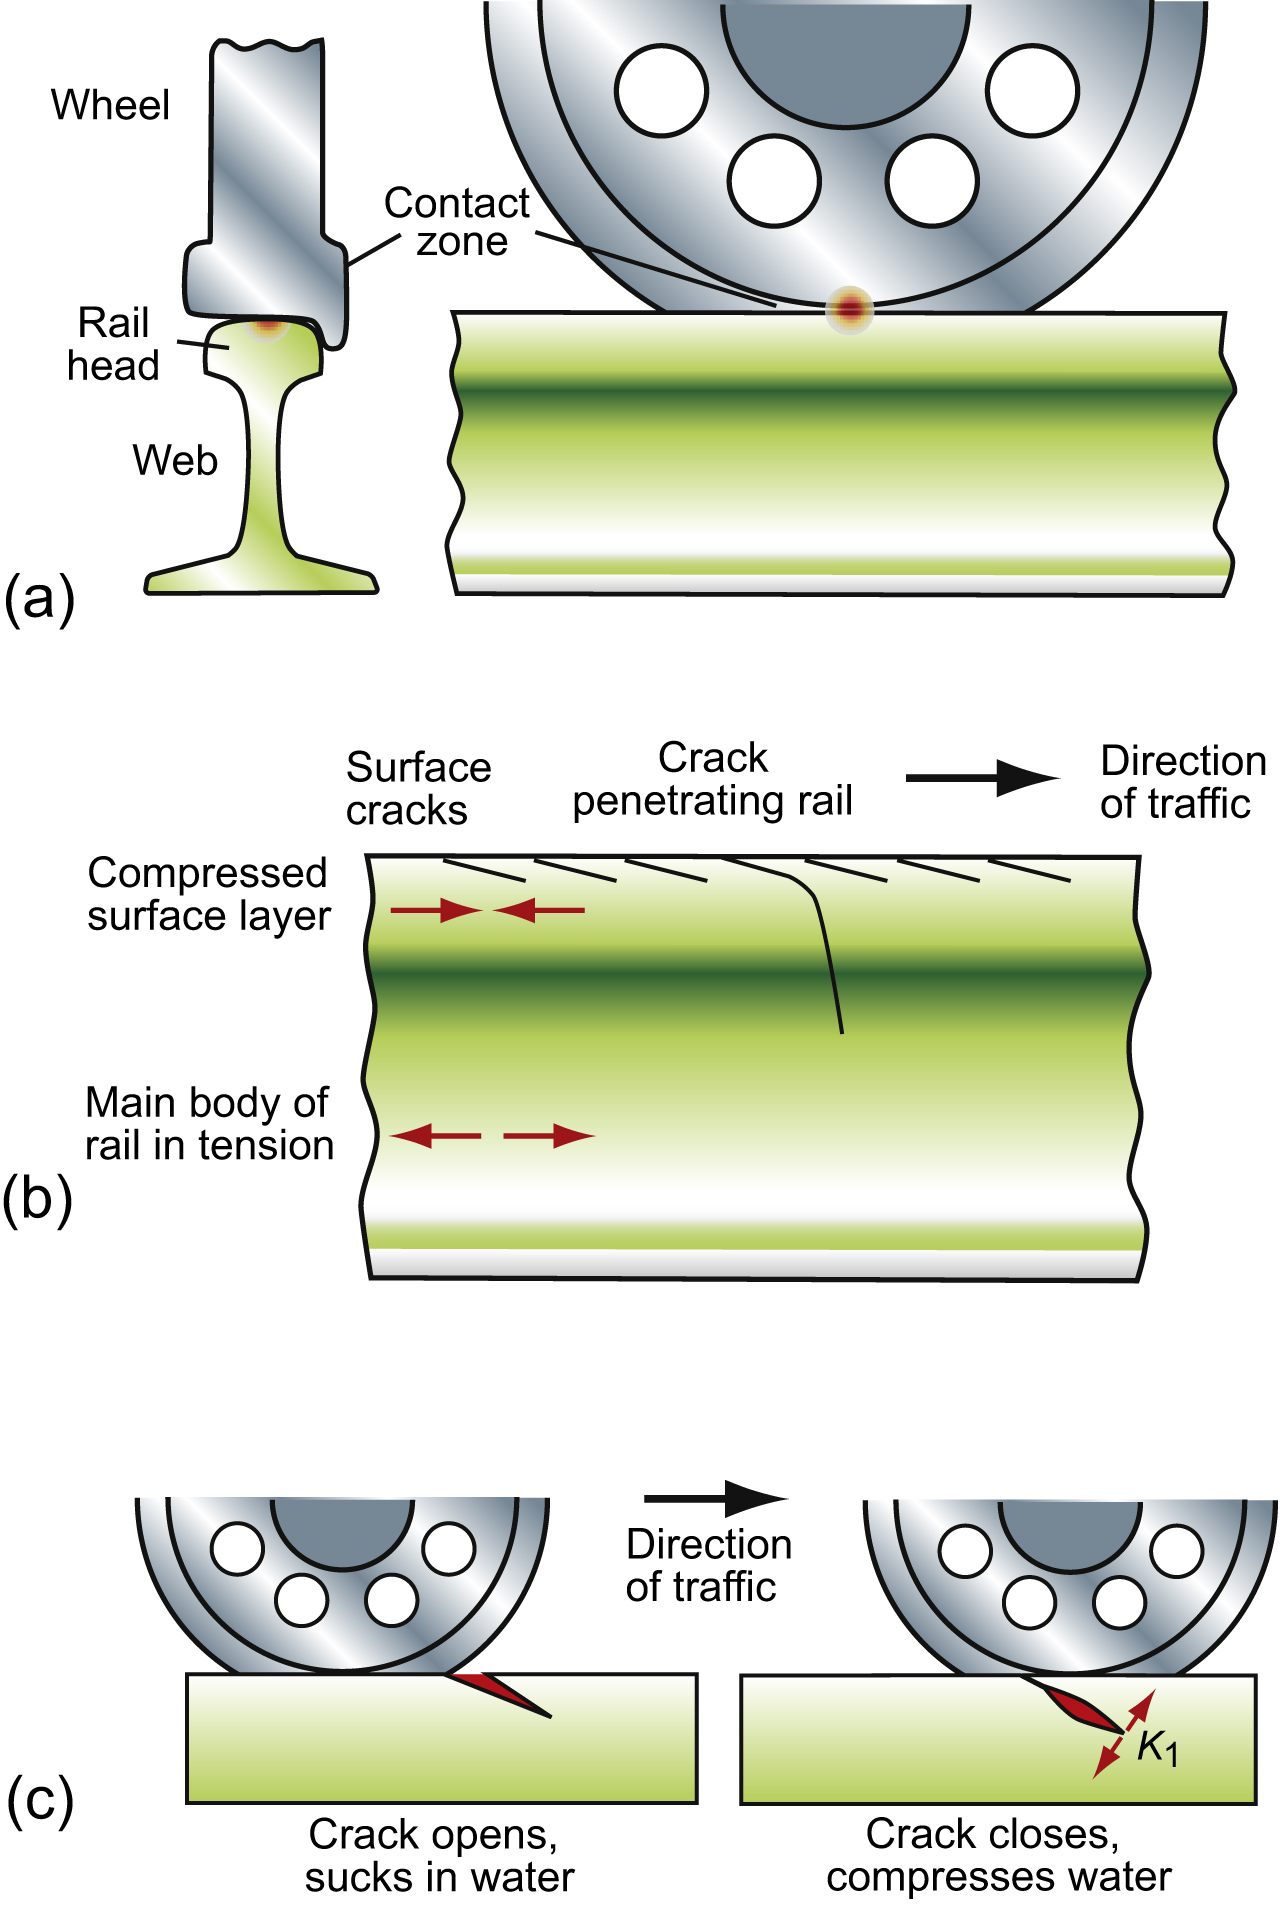
The mystery is how these harmless surface cracks continue to grow when the stress in the rail head is compressive. One strange observation gives a clue: it is that the cracks propagate much faster when the rails are wet than when they are dry – as they remain in tunnels, for instance. Research following the Hatfield crash finally revealed the mechanism, illustrated in Figure 10.10(c). As a wheel approaches, a surface crack is forced open. If the rail is wet, water (shown in red) is drawn in. As the wheel passes the mouth of the crack, it is forced shut, trapping the water, which is compressed to a high pressure. Figure 10.2 lists the stress intensity of a crack containing an internal pressure p:
 (10.17)
So although the rail head is compressed, at the tip of the crack there is tension – enough to drive the crack forward. The crack inches forward and downward, driven by this hydraulic pressure, and in doing so it grows out of the compression field of the head of the rail and into the tensile field of the web. It is at this point that it suddenly propagates, fracturing the rail.
The answer – looking at equation (10.17) – is to make sure the surface cracks do not get too long; K1 for a short pressurised crack is small, for a long one it is large. Proper rail maintenance involves regularly grinding the top surface of the track to remove the cracks, and when this has caused significant loss of section, replacing the rails altogether.
Fatigue crack growth: living with cracks
The crack in the LPG tank of the earlier case study showed evidence of ‘striations’: ripples marking the successive positions of the crack front as it slowly advanced, driven by the cyclic pressurising of the tank. The cause of the explosion was over-pressure caused by poor maintenance, but suppose maintenance had been good and no over-pressure had occurred. How long would it have lasted before fatigue grew the crack right through the wall and it leaked? First, we had better check that the material had been correctly chosen to ensure leak-before-break. To calculate the critical crack length, c∗, we invert equation (10.3) giving
 (10.18)
With K1c = 45 MPa.m1/2, σ = 84 MPa (the working stress), and Y = 1, the answer is c∗ = 91 mm. This is much greater than the wall thickness t = 14 mm, so leak-before-break is satisfied (assuming the pressure release system works). So how long would it take the initial crack that was identified in the failure, of length 10 mm, to grow to 14 mm? A week? A month? 20 years?
Fatigue-crack growth where there is a pre-existing crack was described in Chapter 9. Its rate is described by the Paris law equation
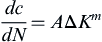 (10.19)
Note that when using this equation, care is needed with the value of the constant A, which depends on the units of c and ΔK, and on the value of the exponent m. Substituting for ΔK in equation (10.19) gives
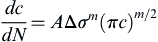 (10.20)
The residual life, NR, is found by integrating this between c = ci (the initial crack length) and (in this case) c = t, the value at which leaking will occur:
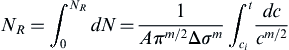 (10.21)
For the steel of which the tank is made we will take a typical crack-growth exponent m = 4 and a value of A = 2.5 × 10⁻¹⁴ (for which Δσ must be in MPa). Taking the initial crack length ci = 10 mm and t = 14 mm, the integral gives
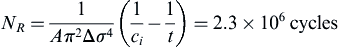
So assuming that the tank is pressurised once per day, it will last forever.
This sort of question always arises in assessing the safety of a large plant that (because of welds) must be assumed to contain cracks: the casing of steam turbines, chemical engineering equipment, boilers, and pipe-work. The cost of replacement of a large turbine casing is considerable, and there is associated down-time. It does not make sense to take it out of service if, despite the crack, it is perfectly safe. Proof testing is used to guarantee a number of cycles, as follows. The vessel is over-pressurised above the working pressure, using a liquid rather than gas (since the stored energy in compressed liquid is much lower than in a gas at the same pressure, so that failure of the vessel will not lead to an explosion). The proof stress in the wall must be high enough to detect crack lengths below the wall thickness. There may be no cracks at all, but if the vessel survives the proof test we can guarantee that there are no cracks present above the critical crack length for this (higher) stress level – this is then used as ci in equation (10.21). Note that the guaranteed residual life is increased if the initial crack length in the integral is smaller. This means increasing the proof stress, but there is a practical limit on this: it cannot exceed the yield stress of the material. However, after the specified number of safe pressurisation cycles, the proof test can be repeated and the same lifetime is guaranteed all over again.
Example 10.4
The cylindrical steel pressure vessel in Example 10.1 is built with a wall thickness of 15 mm. It is to be proof tested to guarantee 2000 safe cycles of pressurisation. The rate of crack growth is given by dc/dN = A(ΔK)4 where A = 3 × 10⁻¹⁴ (with c in metres and ΔK in units of MPa.m1/2).
Use the integral in equation (10.21) to find the maximum initial crack size that will take 2000 cycles to grow to the wall thickness (and failure by leaking). Hence calculate the pressure required in a proof test to ensure that such a crack does not exist. Use the chart in Figure 10.6 to see if the applied stress looks reasonable relative to the yield stress of steels with fracture toughness of 110 MPa.m1/2.
Answer
The stress amplitude in the wall during normal pressurisation cycles is

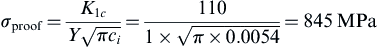
The proof stress required to fracture the steel with this crack length is
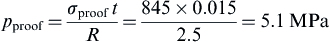
The corresponding pressure is
From Figure 10.6, the yield strength of (low alloy) steels with fracture toughness of 110 MPa.m1/2 is in the range 500–1000 MPa. So the proof stress will be all right provided a sufficiently high strength variant is used. If not, the proof stress must be reduced, giving a larger starting crack length and a shorter guaranteed number of cycles.
Designing for fracture
Manufacturers who distribute their products packaged in toughened envelopes, sheathed in plastic, or contained in aluminium or steel cans, need to design the containment so that the purchaser can get at the contents. As you will know, not all do – even getting the wrapper off a newly purchased CD is a pain. And there is a more serious dimension. Producers of foods, drugs, chemicals, even washing powder, now package their products in ‘break-to-access’ packaging so that the purchaser knows that it has not been tampered with. How do you arrange protection and yet enable fracture? One part of the answer is to choose the right material; the other is to provide stress concentrations to focus stress on the break lines or to use adhesives that have high shear strength but low peel resistance.
Start with material: materials with low ductility, in thin sheets, tear easily. If ‘opening’ means pulling in such a way as to tear (as it often does), then the first step is to choose a material with adequate stiffness, strength, and durability, but low ductility. The lids of top-opening drink cans are made of a different alloy than the can itself for exactly this reason.
Next, stress concentration. This means reducing the section by grooving or serrating the package locally along the line where tearing is wanted. Toilet paper, as we all know, hardly ever tears along the perforations, but it was the right idea. A sardine can is made of low-ductility aluminium alloy with a groove with a sharp radius of curvature along the tear line to provide a stress concentration factor (Chapter 7) of
 (10.22)
where c is the groove depth and ρ its root radius, and the factor (1/2) appears because the loading is shear rather than tension. A 0.2 mm groove with root radius of 0.02 mm gives a local stress that is 2.5 times higher than that elsewhere, localising the tearing at the groove.
The peel strip of a CD wrapper is not a groove; it is an additional thicker strip. How does this apparent reinforcement make it easier to tear open the package? Figure 7.7 provides the answer: it is because any sudden change of section concentrates stress. If the strip thickness is c and the radius where it joins the wrapping is ρ, the stress concentration is still given by equation (10.22).
The alternative to tearing is adhesive peeling. Figure 10.11 shows an adhesive joint before and during peeling. The adhesive has shear strength σs and toughness Gc. Adhesively bonded packaging must accept in-plane tension, since to protect the contents it must support the mass of its contents and handling loads. The in-plane pull force Ft that the joint can carry without failing is
where A = wL is the area of the bonded surface. To open it, a peel force Fp is applied. The lower part of Figure 10.11 shows how Fp works when the joint is peeled back by a distance δx, creating a new surface of area wδx. This requires an energy Gc × wδx (since Gc, the toughness, is the energy to create the unit area of the new surface). The work done by Fp must provide this energy, giving
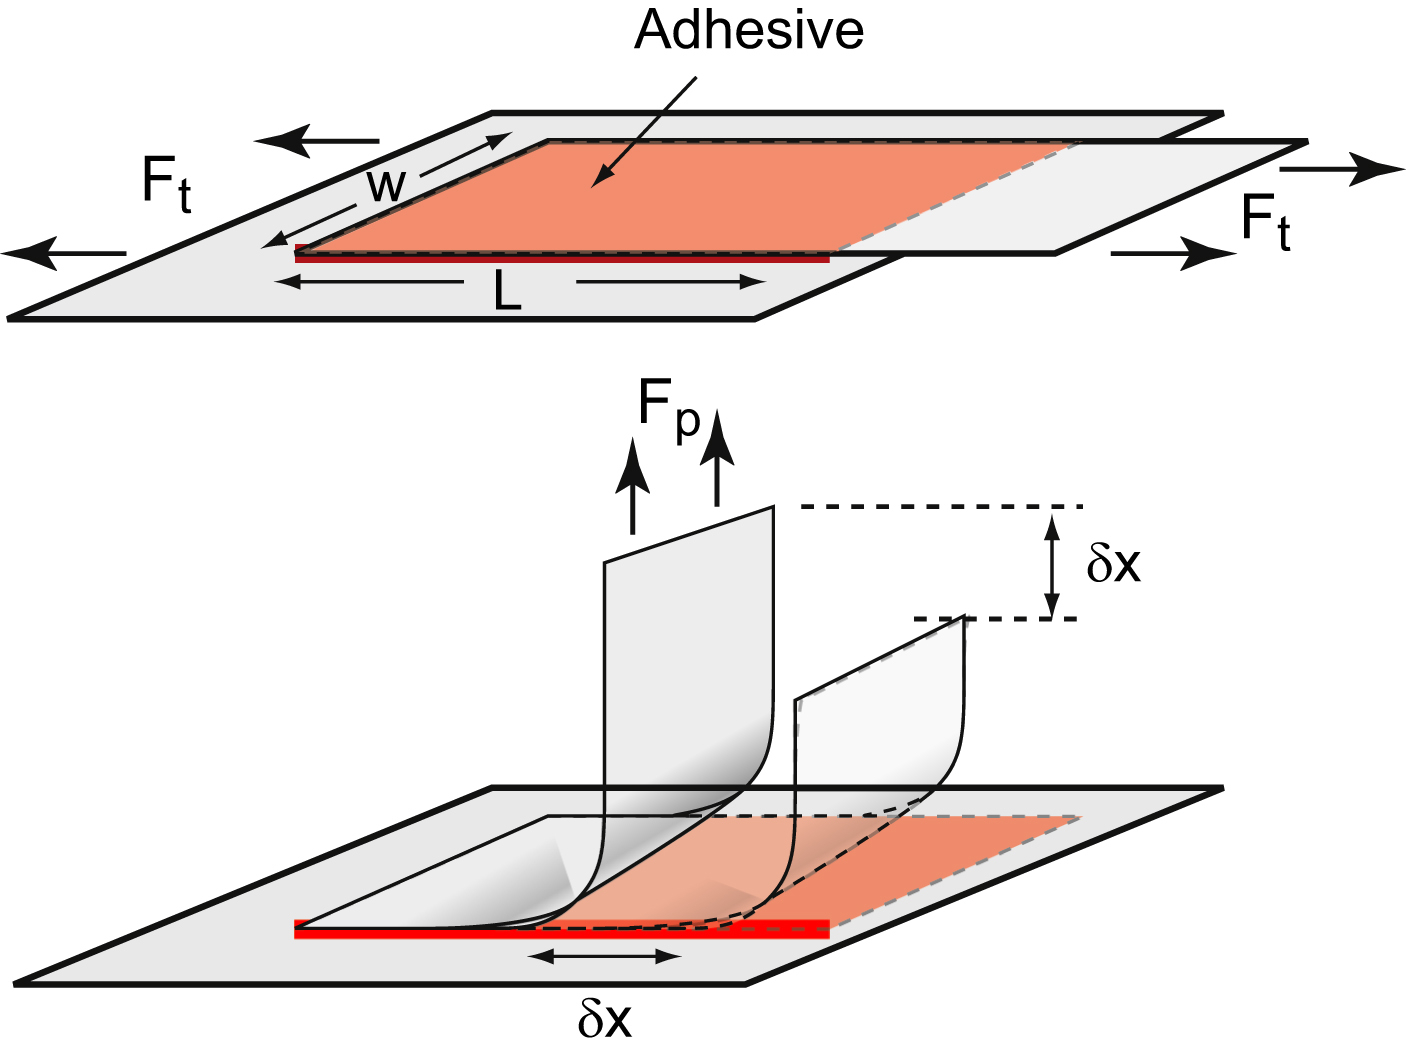
Thus Fp = wGc. The ratio of the peel force to the tensile force is

Adhesive joints are designed to have a particular value for this ratio. The choice of adhesive sets the values of Gc and σs, allowing the length L to be chosen to give tensile strength with ease of peeling.
10.5. Summary and conclusions
Elastic deformation is recoverable. Plastic deformation is gradual and detectable before really bad things happen. Failure by fast fracture is none of these. It has been the cause of many great engineering disasters: collapsed bridges, burst boilers, rail accidents, aircraft crashes.
A component will fail by fast fracture if the stress intensity K1 at any crack-like defect it contains exceeds the fracture toughness K1c of the material of which it is made. The understanding of fast fracture and the development of design methods to deal with it are relatively new – before 1950 little was known. Both are now on a solid basis. This chapter introduced them, describing the ways in which K1 is calculated, and the various scenarios in which it is relevant, with examples of their application.
Much the same is true of failure by fatigue. A seemingly healthy component, one that has served its purpose well, fails without warning because an initially small and harmless crack has grown until it reached the size at which fast fracture takes over. Small components may, initially, be crack free, but cyclic loading can lead to crack nucleation and subsequent growth; design is then based on the S–N curve of the material. Larger structures, particularly those that are welded, cannot be assumed to be crack free; then the life is estimated from the predicted rate of crack growth, integrating it to find the number of cycles to grow the crack to a dangerous size.
Fracture, however, is not always bad. Enabling fracture allows you to get at the contents of shrink-wrapped packages, to access food and drugs in tamper-evident containers, and to have the convenience of drinks in pop-top cans. Here the trick is to design-in stress concentrations that create locally high stresses along the desired fracture path, and to choose a material with adequate strength but low ductility.
10.7. Exercises
| Exercise E10.1 | Supersonic wind tunnels store air under high pressure in cylindrical pressure vessels – the pressure, when released, produces hypersonic rates of flow. The pressure vessels are routinely proof tested to ensure that they are safe. If such a cylinder, of diameter 400 mm and wall thickness 20 mm, made of a steel with a fracture toughness K1c = 42 MPa.m1/2, survives a proof test to 40 MPa (400 atm), what is the length of the largest crack it might contain? |
|---|---|
| Exercise E10.2 | A thin-walled spherical pressure vessel of radius R = 1 m is made of a steel with a yield stress of 600 MPa and a fracture toughness K1c of 100 MPa.m1/2. The vessel is designed for an internal working pressure p = 20 MPa. (a) Find a suitable wall thickness if the maximum stress is to be kept below 60% of the yield stress. The stress in the wall of a uniform spherical pressure vessel is given by (b) The pressure vessel is inspected by a non-destructive method, and an embedded penny-shaped crack of length 2c = 10 mm is found in the wall (i.e. from Figure 10.2, the geometry factor Y = 0.7 in the expression for K). Will the pressure vessel survive at the working pressure, and in a proof test at 90% of the yield stress? |
| Exercise E10.3 | You are asked to select a polymer to make a flexible coupling. The polymer must have a modulus greater than 2 GPa. The objective is to maximise the available flexure without fracture. Use the chart of Figure 10.4 to identify two good choices to meet these requirements. Are there any metals that are as good? If the flexible coupling is a door hinge, what other material behaviour should be considered to avoid premature failure in service? |
| Table Continued | |

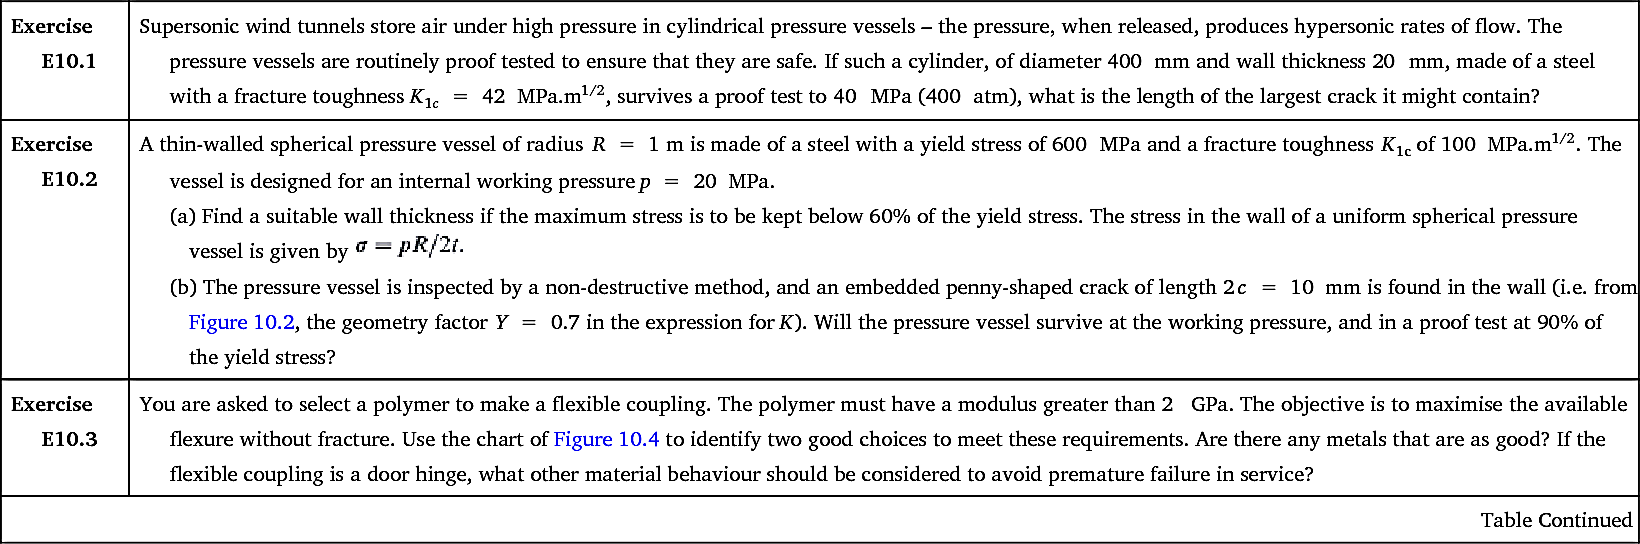
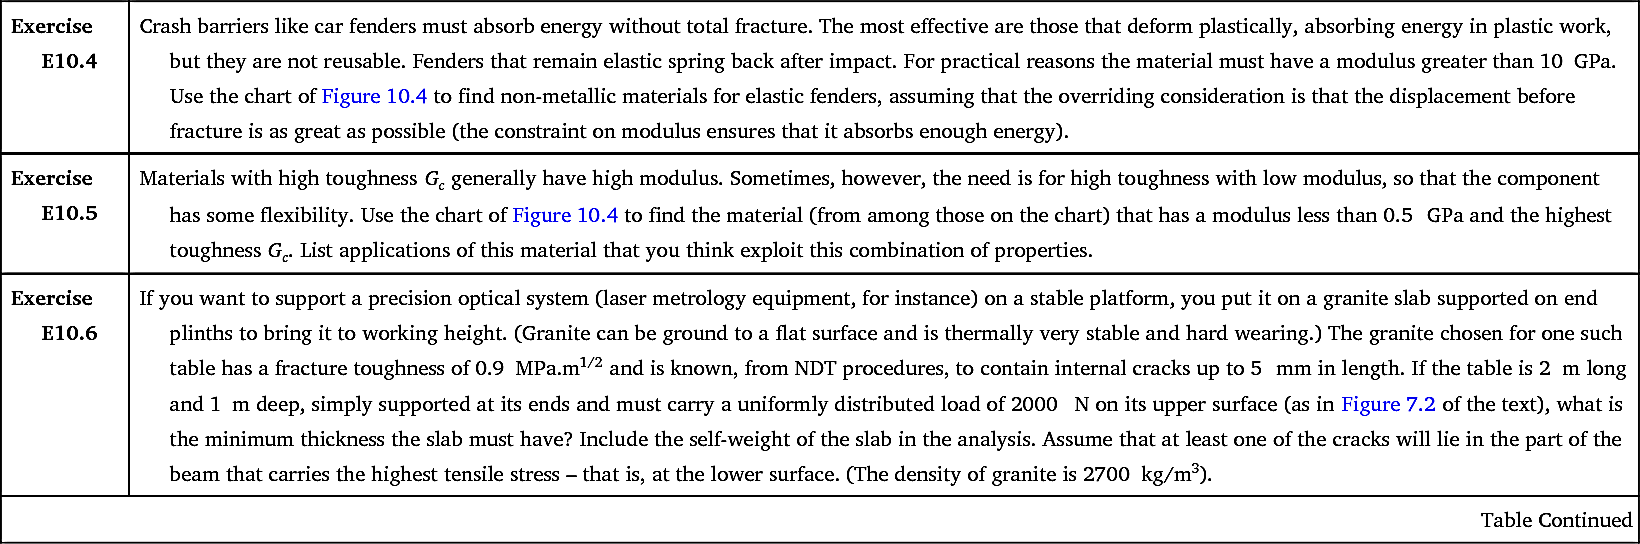
| Exercise E10.4 | Crash barriers like car fenders must absorb energy without total fracture. The most effective are those that deform plastically, absorbing energy in plastic work, but they are not reusable. Fenders that remain elastic spring back after impact. For practical reasons the material must have a modulus greater than 10 GPa. Use the chart of Figure 10.4 to find non-metallic materials for elastic fenders, assuming that the overriding consideration is that the displacement before fracture is as great as possible (the constraint on modulus ensures that it absorbs enough energy). |
|---|---|
| Exercise E10.5 | Materials with high toughness Gc generally have high modulus. Sometimes, however, the need is for high toughness with low modulus, so that the component has some flexibility. Use the chart of Figure 10.4 to find the material (from among those on the chart) that has a modulus less than 0.5 GPa and the highest toughness Gc. List applications of this material that you think exploit this combination of properties. |
| Exercise E10.6 | If you want to support a precision optical system (laser metrology equipment, for instance) on a stable platform, you put it on a granite slab supported on end plinths to bring it to working height. (Granite can be ground to a flat surface and is thermally very stable and hard wearing.) The granite chosen for one such table has a fracture toughness of 0.9 MPa.m1/2 and is known, from NDT procedures, to contain internal cracks up to 5 mm in length. If the table is 2 m long and 1 m deep, simply supported at its ends and must carry a uniformly distributed load of 2000 N on its upper surface (as in Figure 7.2 of the text), what is the minimum thickness the slab must have? Include the self-weight of the slab in the analysis. Assume that at least one of the cracks will lie in the part of the beam that carries the highest tensile stress – that is, at the lower surface. (The density of granite is 2700 kg/m3). |
| Table Continued | |
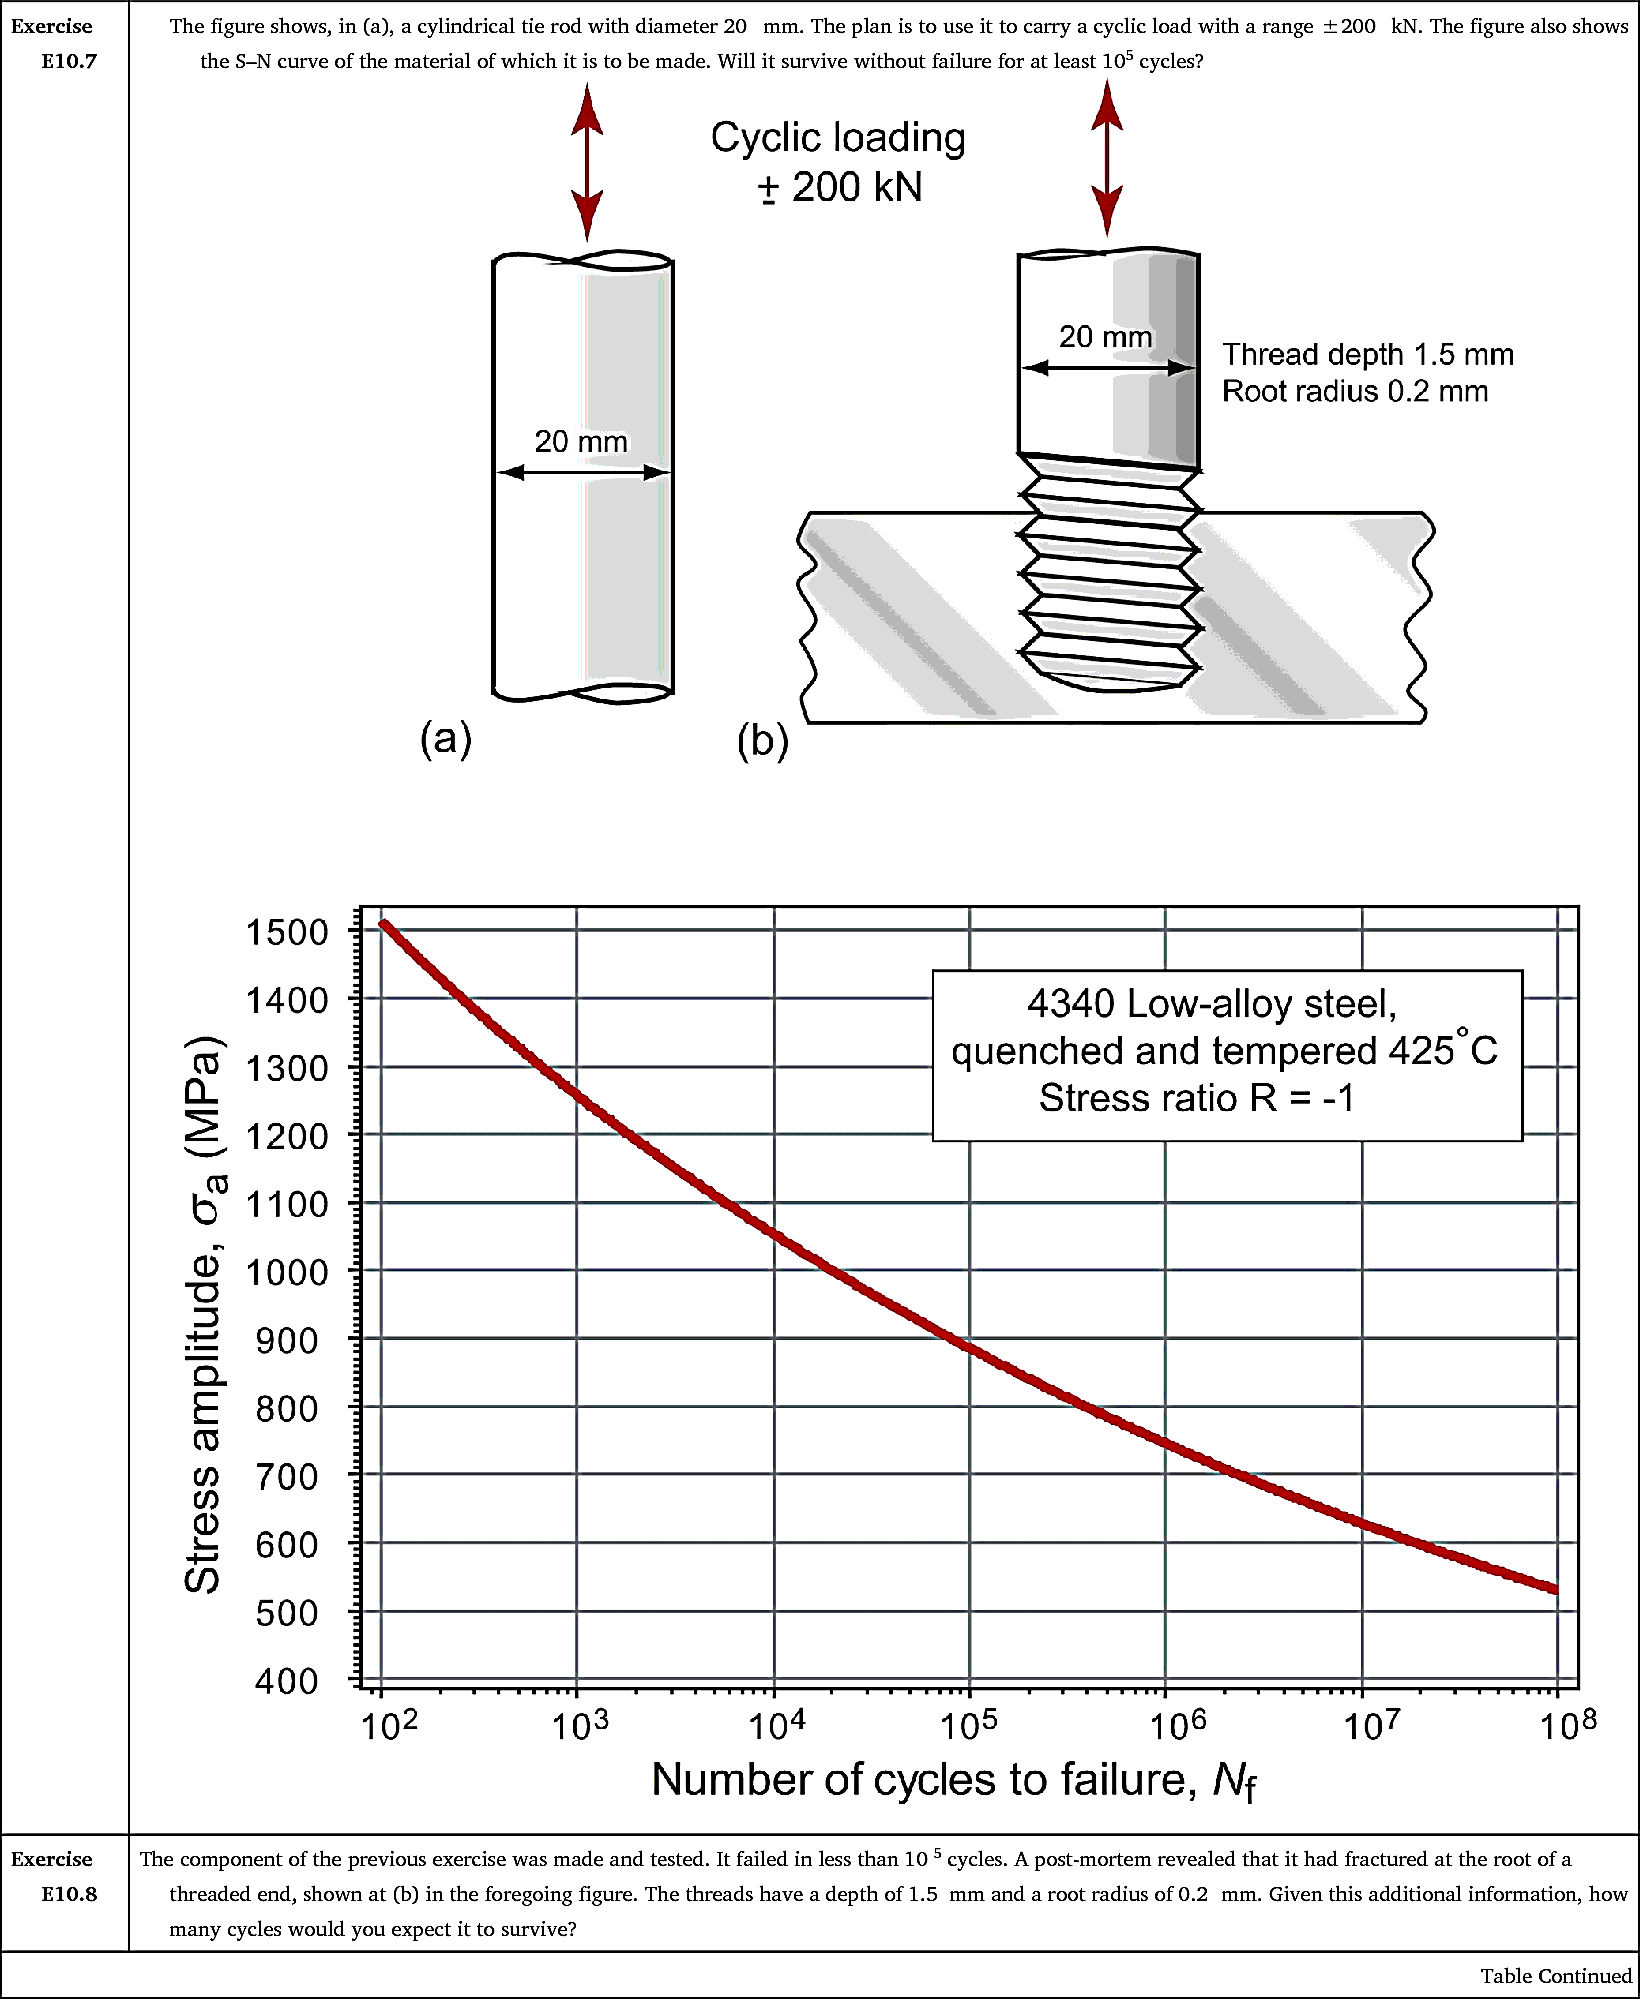
| Exercise E10.7 | The figure shows, in (a), a cylindrical tie rod with diameter 20 mm. The plan is to use it to carry a cyclic load with a range ±200 kN. The figure also shows the S–N curve of the material of which it is to be made. Will it survive without failure for at least 105 cycles? 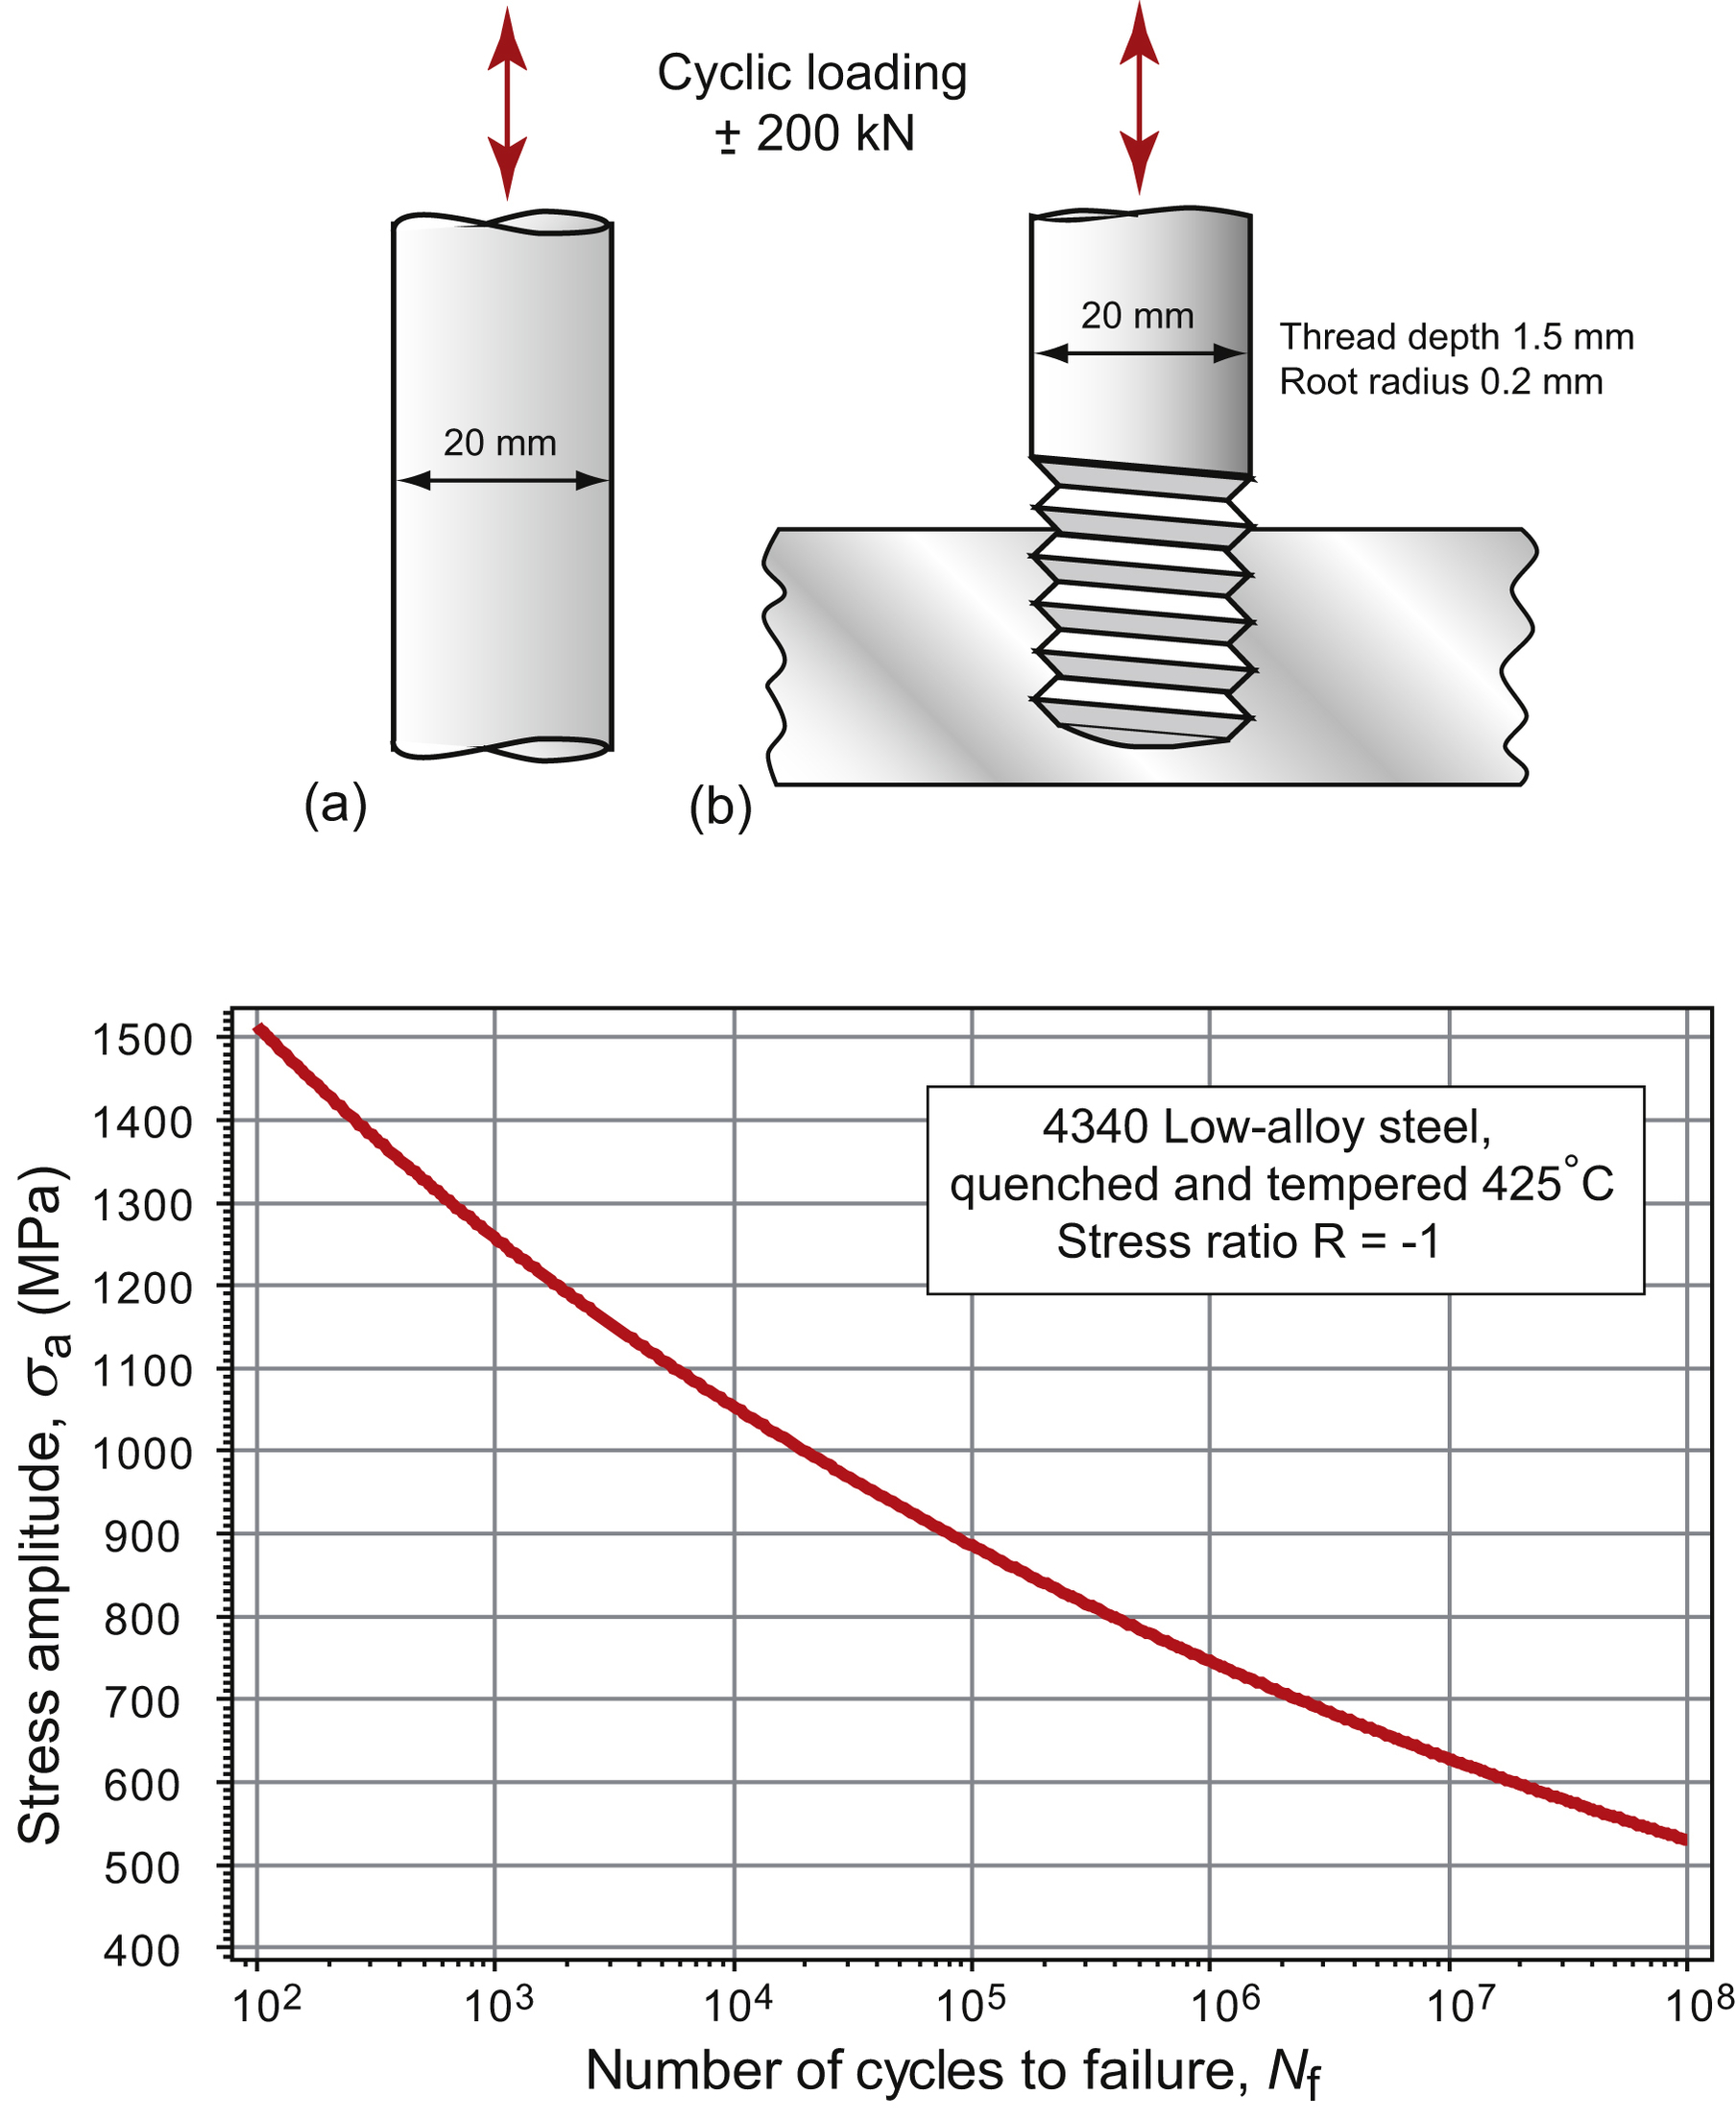 |
|---|---|
| Exercise E10.8 | The component of the previous exercise was made and tested. It failed in less than 105 cycles. A post-mortem revealed that it had fractured at the root of a threaded end, shown at (b) in the foregoing figure. The threads have a depth of 1.5 mm and a root radius of 0.2 mm. Given this additional information, how many cycles would you expect it to survive? |
| Table Continued | |
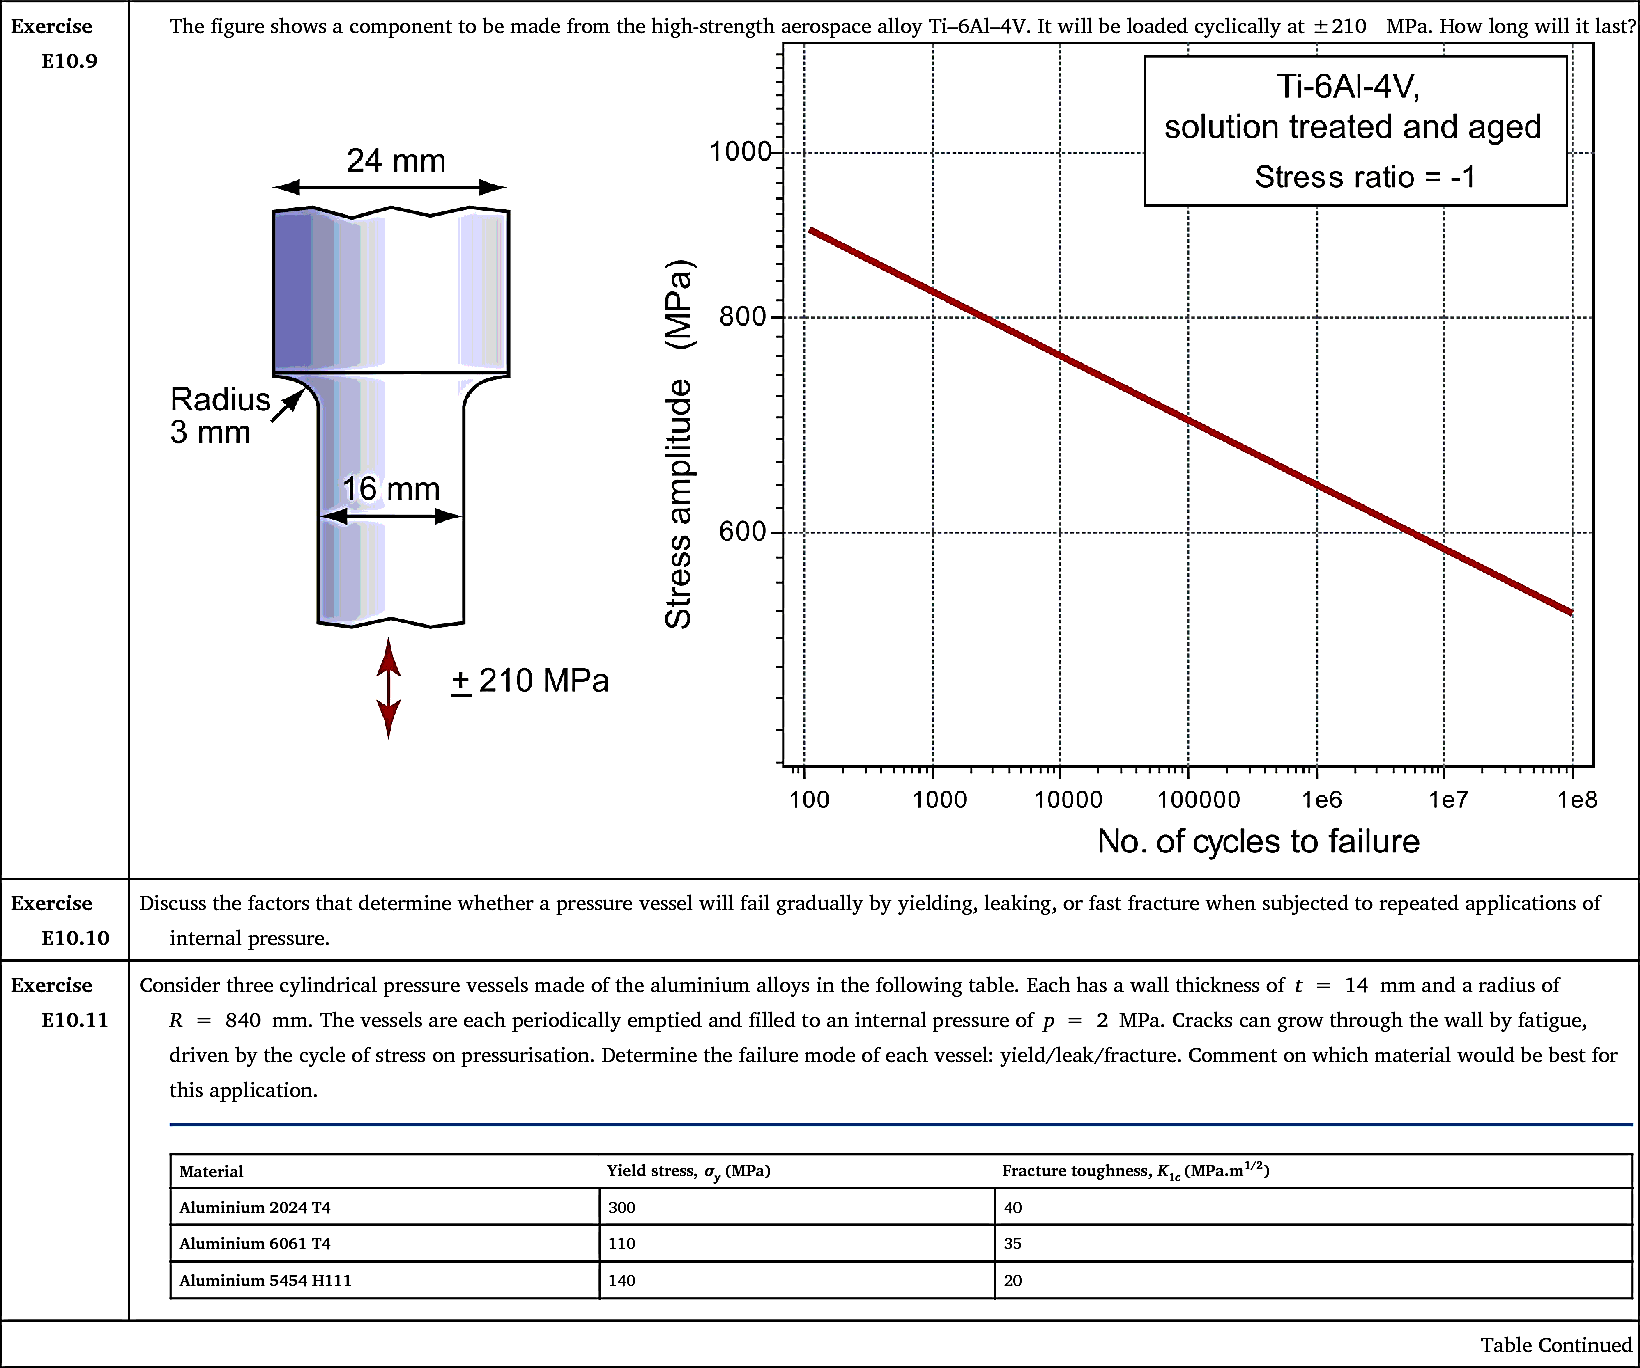
| Exercise E10.9 | The figure shows a component to be made from the high-strength aerospace alloy Ti–6Al–4V. It will be loaded cyclically at ±210 MPa. How long will it last?  | ||||||||||||
|---|---|---|---|---|---|---|---|---|---|---|---|---|---|
| Exercise E10.10 | Discuss the factors that determine whether a pressure vessel will fail gradually by yielding, leaking, or fast fracture when subjected to repeated applications of internal pressure. | ||||||||||||
| Exercise E10.11 | Consider three cylindrical pressure vessels made of the aluminium alloys in the following table. Each has a wall thickness of t = 14 mm and a radius of R = 840 mm. The vessels are each periodically emptied and filled to an internal pressure of p = 2 MPa. Cracks can grow through the wall by fatigue, driven by the cycle of stress on pressurisation. Determine the failure mode of each vessel: yield/leak/fracture. Comment on which material would be best for this application.
| ||||||||||||
| Table Continued | |||||||||||||
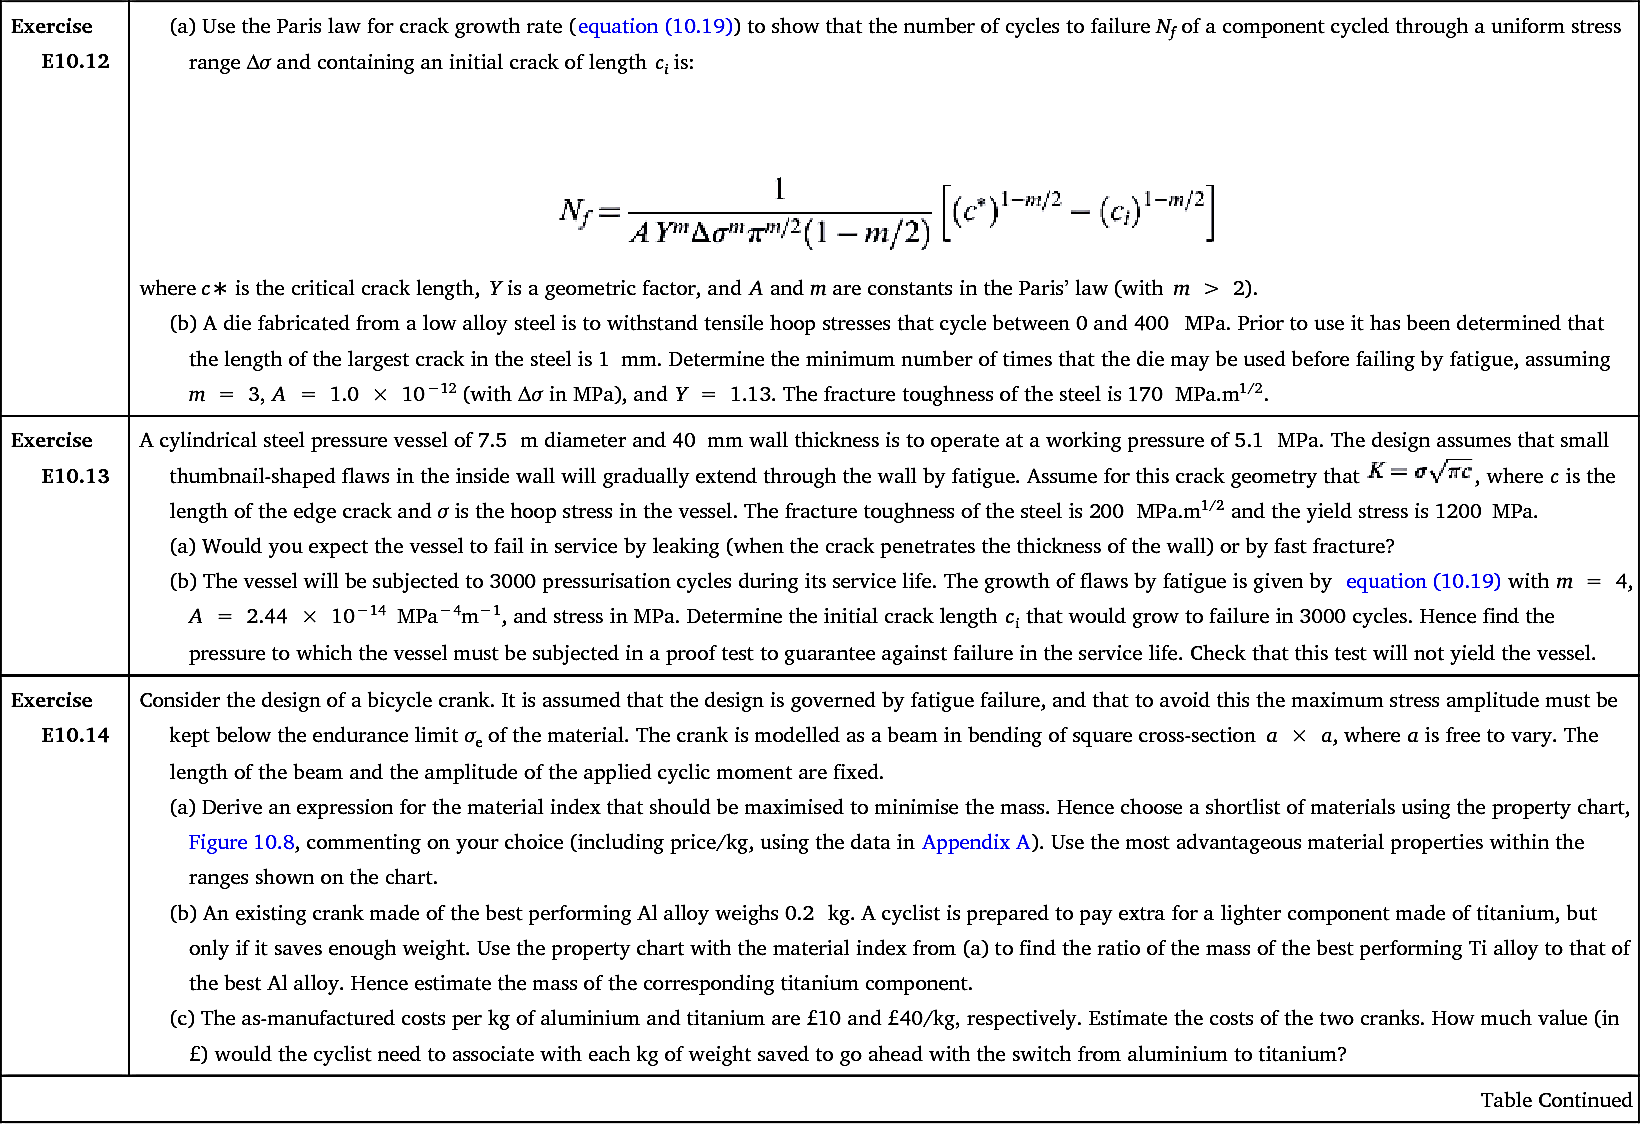
| Exercise E10.12 | (a) Use the Paris law for crack growth rate (equation (10.19)) to show that the number of cycles to failure Nf of a component cycled through a uniform stress range Δσ and containing an initial crack of length ci is: 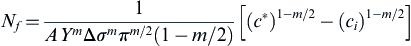 (b) A die fabricated from a low alloy steel is to withstand tensile hoop stresses that cycle between 0 and 400 MPa. Prior to use it has been determined that the length of the largest crack in the steel is 1 mm. Determine the minimum number of times that the die may be used before failing by fatigue, assuming m = 3, A = 1.0 × 10⁻¹² (with Δσ in MPa), and Y = 1.13. The fracture toughness of the steel is 170 MPa.m1/2. |
|---|---|
| Exercise E10.13 | A cylindrical steel pressure vessel of 7.5 m diameter and 40 mm wall thickness is to operate at a working pressure of 5.1 MPa. The design assumes that small thumbnail-shaped flaws in the inside wall will gradually extend through the wall by fatigue. Assume for this crack geometry that  , where c is the length of the edge crack and σ is the hoop stress in the vessel. The fracture toughness of the steel is 200 MPa.m1/2 and the yield stress is 1200 MPa. , where c is the length of the edge crack and σ is the hoop stress in the vessel. The fracture toughness of the steel is 200 MPa.m1/2 and the yield stress is 1200 MPa.(a) Would you expect the vessel to fail in service by leaking (when the crack penetrates the thickness of the wall) or by fast fracture? (b) The vessel will be subjected to 3000 pressurisation cycles during its service life. The growth of flaws by fatigue is given by equation (10.19) with m = 4, A = 2.44 × 10⁻¹⁴ MPa−4m−1, and stress in MPa. Determine the initial crack length ci that would grow to failure in 3000 cycles. Hence find the pressure to which the vessel must be subjected in a proof test to guarantee against failure in the service life. Check that this test will not yield the vessel. |
| Exercise E10.14 | Consider the design of a bicycle crank. It is assumed that the design is governed by fatigue failure, and that to avoid this the maximum stress amplitude must be kept below the endurance limit σe of the material. The crank is modelled as a beam in bending of square cross-section a × a, where a is free to vary. The length of the beam and the amplitude of the applied cyclic moment are fixed. (a) Derive an expression for the material index that should be maximised to minimise the mass. Hence choose a shortlist of materials using the property chart, Figure 10.8, commenting on your choice (including price/kg, using the data in Appendix A). Use the most advantageous material properties within the ranges shown on the chart. (b) An existing crank made of the best performing Al alloy weighs 0.2 kg. A cyclist is prepared to pay extra for a lighter component made of titanium, but only if it saves enough weight. Use the property chart with the material index from (a) to find the ratio of the mass of the best performing Ti alloy to that of the best Al alloy. Hence estimate the mass of the corresponding titanium component. (c) The as-manufactured costs per kg of aluminium and titanium are £10 and £40/kg, respectively. Estimate the costs of the two cranks. How much value (in £) would the cyclist need to associate with each kg of weight saved to go ahead with the switch from aluminium to titanium? |
| Table Continued | |
| Exercise E10.15 | Toilet paper and ring-push can openers were cited in the text as examples of the use of stress-concentrating features to give failure in a desired location in products. Take a look around your home for other examples of stress raisers that help the consumer break something by hand in a controlled way. |
|---|---|
| Exercise E10.16 | An adhesive has a toughness Gc = 100 J/m2 and a shear strength  = 0.1 MPa. What must the dimensions of the bonded area of a lap joint be if it is to carry an in-plane tensile Ft = 100 N, but allow peeling at a force Fp = 5 N? = 0.1 MPa. What must the dimensions of the bonded area of a lap joint be if it is to carry an in-plane tensile Ft = 100 N, but allow peeling at a force Fp = 5 N? |