12
Flux Modulation: Driving Force
Organisms control metabolic flux by altering the thermodynamic driving force of biochemical reactions. Organisms also modulate flux by altering the resistance that impedes reactions. This chapter focuses on thermodynamic driving force. The next chapter considers resistance.
The total driving force depends on the initial food inputs and the final products. Foods rich in free energy increase the potential driving force. Final products made by passing electrons to strong attractors have low free energy, increasing the potential driving force.
The metabolic cascade flows through many reaction steps. The driving forces for the individual steps sum to the total driving force. Dividing the total among the individual steps sets a key challenge in metabolic design.
For example, low driving force and a slow reaction in one step impede flux through the metabolic cascade. By contrast, high driving force and a fast reaction dissipate a lot of free energy.
Free energy dissipated in one reaction must be balanced by reduced driving force or lower metabolic efficiency for other reactions. The metabolic cascade may fail if there is not enough remaining free energy to drive all reactions.
The first section analyzes glycolysis. Recent advances measure the in vivo driving force for individual reaction steps. Those data illuminate how metabolic design modulates flux through the glycolytic cascade.
The second section discusses overflow metabolism. When a metabolic cascade runs too fast, product concentrations build up, slowing or reversing key reaction steps. To relieve product inhibition, organisms may excrete the inhibiting reaction products.
The excreted products contain usable free energy. Thus, fast metabolic rate trades off against reduced efficiency. That tradeoff provides an excellent model to study the forces that shape metabolic design.
The third section analyzes puzzles of design posed by overflow metabolism. Biochemical mechanisms such as product inhibition explain why excreting usable free energy may happen. But those mechanistic aspects do not explain why cells sometimes grow fast and wastefully excrete resources, while at other times cells grow more slowly and efficiently. Environmental factors that alter fitness costs and benefits ultimately determine design within the constraints imposed by biophysics.
The fourth section describes the alternative timescales for the evolutionary analysis of design. Short-term lab studies typically focus on how changed conditions alter physiological responses. Those studies often reveal biophysical constraints, such as how limited numbers of proteins in cells or limited membrane space constrain design.
Studies over several generations reveal how genetic variation provides opportunity to alter design. In the medium term, altered design typically occurs within the context of the current physiological system.
Comparing species or higher taxonomic levels reveals long-term evolutionary changes in design, including those that modulate biophysical constraints or alter the core physiological system. Such comparisons associate varying environmental challenges with the varying design of organismal traits. Overall, the different studies of metabolic design must be understood in terms of their evolutionary timescales of analysis.
The final section considers alternative glycolytic pathways. The pathways vary in their driving force, in the ways that they capture and store free energy, in the costs of running the cascades, and in the biochemical benefits that they provide for other functions. Those variations raise interesting puzzles of metabolic design.
12.1 Near-Equilibrium Glycolysis
Reactions with small free energy change are near equilibrium and proceed slowly (eqn 11.8). Small free energy change means that, after a reaction occurs, the system retains most of its initial free energy. In a reaction cascade, the retained negative entropy in one step can often be used to drive other reaction steps.
Reactions near equilibrium also have the benefit of easy flux modulation. Small changes in metabolite concentrations push the reaction away from equilibrium. Deviation from equilibrium increases the force that drives the system back toward equilibrium, increasing the reaction rate.
Thus, reactions near equilibrium save negative entropy and easily modulate flux. Those advantages suggest that certain environments favor metabolic reactions to be regulated near equilibrium. However, it has been difficult to measure the in vivo flux and free energy change.
Recent technical advances label metabolites to measure both forward and backward fluxes.309,310,459 From eqn 11.8, repeated here,

measurement of flux in both directions specifies the free energy change and deviation from equilibrium.
Measurements in a single environment can be difficult to interpret. For example, high flux through one reaction and slow near-equilibrium flux through another reaction may reflect the particular conditions rather than a general attribute of system design. Comparison between environments provides more insight.
E. COLI UNDER CHANGING NITROGEN AVAILABILITY
Park et al.310 compared E. coli flux when grown in limited and abundant nitrogen conditions. Cells grew slowly with arginine as the sole nitrogen source. After adding ammonia, a better nitrogen source, growth increased within minutes by 170% and glucose uptake increased by 60%. The concentrations of glycolytic intermediates did not change much, posing the puzzle of how glycolysis keeps up with increased overall flux.
Under limited nitrogen, many steps of glycolysis were near equilibrium, with small driving force per reaction. Park et al. measured five glycolytic transitions between the uptake of glucose and the output of phosphoenolpyruvate (PEP) near the end of glycolysis, just before pyruvate production (Fig. 12.1).
The overall driving force was low between glucose input and PEP output near the glycolytic endpoint. Most of the free energy change occurred at the first input and final output reactions. The low overall driving force when nitrogen is limited reflects low thermodynamic push from slow glucose uptake and low pull on PEP from limited cellular demand for growth.
Five minutes after adding ammonia to provide more nitrogen, the overall driving force approximately doubled. Most of the increase arose by greater push from rising glucose uptake and greater pull from increased growth demand for PEP and downstream products.
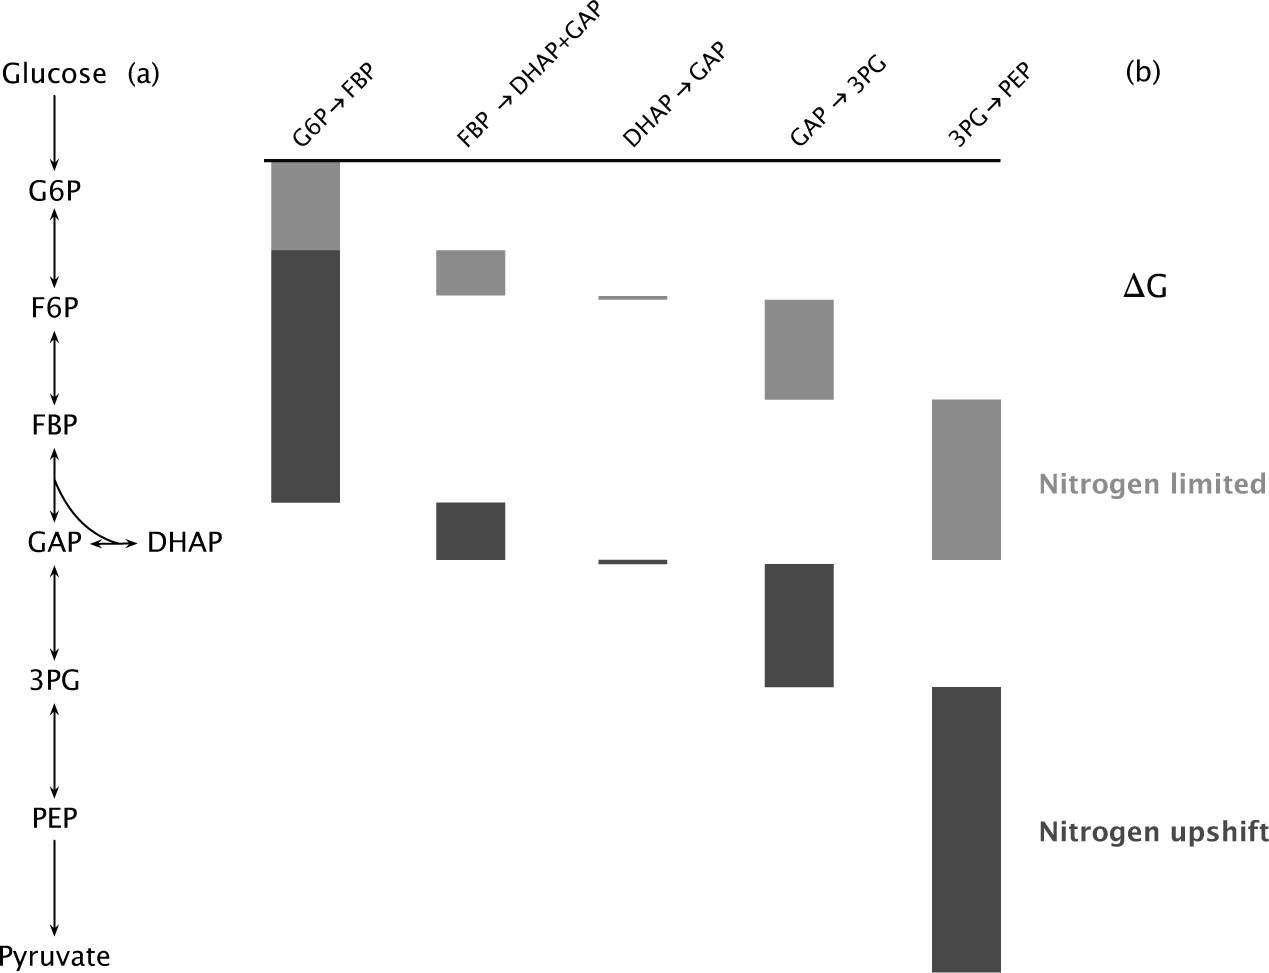
Figure 12.1 Free energy change (ΔG) between various intermediates in the E. coli glycolytic pathway. (a) Some of the intermediate molecules between glucose input and pyruvate output. The double-headed arrows indicate empirical measurements for forward and reverse flux for those reversible transformations. Most introductory biology books and biochemistry texts describe details for the full glycolytic cascade. (b) The height of each rectangle shows the relative free energy change between intermediates. The cumulative change is the sum of the changes for intermediate components. Light gray indicates growth under limited nitrogen conditions and dark gray indicates growth under abundant nitrogen. For the first difference on the left, the change for nitrogen upshift combines the heights of both rectangles. Redrawn from Fig. 3 of Park et al.310
The intermediate steps also increased their driving force and flux to keep up with demand. Because the reactions were initially close to equilibrium, significant increases in driving force and net flux arose from relatively small changes in concentrations.
The initial near-equilibrium state and rapid response to reactant concentrations require high enzyme concentrations. If enzymes were at low concentrations and nearly saturated, then greater incoming flux of reactants would only partially increase reaction rates.
The excess of enzymes near equilibrium adds a cost. Park et al.310 conclude that the benefit of being able to increase flux rapidly on nitrogen upshift by small changes in metabolite concentrations provides an overriding benefit. With excess enzyme, increased flux demand can be met by raising the net forward flux per enzyme molecule.
If, by contrast, the system reduced enzyme concentrations at low growth conditions, then, upon nitrogen upshift, several different enzymes would have to be produced simultaneously to raise flux.
Park et al.310 also studied response to phosphorous upshift. Glucose uptake increased by approximately four-fold, overall driving force increased by about a quarter, and growth rate increased.
When compared to nitrogen upshift, the change in phosphorus is associated with different initial and final driving forces for individual reactions. However, the overall flux increase once again arose primarily through greater driving force, although some enzymatic changes also occurred that lowered the resistance of reactions and increased kinetics.
E. COLI RESPONSE TO OXYGEN UPSHIFT
An upshift in oxygen availability causes a different pattern of change when compared to increases in nitrogen and phosphorus. When oxygen is limited, catabolic processing may end with glycolysis. As oxygen concentration increases, greater flux through the subsequent TCA cycle and electron transport becomes possible (Fig. 12.2).
Oxygen provides a strong electron acceptor that creates much greater overall thermodynamic driving force from the initial uptake of glucose to the final production of water and carbon dioxide. The enhanced driving force enables much larger ATP generation per glucose molecule than from glycolysis alone.
When Park et al.310 increased oxygen availability, cells decreased glucose consumption and increased growth rate, consistent with greater extraction of usable negative entropy per unit of food input. Additional oxygen slowed glycolysis, which likely resulted in spare enzymatic capacity in the glycolytic steps, associated with a move toward equilibrium and closer balance of forward and backward fluxes.
From a highly oxygenated state, a new increase in limiting nitrogen or phosphorus could once again use the spare enzyme capacity of near-equilibrium reactions to trigger a very rapid glycolytic increase.
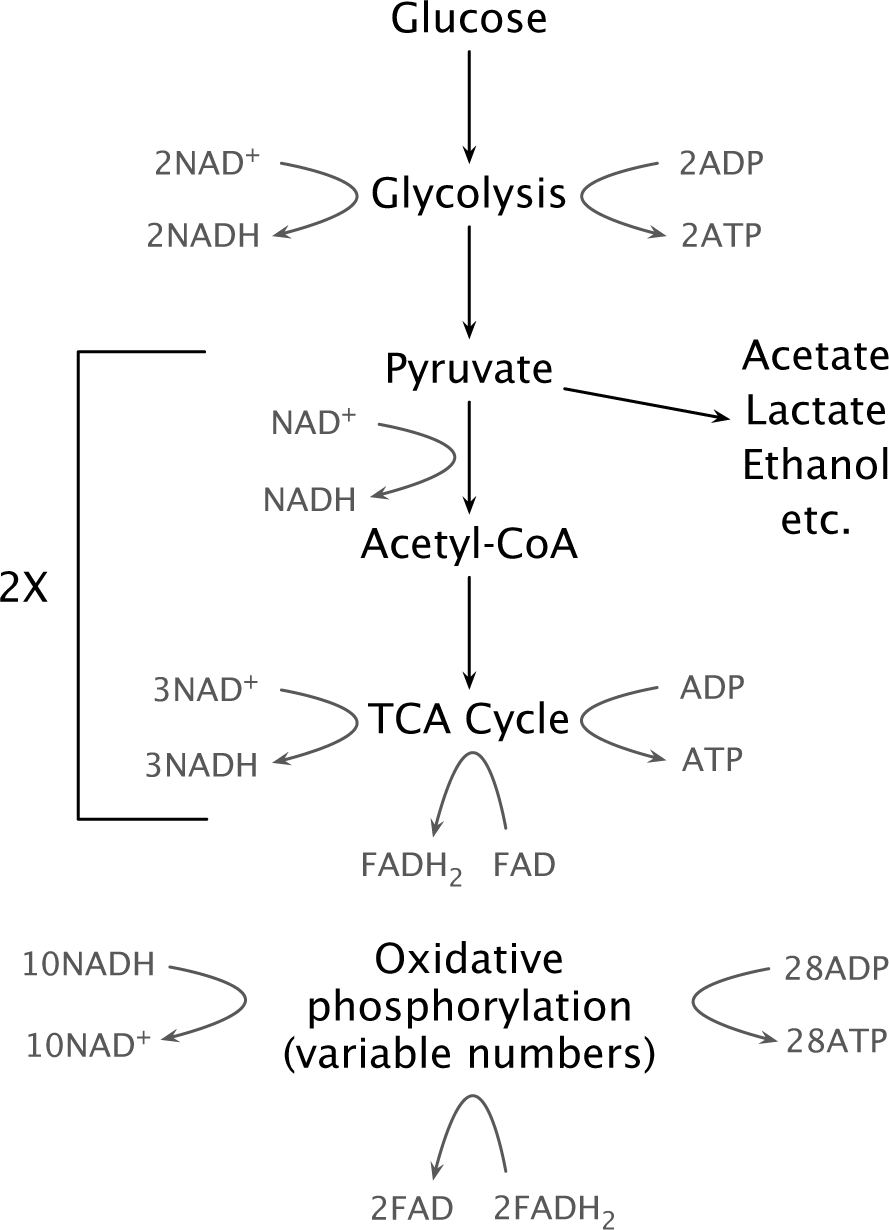
Figure 12.2 Rough sketch of the major catabolic pathways. Organisms vary in many details, including the numbers of ATP, NADH, and FADH2 produced and consumed. Foods composed of proteins or lipids are catabolized through different initial pathways, typically producing pyruvate or acetyl-CoA. Cells may excrete acetate, lactate, ethanol, or other glycolytic products rather than pass those products through acetyl-CoA and the TCA cycle. Glycolysis produces two pyruvate molecules, doubling the stochiometry of the lower pathways relative to the initial glucose input. Electron transport and oxidative phosphorylation use variable numbers of input NADH and FADH2 and convert a variable number of ADP to ATP. For example, one glucose and the consequent two pyruvates may associate with approximately 10NADH and 2FADH2 inputs and 28ATP outputs. Adding the 2ATP from glycolysis and the 2ATP from the 2TCA cycles, a single glucose molecule may yield approximately 32ATP.428
DIFFERENCES BETWEEN SPECIES IN ANAEROBIC GLYCOLYTIC DRIVING FORCE AND FREE ENERGY EFFICIENCY
When grown on glucose and with abundant nutrients, the anaerobic cellulose digesters Clostridium acetobutylicum and Thermoanaerobacterium saccharolyticum have strong glycolytic driving force and rapid growth similar to anaerobically grown E. coli.
By comparison, the cellulose digesters C. cellulolyticum and C. thermocellum grown on glucose have glycolytic driving force reduced by 80–90% and slower growth. Because these species dissipate less free energy across glycolysis, they can potentially capture more usable negative entropy per glucose molecule, obtained as more ATP generated per glucose input.193,310
Figure 12.3 illustrates the differences between the fast and slow species.
PUZZLES OF DESIGN
Why do species vary so much in glycolytic driving force and associated efficiency in extracting and storing free energy? Why do species such as E. coli respond to increased nutrients by rapidly enhancing glycolytic free energy change, flux, and growth, whereas species such as C. cellulolyticum retain low driving force and slow growth?
These challenges in understanding design often come down to three issues. First, how do particular biochemical mechanisms constrain response to changed conditions? Second, how do environmental and demographic conditions alter the fitness costs and benefits of different metabolic attributes? Third, how do the mechanisms and fitness consequences combine to shape observed patterns of organismal design?
Comparative predictions provide the best approach to solving those puzzles of design. Later chapters develop comparative predictions. This chapter emphasizes observed patterns of variation and mechanistic detail, the basis for formulating hypotheses about metabolic design.
12.2 Overflow Metabolism: Mechanisms
Aerobically metabolizing cells break down glucose through glycolysis, the tricarboxylic acid cycle (TCA), and the electron transport chain. Most of the captured free energy comes from the coupling of electron transport with oxidative phosphorylation to drive the ATP–ADP disequilibrium (Fig. 12.2).
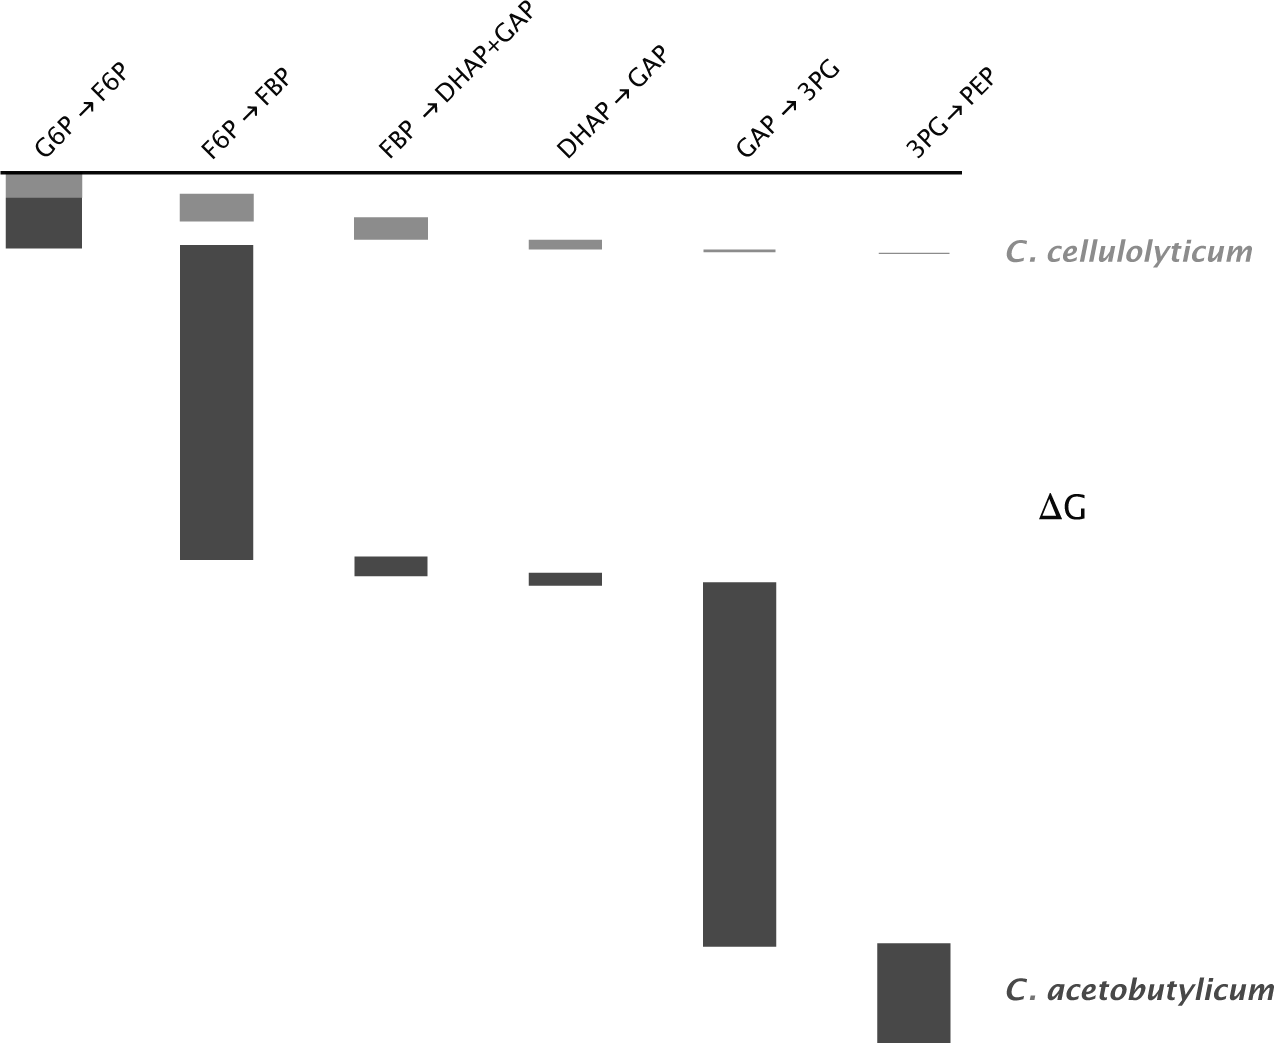
Figure 12.3 Free energy change (ΔG) between six intermediates in glycolysis (Fig. 12.1a). The height of each rectangle shows the relative free energy change between intermediates. The cumulative change is the sum of the changes for intermediate components. Light gray for Clostridium cellulolyticium and dark gray for C. acetobutylicum. For the first difference on the left, the change for acetobutylicum combines the heights of both rectangles. Data from supplementary table 12 of Park et al.310
In environments with low glucose and sufficient oxygen and nutrients, aerobically metabolizing cells process almost all of the sugar through the full sequence. As glucose availability increases up to an intermediate switch point, growth rate rises steadily and cells continue to catabolize through the full sequence.
Additional glucose beyond that intermediate switch point changes metabolic processing. Cells continue to pass some of their glycolytic output through the TCA cycle but also excrete excess glycolytic products such as acetate, ethanol, or lactate (Fig. 12.4).
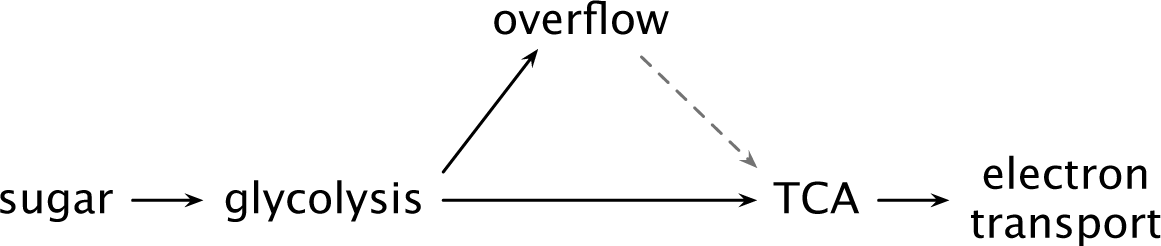
Figure 12.4 Catabolic flux and glycolytic overflow in cells capable of aerobic respiration. As sugar intake and glycolytic flux rise, cells may excrete glycolytic products. In E. coli at low sugar intake rate, all flux passes through the TCA cycle and electron transport, with no glycolytic overflow.28 As intake rises, post-glycolytic flux does not keep up and excess glycolytic flux overflows as excreted acetate. In S. cerevisiae, rapid sugar intake associates with excreting post-glycolytic flux as ethanol. After consuming the sugar, yeast cells may shift to catabolizing the ethanol through the TCA cycle, electron transport, and oxidative phosphorylation (dashed arrow).49
Increased glucose uptake and faster growth rate associate with glycolytic excretion in many bacterial, yeast, and mammalian cells. The glycolytic excretion is called overflow metabolism.78,326,452 Yeast studies typically label this process the Crabtree effect and mammalian studies the Warburg effect.316
As glucose availability rises above the switch point for overflow metabolism, growth rate continues to increase (Fig. 16.2). But cellular efficiency declines, measured as the biomass yield per gram of glucose taken up.326
The decline in efficiency associated with overflow metabolism likely occurs because almost all ATP production per glucose molecule happens in the post-glycolytic pathways (Fig. 12.2). Overflow metabolism excretes most of the potentially available negative entropy that drives ATP production. Oxygen and nutrients seem to be fully supplied, so it appears that cells are wasting food resources.
In the following subsections, I describe several mechanisms that may explain overflow metabolism.78 I then discuss how the mechanistic explanations must be considered in the broader context of fitness costs and benefits. Those design forces shape metabolism subject to the constraint forces imposed by mechanism. The interplay between design and constraint forces provides the basis for comparative predictions.
THERMODYNAMIC INHIBITION REDUCES GLYCOLYTIC DRIVING FORCE
Overflow metabolism suggests that the post-glycolytic pathways hit some limit. If flux slows through those later pathways, then the glycolytic products build up in concentration.
When the concentration of a product rises to its equilibrium level, the free energy driving force decreases to zero (eqns 11.7, 11.8). Thus, excess glycolytic products extinguish the driving force of glycolysis, bringing cellular metabolism to a halt. Excretion of glycolytic products relieves this thermodynamic inhibition, increasing the glycolytic driving force.
Greater glycolytic driving force speeds the rate of glycolysis but also discards a lot of free energy, reducing the capture of free energy in the ATP–ADP disequilibrium. Overflow metabolism enhances catabolic rate and reduces yield efficiency.
In environments that favor rapid growth, the fitness benefit of maintaining rapid glycolytic ATP production may outweigh the cost of reduced efficiency. In that case, the fitness benefit from rapid ATP production provides a sufficient explanation for glycolytic overflow.316
Next, I summarize three mechanisms that may constrain flux downstream from glycolysis, causing thermodynamic inhibition.78
NADH–NAD+ REDOX IMBALANCE INHIBITS FLUX
Thermodynamic inhibition in metabolism may be expressed in terms of redox potential.467 I briefly describe redox potential. I then present the NADH–NAD + redox imbalance that may cause overflow metabolism.
In overflow metabolism, the excretion of glycolytic products suggests that flux through post-glycolytic pathways has slowed. As those lower pathways back up, cells discard some of their glycolytic products to maintain thermodynamic driving force.
From a thermodynamic perspective, what exactly is backing up and what is being discarded to bring the pathways back into thermodynamic balance? In other words, what is the proper currency to measure backup, excretion, and balance? Redox potential is the proper currency.467
Redox potential measures how strongly molecules attract and hold electrons. Entropy increases as electrons attach to more strongly attracting molecules. Molecules that hold electrons relatively weakly have relatively lower entropy and higher free energy. Much of the negative entropy in food arises from the relatively weakly held electrons.
Entropy increases as the electrons flow through catabolism from weakly attracting food to strongly attracting final electron acceptors, such as oxygen. Catabolism is the orderly processing of that electron flow, designed to capture food’s negative entropy in molecular forms that can drive cellular processes.
Overflow metabolism arises from an imbalance in the electron flow from electron donors to electron acceptors. Electron donors are described as reducing their molecular partners because they transmit negatively charged electrons that reduce the charge of the recipient molecules. Electron acceptors oxidize (increase) the electric charge of their partners by taking away negatively charged electrons.
The flow of electrons between reduction-oxidation (redox) pairs determines much of the thermodynamic flux of entropy and free energy in metabolic reactions.
In the process of breaking down food, catabolic processing transfers some of the food’s weakly held electrons to special molecules that are kept in disequilibrium, such as the transfer to ATP kept in disequilibrium against ADP. The disequilibrium of those special molecules hold for later use relatively weakly held electrons and their high potential thermodynamic driving force.
In glycolysis and the TCA cycle, some of the negative entropy in food’s electrons is captured by the NADH–NAD + disequilibrium in the reaction
NAD+ + H+ + 2e− ↔ NADH.
An input of free energy can push the concentration of NADH above its equilibrium level. The free energy comes from coupling this reaction to a spontaneous catabolic reaction that loses free energy. The total free energy change of the coupled reactions is negative, as it must be to guarantee the increase of entropy required for all aggregate changes.
In later reactions, dissipating the NADH–NAD + disequilibrium pulls relatively weakly held electrons away from NADH toward a more attractive partner. That redox electron flow increases entropy, providing a driving force for other reactions.
The loss of electrons from NADH to more strongly attracting molecules is the primary driver of the electron transport chain, which transfers to ATP the free energy contained in the relatively weakly held electrons of NADH.
We can now return to the problem of overflow metabolism. In essence, some aspect of the TCA cycle or the electron transport chain fails to keep up with the electron flux from highly reduced food toward more strongly electron-attracting molecules.
Glycolytic products attract electrons more strongly than the initial food source. But if those glycolytic products cannot pass their electrons on to even more strongly attracting molecules in the downstream TCA cycle and electron transport chain, then the electrons at that intermediate redox level build up in those glycolytic products.
The buildup in the concentration of electrons with intermediate redox potential in glycolytic products moves the system toward its equilibrium. That reduction in disequilibrium slows the thermodynamic flux of entropy, impeding the flow of electrons through glycolysis. Cells may relieve that electron flux inhibition by excreting glycolytic products, maintaining sufficient disequilibrium.
What causes the backup in electron flux in the downstream TCA cycle or electron transport chain?
In E. coli, the NADH–NAD + ratio rises sharply at the onset of overflow metabolism.423 That extreme disequilibrium means that there is little NAD + available to make NADH by accepting electrons that flow through the TCA cycle. Overflow metabolism functions to excrete excess weakly held electrons that cannot flow through a redox potential gradient in the TCA pathway. Studies of the yeast S. cerevisiae also show that an NADH–NAD + imbalance associates with overflow metabolism.186,424
To study the role of the NADH–NAD + ratio, Vemuri et al.423 created an E. coli strain that overexpresses an NADH oxidase. That enzyme lowers the NADH–NAD + ratio. The lower ratio associates with more NAD + to accept electrons and produce NADH. Maintenance of the NAD + electron acceptor allows the continuous flow of electrons from glycolysis through the later pathways at higher glucose uptake rates.
However, high glucose uptake rates often trigger repression of some genes in the TCA cycle and electron transport. Reduced enzyme or cytochrome levels constrain flux, creating another barrier to flow through the post-glycolytic pathways.
To prevent repression of post-glycolytic pathways, Vemuri et al.423 knocked out a transcription factor gene, arcA. The combined excess NADH oxidase and knockout of arcA restored electron flux balance and allowed cells to catabolize more glucose through the TCA cycle and electron transport. Enhanced catabolic processing reduced or eliminated overflow excretion of glycolytic products, even at high glucose uptake rates.
Excess NADH oxidase causes futile cycling between electron acceptance that transforms NAD + to NADH and electron loss that reverses the transformation. The cycling is futile because the electron flow does not drive useful biochemical transformations.348 Associated with that futile cycling and waste of free energy, excess NADH oxidase reduces biomass yield relative to the wild type.
In summary, a rise in the NADH–NAD + ratio at high glucose uptake rates causes redox imbalance and associates with excretion of glycolytic products. The imbalance also associates with repression of the TCA and electron transport pathways.
Excess NADH oxidase and loss of the repressor for later metabolic pathways restore redox balance, enhancing flux through the full aerobic catabolic pathway. However, the engineered mutant strain has lower biomass yield per gram of glucose taken up. Reduced yield may occur because of the futile cycling of NADH and NAD + or the higher proteome cost of the post-glycolytic aerobic pathways (p. 168).
Vemuri et al.’s423 experimental study shows that relieving the NADH–NAD + redox imbalance can restore post-glycolytic flux and reduce the overflow excretion of glycolytic products. In natural isolates that suffer NADH–NAD + redox imbalance at high glucose uptake rate, what mechanism causes the buildup of that redox imbalance? The following subsections consider two possibilities.
MEMBRANE SURFACE TRADEOFF BETWEEN GLUCOSE UPTAKE AND ELECTRON TRANSPORT
On E. coli’s inner cytoplasmic membrane, glucose transporters must compete for membrane space with electron transporters. As growth rate rises and demand on membrane proteins increases, a tradeoff may occur between glucose uptake and electron transport.320,399,472
At moderate metabolic rate, there is enough membrane space for cells to balance glucose uptake and the final electron transport steps of aerobic ATP production. At high metabolic rate, demand for glucose uptake may crowd out electron transport. By this hypothesis, fast-growing cells excrete excess glycolytic products because limited electron transport capacity prevents some glycolytic products from flowing through the post-glycolytic pathways.399,472
Normally, the electron transport chain moves the relatively weakly held electrons of NADH to oxygen, which strongly attracts electrons. That process lowers NADH concentration and raises NAD + concentration.
When electron transport capacity becomes limiting, the buildup of NADH causes redox imbalance. Excreting glycolytic products slows creation of NADH in the TCA cycle, which reduces the NADH–NAD + disequilibrium and thermodynamic inhibition.
Szenk et al.399 studied the tradeoff between glucose uptake rate and electron transport capacity under the assumption of limited membrane space. In their theoretical analysis, abundant glucose favors allocating additional membrane space to glucose uptake, causing more glycolytic flux than can be processed by electron transport. With limited electron transport capacity, cells must excrete overflow glycolytic products to maintain catabolic flux.
According to Szenk et al.’s399 calculations, high glucose uptake and glycolytic overflow maximize the efficiency of ATP production per unit membrane area, enhancing the rate of ATP production.
Zhuang et al.472 suggested that eukaryotic cells may face a similar membrane limitation. Glycolysis occurs in the cytosol, yielding pyruvate. Mitochondria take up pyruvate through active transport across the inner mitochondrial membrane.272 Mitochondria also use their inner membrane for the electron transport chain.
Limited mitochondrial membrane space may create a tradeoff between electron transport and uptake of pyruvate or other nutrients. That mitochondrial membrane limitation may cause cells to excrete excess glycolytic products at high glucose uptake rates.
PROTEOME TRADEOFF BETWEEN CATABOLISM AND BUILDING BIOMASS
The proteome is the aggregate cellular protein content. The proteome efficiency of a cellular process can be measured by the amount of protein required to drive the process.
The proteome efficiency of catabolic pathways may be expressed as ATPs produced per unit proteome. Molenaar et al.279 suggested that glycolysis by itself is more efficient than the full catabolic pathway from sugar uptake through final aerobic processing.
In other words, glycolysis makes more ATPs per proteomic unit than does full processing through the TCA cycle and electron transport, even though glycolysis makes fewer ATPs per sugar molecule. Glycolysis is more efficient per unit proteome, whereas full aerobic processing is more efficient per unit carbon input.284
This theory predicts overflow metabolism. When the sugar uptake rate is high, the associated fast growth rate imposes strong proteomic demand for the proteins that aid in building biomass and replicating cells. Strong proteome demand for growth favors glycolytic catabolism, which is more proteome efficient. The switch toward glycolytic catabolism at high sugar uptake rate causes overflow excretion of glycolytic products.
When sugar uptake rate is low, the associated slow growth rate imposes weak proteomic demand. Limited carbon imposes a stronger constraint than does total protein. Cells gain by using the more carbon efficient post-glycolytic pathway of aerobic respiration.
Basan et al.28 tested the prediction that stronger proteome limitation increases glycolytic-dominated catabolism and overflow excretion. To test this prediction, they overexpressed the LacZ protein in E. coli. The more LacZ, the greater the proteome limitation will be for the expression of other proteins. They observed that greater proteome limitation enhanced overflow metabolism, supporting their prediction.
The theory depends on the assumption that glycolysis is more proteome efficient for ATP production than respiration via the TCA cycle, electron transport, and oxidative phosphorylation. Basan et al.28 used quantitative mass spectrometry and ribosome profiling to measure proteome efficiency per ATP produced. They estimated that glycolysis is approximately twice as efficient as respiration.
In summary, under high glucose uptake rate and fast growth, limited proteome capacity constrains cells. Proteome limitation favors the more proteome efficient glycolytic pathway over the less efficient respiration pathways, leading to overflow excretion of post-glycolytic products.298
Under low glucose uptake rate and slow growth, limited carbon availability constrains cells. Carbon limitation favors using the more carbon efficient respiration pathways rather than overflow excretion of post-glycolytic products.
12.3 Overflow Metabolism: Design Puzzles
Why do cells excrete glycolytic products, which contain most of food’s potential free energy? The prior section summarized various mechanistic explanations. For example, membrane space may be limited or proteome costs may dominate. Those mechanistic explanations arise from biophysical constraints.
Constraining mechanistic forces determine what is possible and therefore play a necessary role in the study of design. But constraining forces are not sufficient to explain biological design. We must also consider what I have called the design forces.
Design forces determine the relative strength of fitness components, such as rate and yield. Rate is the speed at which cells reproduce. Yield is the total amount of reproduction per unit of food intake. Environmental and demographic factors influence the relative fitness value of growing fast versus growing efficiently.
Constraint forces determine the directions along which design forces can move traits. A crowded membrane surface imposes a tradeoff between the density of glucose transporters and the density of electron transporters. Increasing glucose uptake by adding more transporters often increases growth rate. But the crowding of the membrane with glucose transporters imposes reduced aerobic capacity, lowering yield.
Similarly, when demand for cytosol proteins exceeds space or resources, a proteome constraint imposes a tradeoff between enzymes for catabolism and enzymes for growth. Maximizing growth rate or balancing rate and yield may depend on this mechanistic constraint.
At first glance, the forces of constraint seem most compelling. Limited room on membranes or within the cytosol must impose essential tradeoffs. Experiments that push cells to their limits gain information about those physical constraints. Observed cellular traits may follow along the paths set by the constraints.
Do such studies of constraints solve the puzzles of design? No, for two reasons.
First, constraints are rarely fixed with regard to biological function. For example, glucose uptake may be enhanced by making the membrane more permeable.318 Because space is not the only factor that influences uptake, constraints based solely on membrane surface area can mislead.
Membrane permeability may also affect electron transport efficiency, creating an alternative physical constraint between glucose uptake and aerobic respiration. In general, biological functions may be linked through multiple physical factors.
Experimentally, one can choose to push up against any one of the many physical factors that constrain a pair of traits. One will often see significant consequences because physical constraints impose strong forces. One finds what one looks for.
With regard to design, it is difficult to know which of the constraining forces is most important. Different circumstances push cells up against different limits. Potentially, all of them could be important. But under normal operating conditions, only a few of the limits or maybe none of them imposes strong constraining forces on design.
The second reason that studying constraints by themselves cannot solve puzzles of design is that the forces of design can tune physical constraints. For example, the mechanisms by which membrane permeability varies may allow partial decoupling of glucose uptake from electron transport efficacy. Maybe a partial decoupling of those functions requires extra cost. If it can be done, is it worth it?
The worth depends on the components of fitness affected by the different functions. And the worth depends on how the fundamental forces of design weight those different fitness components.
Maybe the fact that membrane permeability can also influence antibiotic defense is important.318 If so, then the forces of design may have to balance the fitness components associated with sugar uptake, electron transport, and antibiotic defense, subject to various physical constraints.
HOW TO STUDY DESIGN
At this point, the puzzles of design may seem hopelessly complicated. And they are, if one tries to fit a particular explanation to a particular organism.
For example, one will never understand how the forces of design have shaped E. coli by studying a few alternative conditions that push the organism against biophysical constraints. Such experiments are very helpful. But they cannot solve puzzles of design.
Comparative predictions provide the best way to study the tuning of design and the interaction with constraining forces. Chapter 16 presents many comparative predictions for overflow metabolism.
The remainder of this chapter provides additional background for comparative predictions. For example, Section 12.4 discusses laboratory evolution experiments, which push against particular constraints. The evolutionary response reveals whether design follows the hypothesized constraints or other forces override those constraints.
The following subsection considers natural genetic variation, which suggests how organisms adapt to different conditions.
NATURAL VARIATION
The fission yeast Schizosaccharomyces pombe has the capacity for aerobic respiration. That catabolic process typically transforms sugar into carbon dioxide and water. The full cascade consumes essentially all of the usable negative entropy in the initial food input, providing a large free energy gradient to drive metabolism and physical work.
Many natural isolates of S. pombe limit catabolism primarily to the initial glycolytic cascade, in spite of their capacity for full aerobic respiration. The cells excrete glycolytic fermentation products, a form of overflow metabolism.
Kamrad et al.202 studied the balance between glycolytic fermentation and post-glycolytic respiration in S. pombe. Among 161 isolates, 18 strains depended more strongly on respiration, whereas 143 depended primarily on glycolysis.
The rare respiration-dominant strains associated with a low activity variant of the pyruvate kinase gene. Pyruvate sits at a key branch point between glycolytic and post-glycolytic pathways (Fig. 12.2).
The laboratory strain of this species has the low activity variant and respiration-dominant metabolism. When the high activity variant was substituted into the laboratory strain, its metabolism changed to glycolytic-dominant.
A single nucleotide polymorphism determined the low and high activity kinase variants. The strains with increased pyruvate kinase activity had broad transcription and protein expression changes relative to the strains with low activity. Expression levels in the high activity strains associated with enhanced glycolysis, reduced post-glycolytic pathways of respiration, and other biochemical changes.163
Several other genetic variants also influenced the balance between glycolysis and respiration. That genetic variability provides wide scope for the forces of design to tune metabolic processing.
What sort of tuning might be involved? In particular, what fitness components might vary? Kamrad et al.202 studied four fitness components: growth rate, biomass yield, survival, and stress resistance.
The 143 strains with higher pyruvate kinase activity had greater glucose uptake rate and glycolytic flux. The greater glycolytic flux associated with increased growth rate and decreased biomass yield when compared with the 18 strains with lower pyruvate kinase activity and a more respiration-dominant metabolism.
The high activity variants with greater glycolytic flux had a significantly higher survival rate during stationary phase. Survival was measured as the proportion of nondividing cells in stationary phase that divide after adding more food. After 3 days in stationary phase, 25.3% of the high glycolytic variants survived, whereas only 6.5% of the low glycolytic variants survived.
The low activity variants with greater respiration were better at tolerating oxidative stress. Respiration normally produces free radicals that impose oxidative stress.420 Those free radicals may enhance cellular expression of mechanisms to tolerate oxidative stress.
Enhanced tolerance to internally caused oxidative stress may raise tolerance to external sources of oxidative stress. Other species or particular environments can create strong oxidative stress by producing hydrogen peroxide or other free radicals.381
In summary, the common variant with high activity pyruvate kinase had enhanced glycolytic flux, reduced respiration, faster growth rate, lower biomass yield, greater survival under starvation, and lower tolerance of oxidative stress.
Lab conditions are often thought to be especially favorable for high growth rate. However, the lab strain of S. pombe has the low activity variant of pyruvate kinase associated with relatively slower growth.
Lab conditions in this species may impose relatively strong oxidative stress, against which the lab strain’s low activity variant provides better protection than the high activity variant.202 If so, the lab strain is tuned for oxidative stress resistance rather than high growth rate. Whether true or not in this particular case, the possibility that cells tune metabolism to raise tolerance to oxidative stress suggests that assuming growth rate optimization may mislead about the forces of design.
In this example, design cannot be inferred from a single tradeoff imposed by a mechanistic constraint, such as membrane-constrained food uptake versus electron transport. One must also consider how stress resistance and other design forces change the weighting of different fitness components in response to changing environmental conditions.
To reveal the forces of design, one must make comparative predictions about how changing environmental conditions alter traits along the paths allowed by the forces of constraint.
12.4 Evolutionary Timescale
Constraints depend on evolutionary timescale. This section emphasizes laboratory evolution experiments, which analyze a short timescale. To set the context, I first discuss varying timescales in other types of study.
PHYSIOLOGICAL VARIATION
On a zero evolutionary timescale, the physiological response of a particular strain occurs in the context of a fixed genomic regulatory system. Biophysical constraints limit the possible physiological responses.
Basan et al.28 measured the proteome constraint in E. coli (p. 168). As glucose uptake and glycolytic flux rise, their analysis suggested that a cellular limit on total protein favors overflow excretion of glycolytic products rather than an increase in post-glycolytic flux.
Limits on the allocation of proteins to different cellular functions may indicate a general force of constraint that acts on evolutionary design. However, in the absence of an evolutionary comparison, there is no direct evidence that a proteome constraint limits evolutionary change. During an evolutionary response, cell size may change, altering the intensity of the proteome size limit (p. 200). Or other constraints may dominate.
GENETIC VARIATION
On a short evolutionary timescale, natural genetic variation may reveal the forces of design. The evolutionary response associated with observed genetic variation typically remains confined to small changes within the current physiological system.
The prior section summarized genetic variation in natural isolates of S. pombe. The observed genetic variation suggested that varying oxidative stress in different habitats alters the fitness costs and benefits associated with overflow metabolism. In that case, metabolism is shaped by evolutionary forces of design imposed by the environment rather than by an internal constraint such as proteome limitation.
TAXONOMIC VARIATION
On a longer timescale, evolutionary analysis by the classic comparative method contrasts different species, genera, and higher taxonomic groups. The method associates varying environmental challenges with varying organism traits.173
The comparative method also emphasizes correction for shared evolutionary history. Suppose two closely related species of the same genus differ from other organisms. In that case, it is likely that those two species are similar because they inherited the same evolutionary modification rather than separately evolved that modification in response to the same evolutionary challenge.
MICROBIAL METABOLIC DESIGN
My analysis of microbial metabolism emphasizes the shorter timescales. On shorter timescales, one has a better chance to isolate forces and partial causes of design. Longer evolutionary timescales make it increasingly difficult to correct for other causes or to assume that those other causes can be ignored.
Recent advances in lab studies, genomics, and other techniques have opened the study of shorter timescales. The great diversity of microbes and their rapid evolution provide good opportunities to match the scale over which forces act to the scale over which traits change, allowing one to isolate partial causation in the study of design.
EXPERIMENTAL EVOLUTION
Laboratory evolution typically operates on a very short evolutionary timescale. In the lab, one can impose a particular environment and then observe evolutionary change in response to that environment.
The short timescale and strong selective pressure often push cells up against particular physiological constraints. The evolutionary response can provide insight into the interaction between conflicting design and constraint forces.
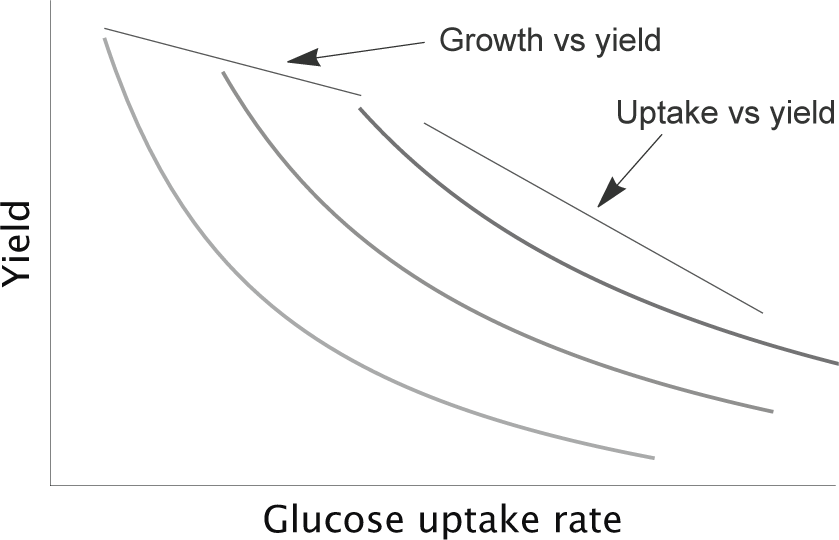
Figure 12.5 Plot of y = μ/q for yield, y, growth rate, μ, and glucose uptake rate, q. The three curves from left to right are for μ = 1, 1.55, 2.1. The value of μ is constant along each curve. Physiological constraints may impose a negative tradeoff between growth rate and the maximum value of yield.
Cheng et al.’s65 recent experimental evolution study of overflow metabolism in E. coli provides an interesting example. Glucose availability and other conditions remained constant. Changes in traits reflect evolutionary response to the constant experimental conditions.
Growth rate increased by approximately 50%, a very strong evolutionary response. Three other variables changed with increased growth rate: glucose uptake rate, acetate excretion rate, and biomass yield.
To interpret the evolutionary response, consider the relations between yield, growth rate, and glucose uptake rate (Fig. 10.1) as
y = μ/q. (12.1)
Here, y is yield in grams of biomass per gram of glucose, μ is growth rate in grams of biomass per unit time, and q is the glucose uptake rate in grams of glucose per unit time. This expression follows from the definitions of the terms and does not require any particular assumptions.
For a given growth rate, μ, the other two variables have the inverse relation shown in Fig. 12.5. The value of μ is the same along each curve. An increase in μ shifts a curve to the right. The negative tradeoff between uptake rate, q, and yield, y, arises from y ∝ 1/q in eqn 12.1.
In Cheng et al.’s65 study, all independently evolved lines significantly increased their growth rates (Fig. 12.6). For similar growth rates, the evolved lines varied widely in their biomass yield (y) and glucose uptake (q) traits. The variability in those two traits followed along the tradeoff curves y ∝ 1/q in Fig. 12.5 imposed by the definition of the variables (fig. 3A of Cheng et al.65).
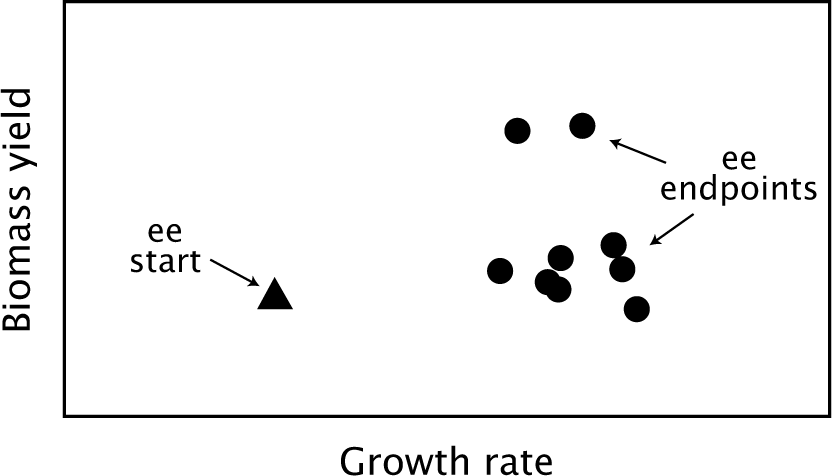
Figure 12.6 Experimental evolution increases growth rate, with biomass yield changing in an apparently neutral and uncorrelated way. When the experimental evolution (ee) starting strain was subjected to natural selection favoring faster growth, the nine independently evolved lines changed to the endpoints. Redrawn from Fig. 1A of Cheng et al.65
In the evolved lines, why do the uptake rate and yield vary so widely for similar growth rates? In these experiments, selection was imposed in a way that limits time for growth rather than limits sugar for growth. Because the imposed design force pushes strongly on biomass produced per unit time (growth rate) and weakly on biomass produced per unit sugar (yield), the yield is effectively a neutral trait.
Under these conditions, an evolutionary change that increases growth rate is favored independently of its consequences for yield. Thus, the various evolved lineages tend to explore alternative physiological mechanisms to achieve the same level of increased growth.
In terms of the evolutionary forces of design, the interesting problem concerns how the environment imposes particular fitness costs and benefits. For example, an experiment that imposed selection on both growth rate and yield would, in theory, favor phenotypes that followed along the upper growth rate versus yield tradeoff line in Fig. 12.5. One could alter the selection intensity on the rate and yield components, potentially favoring movement of the evolved lineages along the rate-yield tradeoff line.
In terms of the forces of constraint, the interesting problem concerns how physiological and biophysical mechanisms impose limits on particular variables and associations between those variables. For example, what mechanisms allow cells to evolve higher growth rates? What mechanisms relate the observed variations in glucose uptake rate to variations in yield for a given growth rate?
This study did not directly measure mechanistic aspects associated with the observed evolutionary changes. Instead, the authors used modeling approaches to analyze plausible mechanistic explanations. For the observed variation in glucose uptake rate and yield, their metabolic modeling suggested a possible role for an NADH–NAD + imbalance, discussed earlier on p. 164.
By that mechanism, the more that cells process post-glycolytic products through the TCA cycle and the electron transport chain, the lower the glucose uptake rate and the higher the yield for a particular growth rate will be. Lower uptake rate also associates with lower post-glycolytic excretion of acetate.
To increase post-glycolytic flux through the TCA cycle and electron transport, cells must relieve the NADH–NAD + imbalance that builds at high growth rate. That imbalance may build because electron transport cannot dissipate the NADH–NAD + disequilibrium fast enough to offset the increasing imbalance produced by the TCA cycle (p. 164).
The metabolic models by Cheng et al.65 suggest that cells may relieve the NADH–NAD + imbalance by switching to alternative, faster, and less efficient electron transport components. For example, Zhuang et al.472 note that three different cytochromes used in electron transport trade off speed versus efficiency. By adjusting the ratios of those cytochromes, cells could adjust the speed versus efficiency of electron transport.
Less efficient electron transport captures less free energy in the ATP–ADP disequilibrium, dissipates the NADH–NAD + disequilibrium faster, and increases flux through electron transport. That increased flux through aerobic respiration lowers acetate excretion, raises yield, and lowers the glucose uptake associated with a particular growth rate.
How should we interpret these details about evolutionary response and physiological mechanisms? I prefer to synthesize the existing facts and current theories into a series of comparative predictions. Those predictions emphasize how environmental changes alter the evolutionary forces of design and the associated weighting of the various fitness components. Those evolutionary forces can tune traits via the particular physiological mechanisms that impose forces of constraint.
Of course, we may misinterpret facts and develop incorrect theories. Then the comparative predictions should fail, exposing the problem.
I develop comparative predictions in Chapter 16. I finish here with one brief prediction. As experimental environments impose stronger selection on improved yield, the evolved lines should converge toward more efficient metabolic pathways associated with lower glucose uptake rate. For example, we may expect a tuning in electron transport, NADH–NAD + imbalance, or other pathways that enhance yield efficiency.
A couple of tentative conclusions follow. First, physiological mechanisms provide much insight into design. But mechanistic constraints can rarely explain design. For example, constraints play different roles in environments that favor high growth independently of yield versus environments that strongly select on yield efficiency.
Second, one can study the forces of design without knowing about physiologically imposed forces of constraint. Environments that favor growth more than yield will tend to produce different traits when compared with environments that favor yield more than growth. That comparative prediction does not depend on mechanism.
Sometimes the multiple overlapping tradeoffs and the complexity of the underlying physiology imply that it is best to start with broad comparative predictions based on the forces of design, ignoring constraints imposed by mechanism.
Ultimately, including constraints and potential evolutionary changes in mechanism will provide more precise predictions and greater insight into design. Chapter 16 develops many comparative predictions.
12.5 Alternative Glycolytic Pathways
Prior sections considered glycolytic design in terms of free energy driving force, proteomic efficiency, ATP production, and membrane permeability. Those attributes affect growth rate and biomass yield per gram of sugar input. Glycolytic and membrane attributes also affect oxidative stress and sensitivity to antibiotics.
This section compares alternative glycolytic pathways.208 The different pathways reflect the forces that shape alternative metabolic designs.
REDOX GRADIENTS AND METABOLIC PRODUCTS
Glycolysis begins by taking up glucose or changing molecules into forms that can be passed into glycolysis. The initial food molecules typically hold electrons relatively weakly. Catabolic processing transfers those weakly held electrons to stronger electron acceptors through a gradient of redox reactions.
The cascade of catabolic steps captures some of food’s negative entropy into various storage systems. Each storage system is a chemical disequilibrium that can be used to drive other reactions. I mention a primary function for each of the three major systems.
The NADH–NAD + disequilibrium drives the ATP–ADP disequilibrium through oxidative phosphorylation (Fig. 12.2). The ATP–ADP disequilibrium powers much of cellular work, including biosynthesis, motive force, and active transport.86 The NADPH–NADP + disequilibrium drives the building of complex molecules and the mitigation of oxidative stress.394,428
We can describe the alternative glycolytic pathways by their negative entropy capture in the three storage systems. We can also describe the pathways by their proteomic cost for catalytic enzymes.
ALTERNATIVE PATHWAYS
The Embden–Meyerhof–Parnas (EMP) pathway occurs in all domains of life. From glucose to pyruvate, the pathway drives the following two reactions to increase the NADH–NAD + and ATP–ADP disequilibria,428
2 NAD+ + 2 H+ + 4 e− → 2 NADH
2 ADP + 2 Pi → 2 ATP.
We say that the pathway produces 2ATP and 2NADH per glucose molecule to describe the increased disequilibria.
The Entner-Doudoroff (ED) pathway occurs in many Bacteria and some Archaea.48,108,208 Among Eukarya the pathway has been described in a few plants, apparently obtained by gene transfer from cyanobacterial ancestors of plastids.64 The ED pathway yields 1NADH, 1ATP, and 1NADPH.
The hexose monophosphate pathway (HMP), also known as the pentose phosphate pathway (PPP), occurs widely across the Bacteria and Eukarya.394 Some Archaea contain parts of the HMP pathway and may use other reactions to achieve similar function.
The HMP pathway produces 2NADPH and also provides molecular precursors for nucleic acids and some amino acids. In most organisms, this pathway drives maintenance, growth, and protection against oxidative stress.394 Pentoses such as xylose, arabinose, and ribose may enter glycolysis through this pathway.208
In summary, the typical disequilibrium productivities for the three major pathways are
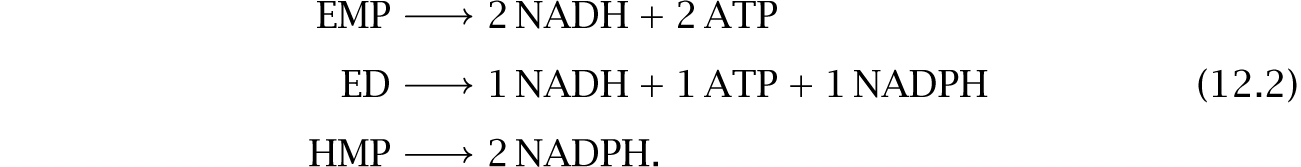
The biochemistry and yield of these pathways vary across prokaryotes.26,48,208
KEY ATTRIBUTES AND FITNESS CONSEQUENCES
This subsection links glycolytic pathways to five components of cellular performance and fitness. The following subsection outlines associated puzzles of metabolic design.
1. Yield.—Equation 12.2 summarizes the standard storage disequilibrium yields for the alternative glycolytic pathways. Cost-benefit analyses in the literature typically consider only ATP.108 However, NADH and NADPH disequilibria also provide benefit through alternative functions.
Different environmental challenges alter the benefits associated with the different disequilibria. How do microbes tune their usage of alternative glycolytic pathways and disequilibria in response to varying environmental challenges? The next subsection considers that question.
2. Driving force and rate.—We can partition into components the total free energy change of coupled reactions in a pathway,
ΔG = ΔGp − ΔGy.
The total change, ΔG, is the maximum potential change, ΔGp, when the pathway does not drive coupled reactions that decrease entropy. The potential change must be discounted by ΔGy, the free energy yield of entropy-decreasing coupled reactions. In glycolysis, the storage disequilibria hold the free energy yield.
The ratio ΔGy/ΔGp describes the yield capture efficiency, the fraction of a pathway’s potential free energy change captured by the storage disequilibria. Four consequences follow.
First, greater yield efficiency reduces the overall driving force, ΔG.
Second, lower driving force reduces the pathway flux rate when holding constant the reaction resistance, caused by factors such as enzyme concentrations. Thus, the yield per input molecule trades off against the rate at which the pathway processes input molecules.
Third, the common method of counting the number of ATP, NADH, and NADPH molecules produced may not accurately reflect the driving force and yield. For example, if the NADH–NAD + disequilibrium is relatively high, then converting another NAD + to NADH consumes more free energy than if the NADH–NAD + disequilibrium is relatively low. Similarly, the potential free energy change through the pathway, ΔGp, depends on the concentrations of the molecules along the reaction sequence.
Fourth, metabolic efficiency can be described as the increase in the storage disequilibria per input molecule (yield efficiency) or the increase in the disequilibria per unit time (rate efficiency).
3. Proteome cost.—Another efficiency aspect concerns the amount of enzyme used to catalyze a pathway. Greater enzyme concentrations lower the resistance of reactions and increase the pathway flux rate. Enzymes impose a protein production cost.
If proteome size is limited, then allocating more protein to glycolytic throughput reduces the amount of protein that can be allocated to other functions. We may consider the yield efficiency per unit proteome cost and the rate efficiency per unit proteome cost.
4. NADPH relieves oxidative stress.—I first review redox biochemistry and oxidative stress. I then turn to the key role of NADPH and its production in the ED and HMP glycolytic pathways.
The driving force for cellular biochemistry comes from moving the weakly held electrons in food to strong electron attractors. The movement of electrons to strong attractors is called oxidation. Oxygen is a common electron attractor in oxidation, but other electron attractors also oxidize molecules.
The flow of electrons toward strong attractors in catabolism increases entropy. Cells couple that increase in entropy to other processes that lower entropy, such as driving storage disequilibria, building organic molecules, or doing physical work. The coupled processes can happen as long as the total entropy increases.
When building molecules or driving storage disequilibria for later use, reactions that enhance negative entropy often move electrons back toward molecules that hold them relatively weakly. Adding electrons to molecules is called reduction because more negatively charged electrons reduce overall charge.
Organic molecules tend to be in a reduced state relative to commonly encountered electron attractors that would oxidize them. Unwanted oxidizing agents impose oxidative stress by pulling electrons away from reduced molecules, which causes damage.396
Oxidation causes a fundamental tension of biochemistry. Moving weakly held electrons from food molecules toward strong electron attractors by oxidation provides the catabolic driving force of life. Moving weakly held electrons from useful molecules to unwanted oxidizing agents destroys life’s ordered molecules.
Cells carefully control oxidizing processes in catabolism. However, unwanted oxidizers are common and very damaging. Cells have antioxidants that can counter oxidative stress.57,396
Oxidative stress often arises from molecules with unpaired electrons, which are highly reactive. The hydroxyl radical, ∙OH, and the superoxide anion, ![]() , are common free radicals in biology. Many other free radicals occur. Free radicals arise spontaneously as products of chemical reactions within cells. Free radicals in the environment enter the cell through the membrane.
, are common free radicals in biology. Many other free radicals occur. Free radicals arise spontaneously as products of chemical reactions within cells. Free radicals in the environment enter the cell through the membrane.
Cells use a variety of antioxidants to control free radicals. Antioxidant processes tend to be reducing, that is, they tend to push electrons toward other molecules to counteract electron-attracting oxidizers. Thus, antioxidation requires a reducing driving force.
Cells often use an NADPH–NADP + disequilibrium to drive antioxidant reducing processes because the reaction
NADPH → NADP+ + H+ + 2 e−
can be coupled with other reactions to push electrons toward molecules.57 Thus, cells must drive the NADPH–NADP + disequilibrium to maintain a store of reducing power for protecting against oxidative stress.385
Returning to glycolysis, the ED glycolytic pathway produces NADPH, whereas the standard EMP pathway does not (eqn 12.2). Oxidative stress may favor the antioxidant power of the ED glycolytic pathway over the EMP pathway.63
Electron transport in oxidative phosphorylation creates free radicals and a strong potential for oxidative damage.42,221 Thus, greater aerobic respiratory flux through electron transport may favor ED over EMP. Alternatively, cells may process a portion of glycolytic flux through HMP/PPP to build the NADPH–NADP + disequilibrium.
5. Membrane transport.—Glycolytic flux depends on food uptake. Faster uptake may associate with greater transport of external oxidative factors into the cell, increasing oxidative stress and favoring ED over EMP.
Two studies provide circumstantial evidence that uptake of sugar may influence the uptake of oxidizing agents.
First, greater nutrient transport alters the uptake rate for various antibiotics.318 Some antibiotics damage cells by oxidation.
Second, particular outer membrane pores of Salmonella lowered their permeability in response to external oxidizing agents.177 Mutants that cannot reduce permeability suffered greater oxidative damage.
Thus, altered nutrient transport may influence membrane permeability, affecting uptake of other molecules and sensitivity to external oxidative stress.
If greater nutrient transport increases sensitivity to external oxidative challenge, then greater glycolytic flux may favor ED over EMP to protect against external oxidative stress.
PUZZLES OF DESIGN
What factors favor one glycolytic pathway over another?
1. Differences in benefits and costs.—The pathways differ in their yields for the three storage disequilibria (eqn 12.2). Each disequilibrium provides a different benefit. Matching disequilibrium production with the associated demand and dissipation rate is likely to be a key challenge.
Greater disequilibrium yield reduces the net free energy change. All else equal, greater yield lowers the driving force and the flux rate.
Oxidative stress favors NADPH production because of its antioxidant properties. Oxidative stress rises with electron transport flux, external oxidative challenge, and greater membrane permeability associated with faster nutrient uptake.
The pathways likely differ in matching glycolytic output to demand from the TCA cycle and aerobic respiration. Similarly, the pathways likely differ in excreting post-glycolytic overflow products.
Excreted glycolytic products can influence growth of neighboring cells, which may be competitive or cooperative.
The pathways provide different anabolic precursors for building organic molecules.
The pathways accept different alternative nutrient molecules and initiating reactions. For example, the HMP pathway takes pentose as a nutrient input.
Proteome cost arises primarily from producing the enzymes to catalyze reactions. More pathway reaction steps increase proteome cost. Lower driving force requires more enzymes and higher proteome cost to achieve the same flux rate.
2. EMP or ED versus HMP.—Kim & Gadd208 state that in E. coli grown on glucose “about 72 percent of the substrate is metabolized through the EMP pathway, and the HMP pathway consumes the remaining 28 percent.” HMP may be used for its NADPH–NADP + disequilibrium or for particular precursors needed for biosynthesis.
The split between EMP and HMP almost certainly varies with growth conditions. How do cells adjust the split between pathways in response to changes in the environment? Which of the many differing costs and benefits dominate under different conditions? How do the forces of design tune the adjustment? How do species vary in this split or in a split between ED and HMP?
Kim & Gadd208 (their section 4.1.3) list alternative steps in the EMP pathway in different bacteria. For example, the standard pathway uses NAD + -dependent glyceraldehyde-3-phosphate dehydrogenase (GAPDH). Streptococcus bovis and other species have an NADP + -dependent variant of GAPDH, which produces NADPH. EMP production of NADPH may be important in species that lack the HMP pathway or other mechanisms to generate NADPH.
3. EMP versus ED.—Flamholz et al.108 inferred from genome sequences whether a species has EMP or ED. In over 500 genomes of Bacteria and Archaea, most species have EMP only, relatively few species have ED only, and some species have both. Aerobes have ED significantly more often than anaerobes (Fig. 12.7).
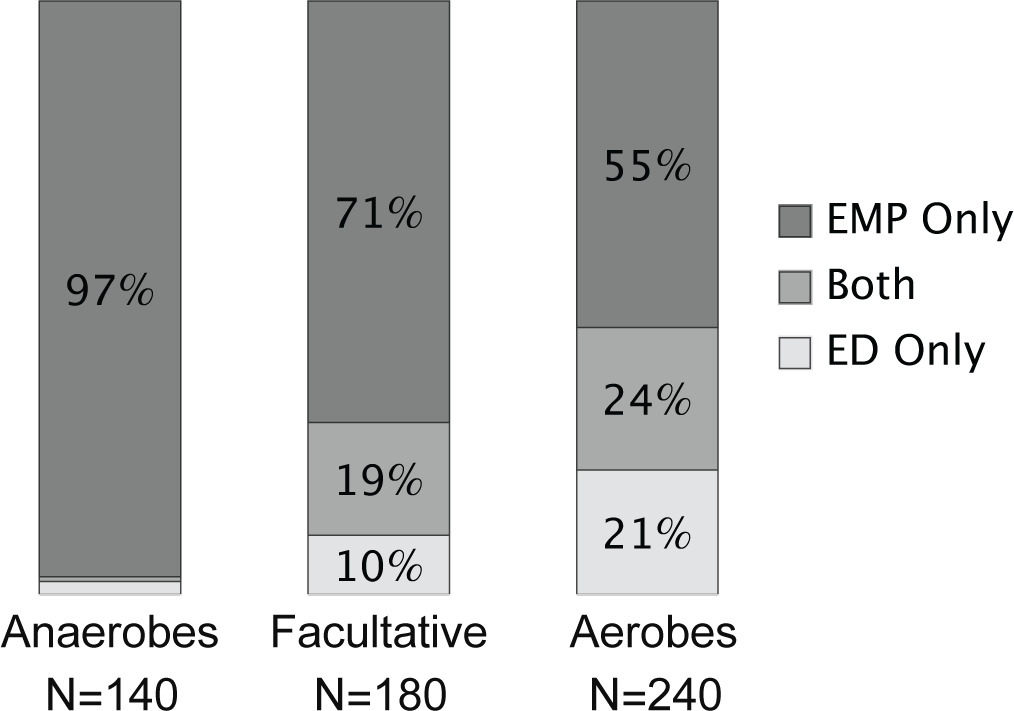
Figure 12.7 Distribution of EMP and ED glycolytic pathways among Bacteria and Archaea. Presence of a pathway was determined by analyzing genomes for the genes in that pathway. Redrawn from Fig. 6 of Flamholz et al.108 It would be interesting to refine the analysis with phylogenetic comparative methods.173
EMP yields two ATP molecules per glucose and ED yields one (eqn 12.2). Thus, EMP has the greater ATP yield per sugar molecule. Anaerobes often rely on glycolysis for ATP production. Flamholz et al.108 suggest that the strong bias of anaerobes for EMP arises from that pathway’s superior ATP yield per unit carbon input.
For aerobes, most ATP comes from post-glycolytic pathways. Thus, aerobes weight the benefit of ATP yield from glycolysis less than do anaerobes. Instead, aerobes may be more strongly influenced by the cost of running the glycolytic pathway.
Flamholz et al.108 suggested that EMP has a higher proteome cost than ED to produce the same post-glycolytic flux. Because EMP has a higher yield than ED, it likely has a lower thermodynamic driving force. The lower the driving force, the more enzyme required to catalyze flux.
Because EMP demands more protein to catalyze flux, the net ATP yield per unit proteome cost may be lower in EMP than in ED. Aerobes may sometimes be more strongly limited by the protein cost of driving glycolysis than by the limited ATP yield of glycolysis because most ATP comes from post-glycolytic pathways. Thus, according to Flamholz et al.,108 ED is more prevalent in aerobes than anaerobes.
Alternatively, Chavarría et al.63 suggest that ED may be favored over EMP in bacteria “to gear their aerobic metabolism to endure oxidative-related insults.” They show that the greater NADPH production of ED provides the aerobe Pseudomonas putida with better tolerance to oxidative challenge by diamide and hydrogen peroxide.
Aerobic prokaryotes may face greater oxidative stress than anaerobes because electron transport produces free radicals.42,221 Excess oxidative challenge for aerobes may partly explain their use of ED over EMP.
Both proteome efficiency and oxidative tolerance provide reasonable hypotheses. One could probably come up with other plausible alternatives to fit the observed pattern.256 However, only comparative hypotheses and tests can reveal the forces of design and the forces of constraint.
4. ED lost from eukaryotes except in some plants.—The environmental challenges and natural history of aerobic yeast are similar to many aerobic prokaryotes. Why do aerobic yeast lack the ED pathway, whereas aerobic prokaryotes often have that pathway?
Perhaps the presence of mitochondria in eukaryotes explains the difference. Mitochondria confine the free radicals produced by aerobic metabolism. Processes that detoxify mitochondrial oxidative stress are separated from the cytosol, where glycolysis occurs. Thus, the antioxidant benefits of the ED pathway may provide more value to prokaryotes than they would to eukaryotes.
Currently, all eukaryotes are thought to lack the ED pathway except some plants.64 If mitochondria and the associated processes of intracellular oxidative stress and tolerance explain the loss of the ED pathway in most eukaryotes, then why do some plants have that pathway?
Chen et al.64 suggest that plants are typically not carbon limited because they produce their own carbohydrates by photosynthesis. Thus, greater proteomic efficiency may be more important for some plants than efficiency in ATP yield per food input, which could favor the ED pathway over the EMP pathway.108
Alternatively, some plants may suffer particularly strong oxidative stress77 that requires the additional antioxidant power of the ED pathway. The puzzle remains unsolved.
In summary, the different pathways influence several costs and benefits. A focus only on yield maximization, or proteome cost minimization, or another particular dimension may miss important factors. As always, it is difficult to explain any particular aspect of design by itself because many forces may be acting simultaneously.
Comparative hypotheses focus on how a changed environment alters particular costs and benefits. Comparison isolates partial causation and reduces interference by other simultaneously acting forces.
Before I develop broad comparative hypotheses about metabolic design, it is helpful to review additional facts of metabolism. The next chapter turns to the modulation of resistance in metabolic reactions.