14
Variant Pathways
Catabolic pathways create disequilibria to drive other processes. Catabolic digestion also makes precursors to build molecules. Many catabolic functions can be achieved by alternative pathways. What forces shape variant pathways?
This chapter’s biochemical descriptions provide background. That background sets the stage for linking variant pathways to fitness components, such as growth rate, biomass yield, and performance under varying conditions. Changed environments alter fitness components, leading to comparative predictions about design.
The first section reviews alternative glycolytic pathways. Those pathways differ in their required enzymes, net driving force, precursors for anabolic processes, and amounts of ATP, NADH, and NADPH produced. Those variations provide an opportunity to analyze the forces of design that favor one pathway over another.
The second section lists alternative final electron acceptors. A catabolic cascade transfers weakly held electrons in food to relatively strong electron acceptor molecules, such as oxygen or metal ions. The final electron acceptor of a cascade influences the overall thermodynamic force available to drive other processes.
The third section considers weak driving force gradients between the initial food input and the final electron acceptor. Weak gradients pose design challenges because of the low available driving force and the high potential for product inhibition.
Microbes living on weak gradients process a variety of input molecules as food, use a variety of final electron acceptors, and make diverse products that other microbes can often consume. For example, the electrons of hydrogen gas may flow to carbon dioxide, creating methane on which other microbes feed. The biochemical variety of weak gradients plays a key role in the geochemical cycles of free energy flow and in the ecological interactions of biological communities.
The fourth section describes the flow of electrons between species. Indirect flow may occur when one species excretes a catabolic product that could build up nearby, creating product inhibition and stopping catabolic flux. A second species relieves the first species’ product inhibition by feeding on that species’ output. Electrons flow through a free energy gradient between species, following a distributed catabolic pathway.
Direct flow occurs when one cell transfers electrons to another cell. A donor species may pass electrons to a different species that acts as the first species’ final electron acceptor. Alternatively, a species may transfer electrons between its cells. In that case, the receiving cell has access to a stronger final electron acceptor than the donor cell, creating a distributed electron flux gradient between cells.
The fifth section reviews alternative pathways within a single cell that process different carbon sources for food input. Variant mechanisms to shift between food sources influence fitness components in different ways, providing a good opportunity for comparative study.
The sixth section briefly summarizes cellular shifts between complex carbohydrate food sources. The great molecular diversity and highly specific enzymatic digestion of complex carbohydrates create special design challenges to cope with the vast biochemical diversity.
The final section synthesizes puzzles of design for the variant pathways. Those puzzles form the basis for future study. Progress requires explicit comparative hypotheses and empirical tests.
14.1 Glycolytic Yield
I previously described the three common alternative glycolytic pathways on p. 180. The typical storage disequilibrium yields per glucose molecule for those pathways, from eqn 12.2, are

For EMP, the 2ATP yield describes the common and most widely observed pattern for that pathway. Describing pathways by their typical ATP yields oversimplifies but does provide a useful starting point in the search for potentially interesting patterns and hypotheses.
For example, variant EMP pathways exist that yield more ATP. In the cellulose digesting bacteria Clostridium thermocellum and C. cellulolyticum, their EMP pathways have much lower thermodynamic driving force than the typical EMP reactions.193,310
Associated with low driving force and slow catabolic rate, Park et al.310 inferred an EMP yield of 3ATP per glucose in C. cellulolyticum, 1 more than the standard 2ATP for EMP.
Digesting cellulose into glucose may happen slowly, constraining the rate at which cells can take up sugar.193,310 When uptake rate is slow, high thermodynamic driving force and the potential for rapid flux provide no benefit. Instead, greater benefit accrues for increased free energy extraction efficiency per glucose molecule, which requires reduced net thermodynamic driving force for the pathway.
The ATP–ADP disequilibrium is smaller in C. thermocellum than in E. coli.193 This cellulose digesting species apparently has a relatively lower rate of negative entropy uptake and a slower rate of negative entropy capture in the ATP–ADP disequilibrium.
The smaller negative entropy store in the ATP–ADP disequilibrium provides less driving force for growth and other cellular processes. The smaller ATP–ADP disequilibrium also suggests that each ATP generated requires less free energy because the free energy required to make an ATP increases with the disequilibrium, a fundamental thermodynamic fact that is frequently ignored.294
A smaller disequilibrium can provide a mechanism to enhance the ATP yield per glucose molecule. The same mechanism applies to any disequilibrium created as part of the catabolic yield.
Matching the slow rate of cellulose digestion to the reduced glycolytic driving force and higher ATP yield is intuitively appealing. However, several plausible tradeoffs suggest that understanding metabolic design requires more careful thought and tests (p. 223).
14.2 Final Electron Acceptors
Catabolic cascades move weakly held electrons in food to relatively strong electron acceptors. The final electron acceptor influences the total free energy between a particular food molecule and the end of the catabolic cascade.
Stronger final electron acceptors increase the total free energy change. The greater that change, the more free energy there is to be captured in the storage disequilibria to enhance yield or to be dissipated to increase flux and catabolic rate.
Weak final electron acceptors lower the total free energy change. A smaller driving force often associates with reactions that are close to equilibrium, which increases the risk that an intermediate product accumulates and stops or reverses flux.467,468 Low driving force also makes it more challenging to capture free energy in the storage disequilibria.
I mention a few alternative electron acceptors and associated pathways.208 In aerobic respiration, oxygen provides a strong final electron acceptor, creating a large free energy gradient from glucose to its final oxidized products. That large gradient allows capturing much free energy in the ATP–ADP disequilibrium, primarily by oxidative phosphorylation through electron transport and proton motive force.
In anaerobic respiration, final electron acceptors other than oxygen terminate electron transport chain phosphorylation. Typically, the driving force in the final catabolic steps comes from an electrochemical gradient across a membrane, associated with electron flow and proton motive force.
The final electron acceptors may, for example, be metal ions or oxidized nitrogen, which can provide strong free energy gradients.208 However, those final acceptors attract electrons less strongly than oxygen.
Archaeal methanogens use carbon dioxide as an electron acceptor to produce methane. Bacterial and archaeal sulfidogens use sulfate or elemental sulfur as the final electron acceptor. Methanogens and sulfidogens take up a variety of electron donors as food. The total free energy gradient from electron donor to acceptor is often relatively small.
In anaerobic fermentation, typically a few post-glycolytic reactions lead to the final electron acceptor, producing lactate, acetate, ethanol, or similar molecules. The free energy gradient is often small from the food electron donor to the final electron acceptor and fermentation products.
14.3 Weak Redox Gradients
Small free energy gradients relative to the demand for metabolic flux impose strong tradeoffs. Increasing flux risks thermodynamic inhibition, in which the greater concentration of reaction products at any step along a cascade may reduce or reverse flux.
Excretion of excess reaction products may relieve thermodynamic inhibition. The overflow discards potentially usable negative entropy.
Extracting free energy yield into molecular stores of disequilibrium reduces the already limited free energy potential to drive flux, further slowing the potential flux rate.
These tradeoffs suggest how the forces of design and constraint may shape metabolic traits. I briefly mention a few theories and observations.
THEORIES
Catabolic pathways with low driving force tend to operate near equilibrium. If a bit of excess final product accumulates, the pathway may suffer thermodynamic inhibition.
The final product typically arises when the catabolic flow of electrons reduces the final electron acceptor. Three alternative designs mitigate the flux inhibition caused by the accumulating final product.
First, different microbes may catabolize the same food source to alternative electron acceptors and final products. Splitting the common food source between different pathways lowers the flux of each pathway. Lower flux reduces the concentration buildup of any particular final product, partially relieving product inhibition.161
Second, a single microbe may catabolize the resource through a branching pathway that ends with multiple distinct electron acceptors. A branching pathway reduces the flux into each final electron acceptor, lowering the rate at which the various final products accumulate.467 Mixed-acid fermentation and similar architectures may be examples.26,208
Third, a primary microbe may catabolize the initial food source to a particular final product. A secondary microbe may then feed on the primary microbe’s catabolic product, lowering the concentration of that primary product. The second microbe becomes the electron sink for the first microbe, relieving the thermodynamic inhibition of the primary catabolic pathway.162,357
In summary, a limited free energy gradient is particularly sensitive to concentration changes in product outputs and food inputs that alter the driving force. Limited gradients may also impose strong tradeoffs between growth rate, ATP yield, and biomass yield. Those factors influence the architecture of catabolic pathways.
OBSERVATIONS
Methanogens typically have a small catabolic free energy gradient. Archaeal methanogen clades differ broadly in catabolic pathway architecture. Those architectural differences correlate with rate, yield, and sensitivity to concentrations.407
The most recent clade, Methanosarcinales, uses cytochromes and electron transport across the membrane to drive ATP production. The other clades do not have cytochromes. Thauer et al.407 summarize the broad differences between clades when the overall anaerobic catabolic reaction is
4 H2 + CO2 → CH4 + 2H2O. (14.1)
H2 is the electron donor food source that reduces the electron acceptor CO2 to produce methane and water.
The cytochrome group relative to the cytochrome-free group typically requires higher H2 concentration (partial pressure), produces higher ATP and biomass yield per H2 input, and grows more slowly. Most likely, by transferring more free energy per H2 input into the ATP–ADP disequilibrium, this group has a lower net free energy gradient to drive the catabolic throughput and growth rate.
In natural environments with H2, the cytochrome-free group dominates, perhaps because it requires lower H2 partial pressure and can grow faster at a given H2 level.407
Dominance by the cytochrome-free group in H2 environments probably explains why, in natural habitats, the cytochrome group mostly grows on acetate, methanol, and methylamines. Those other electron donors may provide less free energy than H2, consistent with the idea that the cytochrome group is more efficient and can exploit weaker negative entropy sources than the less efficient cytochrome-free group.
The glycolytic pathways discussed earlier provide additional examples of weak redox gradients and their consequences.26,310
14.4 Electron Flow between Cells
In oxic environments, oxygen provides the strong final electron acceptor for catabolism. If one organism overflows intermediate products, another takes up those products to complete oxidation.
Many external food molecules can be the initial electron donor. The final oxygen electron acceptor creates a large redox gradient. If the full redox gradient is separated between organisms, the sequential redox gradients are typically sufficiently strong to proceed without requiring coordination between species.
In anoxic environments, final electron acceptors are often much weaker, lowering the maximum redox gradient that can be achieved. To maintain the weak redox gradient, organisms need a steady supply of the final electron sink to accept the outflow of electrons at the end of catabolism. The need to find a final electron sink may become as great as the need to find food, the initial electron donor.
BACTERIA-METHANOGEN SYNTROPHY
A weak redox gradient is particularly susceptible to product inhibition. For example, in bacteria that pass electrons to hydrogen and release H2, hydrogen product buildup near the cells reverses the free energy gradient, stopping catabolism.
Such bacteria require some mechanism to pull outflowing electrons away from the cells, creating a strong electron sink.251,252,265,273
Many bacteria in anoxic environments form syntrophic relations with archaeal methanogens.273 The bacteria degrade various organic and other high free energy electron donors into products that retain much of the free energy, such as hydrogen, acetate, and formate (Fig. 14.1).
Nearby methanogens digest those intermediate products to methane, pulling the electrons in those intermediate products away from the bacteria and allowing the bacteria to maintain their catabolic flux. The distributed electron flux across species flows down a large free energy gradient without intermediate product bottlenecks.
For example, some syntrophic bacteria oxidize propionate to make acetate and H2 as214

Net flux goes in the forward direction only when the concentration of H2 remains low. Steady forward flux requires some process to remove H2. In this case, archaeal methanogens can grow by scavenging the hydrogen to make methane,

lowering H2 concentration sufficiently to maintain forward thermodynamic driving force for the coupled system.
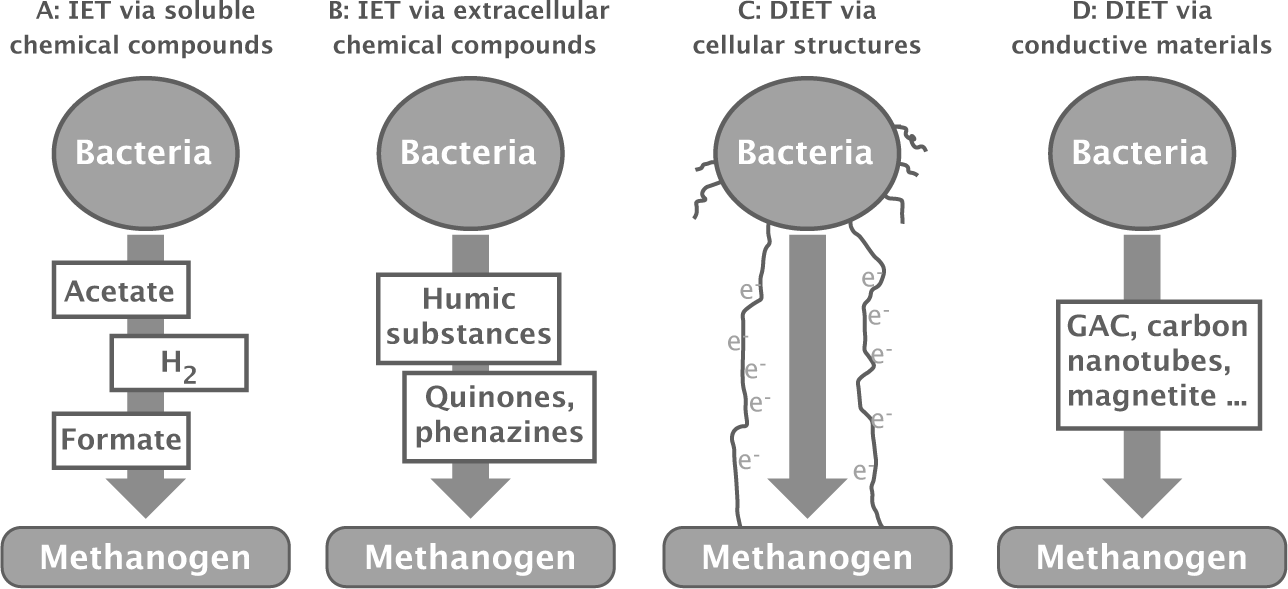
Figure 14.1 Electron flow pathways from bacteria to archaeal methanogens. The methanogens use the incoming electrons plus sources of protons and carbon to make methane, as in eqn 14.1. (a) Interspecies electron transfer (IET) may happen by passing bacterial metabolic products, such as H2. (b) Humic conducting materials in contact with both donors and recipients can transfer electrons. Extracellular organic electron shuttles, such as phenazines, may also transfer electrons between species. (c) Direct interspecies electron transfer (DIET) may happen by physical contact between cells through wire-like conducting pili or electron-transferring cytochromes in the membranes. (d) DIET via inorganic conductors. These pathways may also transfer electrons to inorganic electron acceptors, such as ferric iron. Redrawn from Fig. 1 of Martins et al.265
DIRECT ELECTRON TRANSFER BETWEEN SPECIES
A direct electron conduit between species may happen by a variety of mechanisms251,252 (Fig. 14.1). For example, bacterial species of Geobacter can donate electrons via pili that act as conducting wires.
In the lab, the methanogen Methanosaeta harundinacea accepts electrons by direct contact with G. metallireducens, using those incoming electrons as their food to reduce carbon dioxide to methane.347 In this syntrophy, electrons flow from ethanol input to methane output through a two-species catabolic pathway connected by electric pili.
Electrically conductive biofilms composed of complex multispecies communities often form on electrodes.228,261 Apparently, many microbial species can function in long-range electron transport. In addition to electrically conductive pili, membrane-based cytochromes also seem to be important in electron flow.184,252
CABLE BACTERIA
Organisms in anoxic zones can significantly increase their catabolic redox gradient by connecting their electron flux to oxic environments. For example, cable bacteria in anoxic sediment donate electrons by hydrolyzing hydrogen sulfide,151,152,210,368

The cable bacteria pass an electric current through a contiguous filament of cells that contain nickel-protein conducting wires.45 The cellular filament terminates in an oxic zone that may be a centimeter or more away from the anoxic origin. At the oxic zone, the cable bacteria pass the incoming electron flux to oxygen to form water,
2O2 + 8H+ + 8e− → 4H2O, (14.3)
obtaining protons by the balancing flux of ions outside the cable.296
Cells in the oxic zone have little anabolic activity.151 The physiology of the cells in the oxic zone may be designed for speed of electron flux, acting solely as a wire to conduct electrons to a strong electron acceptor. The terminal transmission of electrons in the oxic zone maintains a strong electron flux and free energy gradient in the anoxic zone, where cells exploit that gradient to enhance reproduction.
Why do oxic cells provide electron flux services for anoxic cells without themselves gaining direct benefit or reproducing? I return to that puzzle below (p. 225). A later chapter discusses additional puzzles of cable bacteria design (p. 302).
14.5 Alternative Carbon Sources
A microbe exposed to multiple carbon sources typically follows a repeatable preference hierarchy of food consumption. Alternative carbon sources may fuel different growth rates, yield efficiencies, and precursor supplies for anabolic processes.
How do changing forces of constraint and design alter the preference hierarchy for alternative carbon sources? What determines the point at which microbes switch usage from one source to another? When does it pay to utilize multiple sources simultaneously? This section provides background for these questions of design.
DIAUXIC SHIFT
A microbe often uses up a preferred carbon source before shifting to use a less preferred source. A growth lag occurs during the diauxic shift between carbon sources.380
In the classic theory, the growth lag arises because the proteins used to digest the second source are repressed by the presence of the first source. Depleting the first source relieves the repression of proteins for the second source. It takes time to build up the second-source proteins.
I start with some details supporting this classic description. I then summarize recent studies that show two complexities in the switching between carbon sources.
First, individuals of a particular genotype may differ in their sugar usage and regulatory control. The classic diauxic shift pattern focuses on the aggregate population, ignoring the underlying individual variability. Second, genotypes may differ in regulatory control.
Variability within and between genotypes suggests that heterogeneous forces of design may shape the pattern of food usage.
Classic studies.—E. coli can grow on a mixture of glucose and lactose. At first, the population consumes glucose and expands exponentially. The glucose is eventually depleted. A growth lag follows. After a while, the bacteria resume exponential growth while consuming lactose.380
Mechanistically, feeding on glucose represses the lac operon and the production of the proteins required to feed on lactose. Depleting glucose relieves the lac operon repression. The growth lag during the diauxic shift from glucose to lactose may arise because of the time required to build up concentrations of the lactose-specific catabolic proteins.380
Erickson et al.97 argued that total proteome size imposes a strong limiting constraint. In their model, the greatest growth rate arises by broad regulatory remodeling of protein expression when switching between carbon sources. Mixed simultaneous usage tends to be inefficient because of the large number of distinct proteins required for each source.
Several experiments on E. coli supported their model of shifting proteome allocation in response to changing availability of alternative sugar sources. Significant growth lags occurred during the proteome expression shifts.
The budding yeast Saccharomyces cerevisiae follows an interesting variant of the diauxic shift.49 When provided with glucose in an oxygenated environment, the cells often glycolytically ferment the sugar to produce ethanol. Fermentation typically causes faster, lower yield growth compared with full aerobic respiration.
When most of the glucose is used up, the yeast switch to feeding on the ethanol by the slower and more efficient process of aerobic respiration. The diauxic shift from glucose to ethanol associates with the typical growth lag phase, relieves the previous glucose-induced repression of the aerobic pathways, and builds the concentration of the aerobic-associated proteins.
Yeast425 and bacteria typically prefer glucose over sugars such as lactose, maltose, or galactose, following diauxic consumption patterns.
Variability within clones.—Those classic studies measured the aggregate consumption of populations. The implicit assumption was that all cells followed the same regulatory shifts and changes in protein expression. Recently, several studies measured the gene expression patterns within individual cells380 in the bacterium Lactococcus lactis and the yeast S. cerevisiae.292,389,425,437
Lactococcus lactis follows a classic diauxic growth pattern on a mixture of glucose and cellobiose.389 After glucose is consumed, a diauxic lag phase occurs during which there is essentially no growth, followed by consumption of cellobiose. By measuring single-cell gene expression, the authors show that only a fraction of the population switches from glucose to cellobiose consumption. The remainder does not switch and stops dividing because no glucose remains.
The higher the initial glucose concentration, the smaller the fraction of cells that switch to cellobiose after glucose is depleted. A smaller fraction of active cells on cellobiose causes a longer growth lag phase during the diauxic shift.
After the depletion of glucose and the shift to cellobiose, populations consist of some cells feeding on cellobiose and other cells in a nonfeeding and glucose-activated state. The more cellobiose-activated cells, the faster the population growth rate on cellobiose but the lower the initial growth rate if the population encounters additional glucose.
Retaining a fraction of the glucose-activated cells after glucose depletion may be a form of bet-hedging.159,389 Because the amount of further glucose is unpredictable, fitness may be increased by a regulatory strategy that does reasonably well under a variety of future glucose encounter rates.
A lab strain of S. cerevisiae also expresses varying patterns of cellular heterogeneity in response to varying initial concentrations of glucose and galactose.425 High initial glucose concentration represses the galactose pathway. Slow diauxic shift to galactose consumption follows after depletion of glucose. By contrast, low initial glucose mixed with some galactose causes all cells to induce the galactose pathway quickly.
Various intermediate initial combinations of the sugars split the population into a bimodal expression pattern. One group induces the galactose pathway before glucose is depleted, whereas the other group does not induce galactose utilization until after depletion of glucose.
With bimodal expression, the population shifts more quickly to galactose consumption after glucose depletion. The faster shift associates with a shorter growth lag. Bimodal expression may perform best when environmental sugar mixtures vary unpredictably.
Variability among genotypes.—The prior studies suggest that unpredictability favors cellular variability within clones. If so, then one might expect strains in different habitats to experience different patterns of sugar resource unpredictability and thus be tuned differently with regard to the expression of cellular variability.
Two studies of diverse S. cerevisiae strains support the idea of alternative regulatory tuning by genotypes.380 New et al.292 exposed strains to low glucose and high maltose. Some strains follow the classic diauxic shift pattern, first consuming glucose and then, after a lag, growing on maltose. Other strains follow the same glucose then maltose consumption pattern but do not have a growth lag during the shift.
Longer lag associates with faster initial growth on glucose. Shorter lag outcompetes longer lag when glucose and maltose availability alternate.
New et al.292 suggest that short lags are a generalist strategy, gaining an advantage across different environments but, in a glucose-dominated environment, losing to the specialist strategy that maximizes growth on glucose. Isolates may vary in their genetic tendency to lag because, in nature, habitats differ in their sugar heterogeneity.
Wang et al.437 found similar diversity in the lag between glucose and galactose usage among a wider set of S. cerevisiae strains. They directly measured the expression of galactose pathway genes. When consuming glucose, strains with long lag fully repress the galactose pathway. Strains with short lag induced the galactose pathway and began consuming galactose before glucose was fully consumed.
The shorter the lag after glucose consumption, the greater the expression level of galactose during glucose usage and the lower the growth rate during the glucose consumption period.
In other words, early expression of the galactose pathway is costly, reducing growth on glucose. Rapid adjustment between sugar sources reduces growth rate on the preferred sugar. Once again, more heterogeneous environments may favor a broader generalist response rather than a fast growth, specialist response.
What is fitness?—The explanations of diauxic regulatory variability assume that growth rate is the primary design attribute. For microbes such as S. cerevisiae grown in sugar-rich lab environments, growth rate may be the most important fitness component.
The regulatory control of feeding in other microbes may be dominated by different fitness components. Thus, it is useful to consider how other forces of design may lead to the same observed pattern of diversity.
For example, longer lags may associate with less simultaneous expression of different pathway proteins, greater efficiency, and greater total yield over the sequential consumption of a fixed amount of alternative sugars. Different environmental and demographic conditions change the relative fitness valuation of growth rate and yield (Section 17.1).
Early galactose pathway expression may induce competition for membrane space between alternative sugar transporters. The simultaneous expression of alternative transporters can provide additional targets for attack by bacteriophage and by antibacterial toxins.

Figure 14.2 Sugar hierarchy of growth rate and gene expression in E. coli. Each box shows the promoter activity level associated with sugar 1 (row) when paired with sugar 2 (column). Diagonal elements correspond to single sugar treatments. From Fig. 1 of Aidelberg et al.4
Overall, growth rate typically sets the primary challenge in the lab. Nature poses a broader set of challenges.
SUGAR USAGE HIERARCHY
Studies can infer a microbe’s sugar preference hierarchy by analyzing different sugar pairs. For example, Fig. 14.2 shows that E. coli prefers sugars associated with higher growth rates over those associated with lower growth rates.4,11 Individual sugars presented alone induce other pathways at low and variable levels (Fig. 14.3).
Figures 14.2 and 14.3 summarize aggregate expression levels in populations. Detailed studies show that cells vary in their expression levels,33,212 as described in the previous subsection.

Figure 14.3 Single sugars stimulate limited expression of other sugar promoters. The column defines the sugar present. Variable shading of rows describes the expression level of other sugar promoters. From Fig. 2 of Aidelberg et al.4
ALTERNATIVE EXPLANATIONS AND THE NEED FOR COMPARISON
Pathways for nonpreferred or absent sugars are often partly induced. Induction happens in both pairwise and single-sugar measurements. Do those induction patterns reflect designs to increase fitness?4
For example, in pairwise sugar environments, it could be that simultaneous consumption maximizes growth rate. In single sugar environments, it could be that inducing pathways for absent sugars reduces growth lag if those absent sugars became available.
Alternatively, forces of design other than growth rate may dominate. Yield efficiency may be favored. Or the forces of design may vary over time and space, so that the observed traits at any point reflect complex evolutionary dynamics.
Or it could be that forces of constraint dominate. Limited proteome size may constrain the environmental sensors and transcription factors that can be used to tune expression of alternative pathways in response to environmental conditions.
Or other evolutionary forces such as mutation or drift may work against natural selection. If variant designs differ in fitness only by a small amount, then natural selection may not be able to tune design to the very best trait values.
The literature tends to emphasize consistent explanations of design rather than testable hypotheses of design. For example, the bet-hedging idea is consistent with some of the observed mixtures of sugar pathway induction patterns. But how would we know if that is the right explanation? How can we decide whether that explanation is better than many other possible explanations?
Comparative hypotheses provide the only approach to studying design. Section 17.1 develops comparative hypotheses for multiple food source usage. Before developing those comparative hypotheses, we need to have a good understanding of the observed patterns of metabolism that we wish to understand, the topic of this background chapter.
14.6 Hierarchical Usage of Complex Carbohydrates
Some microbes can break down large carbohydrates into sugars or other small molecules. Canonical metabolic pathways then process those small molecules.
Large carbohydrates are complex and diverse. Each type requires its own specific enzymes. Species vary in their hierarchical preferences for different carbohydrate forms.137,160,332
To cope with that molecular diversity, Bacteroidetes genomes have many polysaccharide utilization loci (PULs) to acquire and digest complex carbohydrates. Each PUL comprises multiple co-regulated genes.
Among Bacteroides thetaiotaomicron, B. ovatus, and B. cellulosilyticus WH2, each has approximately 100 PULs. The set of PULs differs significantly between species pairs.160 Bacteroides thetaiotaomicron and B. ovatus devote approximately 18% of their genomes to PULs.263 Other groups seem to have smaller repertoires.374
Why do species vary in the number of alternative pathways they encode? Why is there variation in hierarchical preferences? How do the forces of design shape the molecular regulatory mechanisms that control hierarchical feeding preferences?
The complex food molecules are often too large to be taken up directly. Instead, they must first be broken down externally. Exodigestion may be accomplished by secreting enzymes or by binding food sources at the cell surface and digesting the bound molecules. Surface digestion often associates with significant loss of the digested products before the cell can take them up.339
External digestion leads to public goods problems. Cells accomplishing the external digestion pay the cost for the digestion process, but the digested products are often available for neighboring cells to use. What environmental aspects favor cooperative exodigestion?
Digestion requires a sequence of steps. What situations favor different species to share in the multiple steps of distributed metabolism?
The broader forces of design inevitably modulate hierarchical preferences and exodigestion. Tradeoffs between growth rate, yield, and other fitness components must shape the biochemistry of pathways, the flux through pathways, and the regulatory controls of metabolism.
14.7 Puzzles of Design
Catabolic pathways vary because they must connect different food sources to alternative final electron acceptors. The free energy change between food inputs and electron acceptor outputs can also shape pathway design. Free energy gradients constrain flux through pathways and the amount of free energy that can be captured by the storage disequilibria.
Within those biochemical and free energy constraints, the forces of design alter pathway architecture and the tuning of flux within pathways.
Most of the literature emphasizes growth rate maximization as the primary force of design that shapes metabolic pathways.27 Some articles also consider yield maximization, either as ATP production or biomass production per unit of food input.317
Rate and yield are primary fitness components. Most rate or yield explanations of design that arise from an empirical study express a consistent explanation with the data observed in that particular study.
Consistency is important. But it is also weak. Instead, we ultimately need to consider how environmental and demographic changes alter various fitness components and forces of design. And then, how do changing forces of design alter metabolic traits?
To start, it is useful to describe the puzzles of design that arise from observed patterns. A few examples follow.
PREFERENCE HIERARCHY
Microbes tend to consume available carbohydrates in a preferred order. Figure 14.2 shows E. coli’s preference for sugars other than glucose, the most preferred food. Higher preference corresponds to faster growth.
Human gut microbes also tend to prefer some complex carbohydrates over others. Species differ in their preference rankings.
What explains the observed preference hierarchies within species and the differences between species? Growth rate and yield are always likely candidates for strong forces of design. However, other fitness components may tune the regulatory mechanisms that control hierarchical pathway expression.
Interestingly, the way in which cells repress or jointly express alternative pathways varies within a species.292,380,389,425,437 Temporal correlations in the availability of various foods may influence those regulatory tunings.
For example, the waiting time distribution between the consumption of a sugar and the appearance of more sugar may be important. Short wait times may favor continuously expressing the associated pathway. Long wait times may favor shutting down and then expressing again upon new stimulation. Broader temporal correlations between multiple food sources would likely have broader consequences for pathway regulation.
What fitness components most strongly influence the tuning of pathway regulation? Perhaps growth or yield. Maybe survival during periods of starvation. Or the ability to grow relative to other genotypes rather than the absolute growth rate itself.
Or, given that microbes often appear to devote much to warfare against each other,148 perhaps attack and defense strongly shape traits. If additional free energy goes to warfare traits, then better food sources may leave growth rate or yield unchanged and instead alter success in battle.
For complex carbohydrates, initial exodigestion sometimes breaks food molecules into pieces that become available to neighbors. If so, then the value of favoring some carbohydrates over others may depend as much on the local community composition of microbes as on a cell’s own internal regulation of preferences.
FLUX TUNING WITHIN PATHWAYS
Preference hierarchy concerns the regulatory tuning that controls which pathways are expressed. We may also consider the forces that tune metabolic flux within particular pathways.
For example, the EMP glycolytic pathway typically yields 2ATP per glucose molecule. Park et al.310 inferred a yield of 3ATP per glucose in the cellulose digesting bacterium Clostridium cellulolyticum. Why does this species alter its glycolytic flux tuning to yield an additional ATP?
Cellulose breakdown may occur slowly, limiting the rate of glucose influx.193,310 If a cell cannot increase flux and growth rate, then it may gain by reducing the net free energy driving force to match the flux limitation. Lower driving force can be achieved by devoting more of the total free energy gradient to ATP production.
At first glance, the match between slow influx, slow growth, and high yield makes sense (p. 207). And it may be so. However, several possible tradeoffs could alter tuning.
Making more glycoside hydrolase could potentially increase cellulose breakdown and glucose flow rate. Making more surface transporters could potentially increase glucose uptake rate. Greater uptake rate could potentially favor greater glycolytic driving force, increased growth rate, and reduced yield. The association between cellulose digestion and ATP yield may also depend on environmental and demographic factors.
In other words, one achieves only a limited approach to understanding design by intuitively matching difficult digestion to slow growth and high yield. We need comparative predictions and tests.
Other puzzles of pathway tuning arose in earlier sections. In overflow metabolism, what determines the balance between overflow excretion of fermentation products and full processing through oxidative phosphorylation (Section 12.2)? In futile biochemical cycles, what forces tune the dissipation of disequilibria and the generation of excess heat (p. 167)? In oxidative phosphorylation, what tunes the balance between ATP-generating efficiency and flux rate (p. 178)?
PATHWAY ARCHITECTURE
For a given food input, differences in the final electron acceptor and total free energy gradient may associate with broad pathway differences. An obvious distinction occurs between anaerobic and aerobic pathways. The much larger free energy gradient when using oxygen as the final electron acceptor associates with many additional biochemical steps in the TCA cycle and oxidative phosphorylation.
Small total free energy gradients may diversify pathway architectures. With a limited total gradient, slight variations in flux can strongly alter the efficacy of a particular architecture. That amplification of consequence may induce architecture variety to deal with various challenges.
For example, when the final electron acceptors follow soon after basic glycolytic processing, various terminal pathways and branching architectures occur. What forces cause termination in pyruvate, ethanol, lactate, or other products? Why do some terminal pathways branch to produce more than one final product?
Thermodynamic aspects may sometimes be important. For example, it may matter how pathway variants relieve product inhibition, modulate the total free energy gradient, change the free energy differences in particular biochemical steps, and alter the free energy capture in storage disequilibria.
Making comparative predictions may be challenging at the broad scale of architectural differences. Nonetheless, we need comparative predictions to go beyond intuitive matching between observed pattern and hypothesized process.
An interesting contrast in pathway architecture occurs in the archaeal methanogens (p. 210). The Methanosarcinales clade uses cytochromes and electron transport across the membrane to drive ATP production. The other clades do not have cytochromes.
The cytochrome group relative to the cytochrome-free group typically grows more slowly and has higher yield per H2 molecule input. However, the cytochrome-free group dominates in H2 environments, perhaps because it can grow faster at a given H2 concentration.407
The cytochrome group is found mostly in habitats where it can grow on acetate, methanol, and methylamines. Those alternative food sources may provide less free energy than H2. Perhaps the cytochrome group can exploit weaker negative entropy sources more efficiently than the less efficient cytochrome-free group. Stronger comparative predictions and tests would be useful.
COOPERATIVE CATABOLISM
Three examples pose interesting puzzles.
First, cable bacteria link cells to connect anoxic-zone hydrogen sulfide electron donors to oxic-zone electron acceptors. The electron flow gradient causes rapid removal of electrons from anoxic-zone cells, enhancing the free energy gradient for those cells. The oxic-zone cells pass the incoming electrons on to the final oxygen acceptor (p. 213).
The anoxic-zone cells grow and divide. The oxic-zone cells do not. If oxic-zone cells do not gain any growth advantage and instead are effectively sterile altruists, why do they express the cooperative traits that connect anoxic cells to the oxic zone?151
Most likely, the cells are genetically similar, favoring cooperation by kin selection. Additionally, the cells may be randomly located in anoxic versus oxic zones, which in certain conditions may favor cooperative and nonreproductive expression in those cells that happen to end up in the oxic zone.
If the cells move frequently, they may alternate between reproductive and nonreproductive phases.151 Section 17.2 develops potential explanations into comparative predictions.
In the second example, extracellular electron shuttles accept electrons from some cells and donate electrons to other cells or to abiotic electron sinks.250,409 Such shuttles have mostly been studied in experimentally manipulated systems. Shuttles may be quinones, phenazines, or a variety of other molecules.
In natural systems, extracellular shuttles would be available to any nearby cells. It is not clear how often such shuttles are produced and released by cells specifically for electron transport function. If it happens, then cells that make shuttles would pay the cost of production and share the benefits with neighbors (p. 311). Such publicly available resources raise interesting aspects of conflict and cooperation in design.
Third, catabolic outputs excreted by one species may be taken up as catabolic inputs by another species. For example, bacteria in anoxic environments may release acetate, formate, H2, or other catabolic products with significant negative entropy. Archaeal methanogens may catabolize those molecules to methane and water (p. 211).
Methanogen uptake of the bacterial catabolic products relieves the bacteria of potential product inhibition. Puzzles concern how the flux of bacterial catabolic products depends on the environment, the free energy changes in various biochemical steps, and the resistance that may oppose flux at any point in the two-species pathway flow.
Pathway characteristics may be tuned to variation in environmental and demographic attributes. In addition, traits of one species may affect the population dynamics of the other species,113 which in turn alters the flux and free energy gradient of the cooperative catabolic pathway.