Syntax. DEVSQ(number1,number2,...)
Definition. This function returns the sum of squares of deviations of data points from their sample mean.
Arguments
Background. In general, correlations between variables are defined by coefficients. Based on the regression calculation, you can also estimate models for interval-scaled variables. A model is the mathematical core of a theory. A model allows the prediction of the dependent variable based on the independent variable. In this way, linear correlations can be defined. This means that the higher the count of the x-values is, the higher (or lower) the y-values. The correlation x to y can also be illustrated with a straight line. More complex models are also possible.
The quality of the regression is usually described by r2.
The average is the best y forecast value regarding the quality of the regression. The deviation from the average is also called forecast error. To calculate the average deviation, you can use the VAR.S() function.
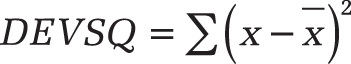
The DEVSQ() function calculates the sum of the squared deviations from the sample mean. The equation for the sum of the squared deviation is:
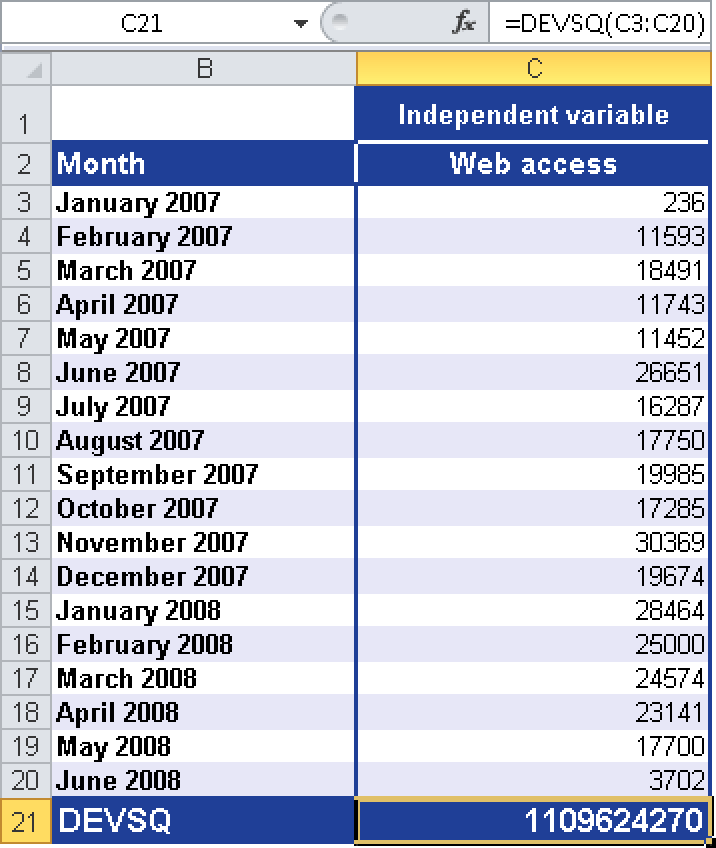
Example. You are still busy with analyzing the website and want to further calculate the correlation between the website visits and the online orders. You work on the website visits—the independent variable y. You want to calculate the sum of the squared deviations from the sample mean and use the DEVSQ() function. Figure 12-37 shows the solution.
The DEVSQ() function returns 1,109,624,270 for the website visits. This value matches the sum of the squared deviations from the sample mean.