Syntax. FORECAST(x,known_y’s,known_x’s)
Definition. This function returns the estimated value for a linear trend. The predicted value is a y-value for a given x-value. The known values are existing x-values and y-values, and the new value is predicted by using a linear regression. You can use this function to predict future sales, inventory requirements, or consumer trends.
Arguments
x (required). The data point for which you want to predict a value
known_y’s (required). The dependent array or range of data
known_x’s (required). The independent array or range of data
Note
If x isn’t a numeric expression, the FORECAST() function returns the #VALUE! error.
If known_y’s and known_x’s are empty or contain a different number of data points, the FORECAST() function returns the #N/A error.
If the variance of known_x’s equals 0, then FORECAST() returns the #DIV/0! error.
The equation for FORECAST() is a+bx, where
and
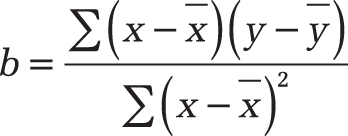
The x and y are the sample means AVERAGE(known_x’s) and AVERAGE(known y’s).
Background. For extensive trend analyses, use the TREND() and GROWTH() functions. However, those functions are complex and require an array to return the calculated values.
See Also
You will find more information about these function in the descriptions of TREND() and GROWTH().
To quickly calculate the prognosis for a certain value in a number series or a range, use the FORECAST() function. The FORECAST() function returns the estimated value for a linear trend. This means that the function calculates a trend based on given data and the “future number” for the specified x-value. In the following example, the estimated website visits for July 2008 (the x-value) are returned.
Example. You are the marketing director of a software company and want to create a forecast table. The forecast is to be calculated for the next nine months (July 2008 to March 2009) and includes the number of website visits as well as the number of online orders.
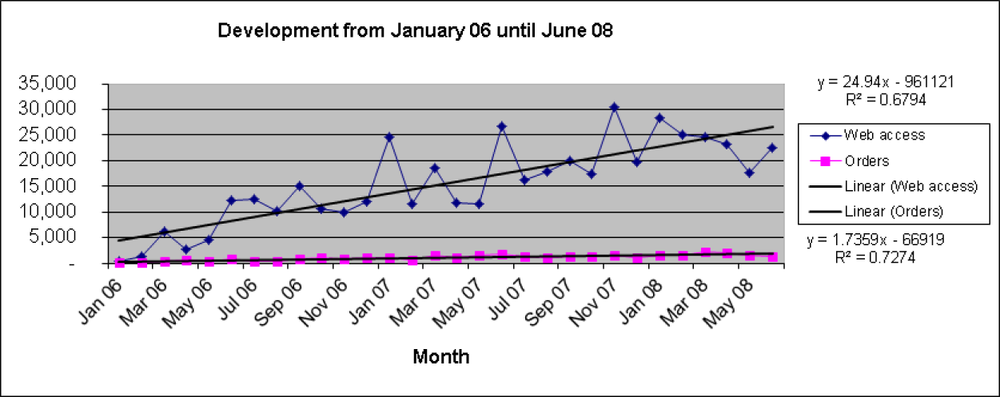
You assume that between January 2006 and June 2008 the data are linear. You have already calculated a line you could also use to create a prognosis (see Figure 12-54). However, you decide to calculate the forecast with the FORECAST() function.
First you want to calculate the expected number of website visits for July 2008. You enter the following arguments for the FORECAST() function (see Figure 12-55):
x = B32 (July 2008). This is the cell for which you want to calculate the expected number of website visits.
known_y’s = cell range $C$2:$C$31. The number of website visits from January 2006 through June 2008 are the dependent y-values.
known_x’s = cell range $B$2:$B$31. The months between January 2006 and June 2008 are the independent x-values.
Figure 12-55 shows how to enter the arguments for the trend in cell C32.

Note
Make sure you enter the absolute path for the known_y’s and known_x’s arguments. Press the F4 key after you have selected the cells. The $ sign is displayed in the formula bar. Because you entered the absolute path, you can copy the formula into cells C33:C40.
When you copy the formula, the cell containing the x argument (the estimated number of website visits) is automatically adjusted to the corresponding cell because the path is relative.
By copying the formula from cell C32 into the cells C33:C40, you get the trend for the website visits from July 2008 through March 2009.
You can use the FORECAST() function in the same way to create a prognosis for the online orders depending on the calculated website visits. To calculate the estimated online orders, enter the following arguments:
x = cell C32 (number of the online orders in July 2008). This is the cell for which you want to calculate the expected number of online orders.
known_y’s = cell range D2:D31. The number of online orders from January 2005 through June 2008 are the dependent y-values.
known_x’s = cell range C2:C31. The online orders between January 2005 and June 2008 are the independent x-values.
Figure 12-56 shows the result and the formula for the FORECAST() function for calculating the expected number of online orders.
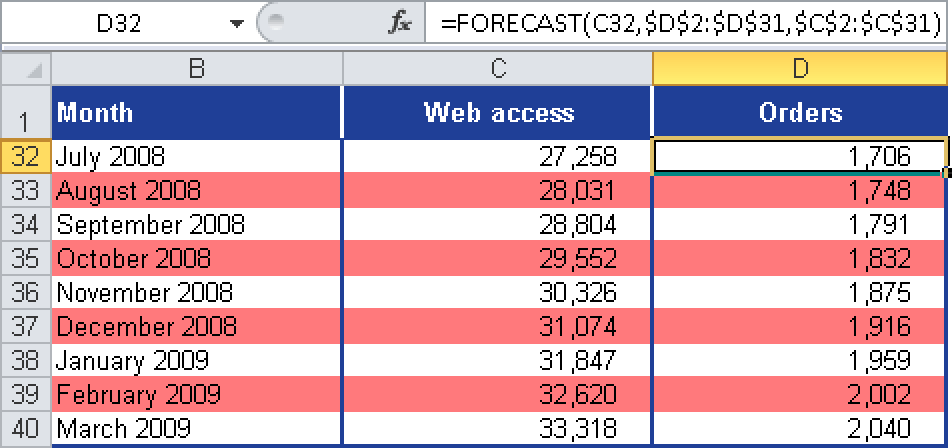
If you enter the absolute path for the known_y’s and known_x’s arguments, you can copy the function from cell D32 into the cells D33:D40 to calculate the trend for the other months depending on the number of website visits.