Syntax. FREQUENCY(data_array,bins_array)
Definition. This function returns a frequency distribution as single-column matrix. For example, use FREQUENCY() to count the sales in a certain area. Because FREQUENCY() returns an array of values, it must be entered as an array formula.
Arguments
data_array (required). An array of or a reference to a set of values for which you want to count frequencies. If data_array contains no values, FREQUENCY() returns an array of zeros.
bins_array (required). An array of or reference to intervals into which you want to group the values in data_array. If bins_array contains no values, FREQUENCY() returns the number of elements in data_array.
Background. To reduce the quantitative data, the existing data are categorized into classes for which the frequency is calculated. Remember the following:
If you have too many classes, you will have more information but less of an overview. The opposite is true for not enough classes.
The classes don’t need to have the same size.
The FREQUENCY() function counts the numeric data for given intervals. Unlike with the COUNTIF() function, you don’t need to enter the FREQUENCY() function in each result cell, but you can enter the function in all cells at once. FREQUENCY() is an array function, and it returns an array. In the example, the array consists of four numbers.
Note
Select the cell range to display the results and enter FREQUENCY() as array formula.
FREQUENCY() ignores empty cells and text.
Example. For FREQUENCY(), we will use the example of the software company again. A sales representative has entered his sales every month for the last two years in an Excel table. His manager wants to know the sales up to $15,000, up to $17,000, up to $19,000, and more than $19,000. Therefore, four classes are needed.
Cell range C3:C26 contains the data to be classified (see Figure 12-57). The four classes are specified in the Category column. The frequency of the data within a class is calculated based on this column.

Because FREQUENCY() is an array function, select the four result cells (F3:F6) in the result column to get the result as an array.
Tip: Use analysis functions in Excel 2003
Excel provides numerous analysis functions that you can access by selecting Tools/Analysis Functions (Excel 2003). With analysis functions, you can easily calculate a frequency distribution.
To use the analysis functions in Excel 2003, you must first activate the Analysis Function add-in. Select Tools/Add-Ins and select the Analysis Functions check box.
To calculate a frequency, select Tools/Analysis Functions and then select Historgram. You can also select the chart view to graphically evaluate your data.
Tip: Use analysis functions in Excel 2007 and Excel 2010
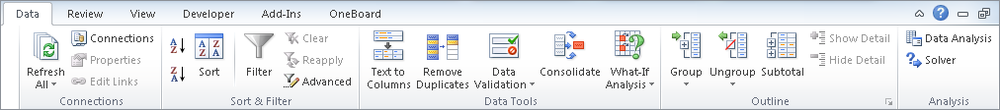
In Excel 2007 and Excel 2010, the analysis functions are located in the Analysis group on the Data tab. If the functions are not available, you must first activate them. In Excel 2010, click File and then select Options. In Excel 2007, click the Office button and select Excel Options. See Figure 12-58.

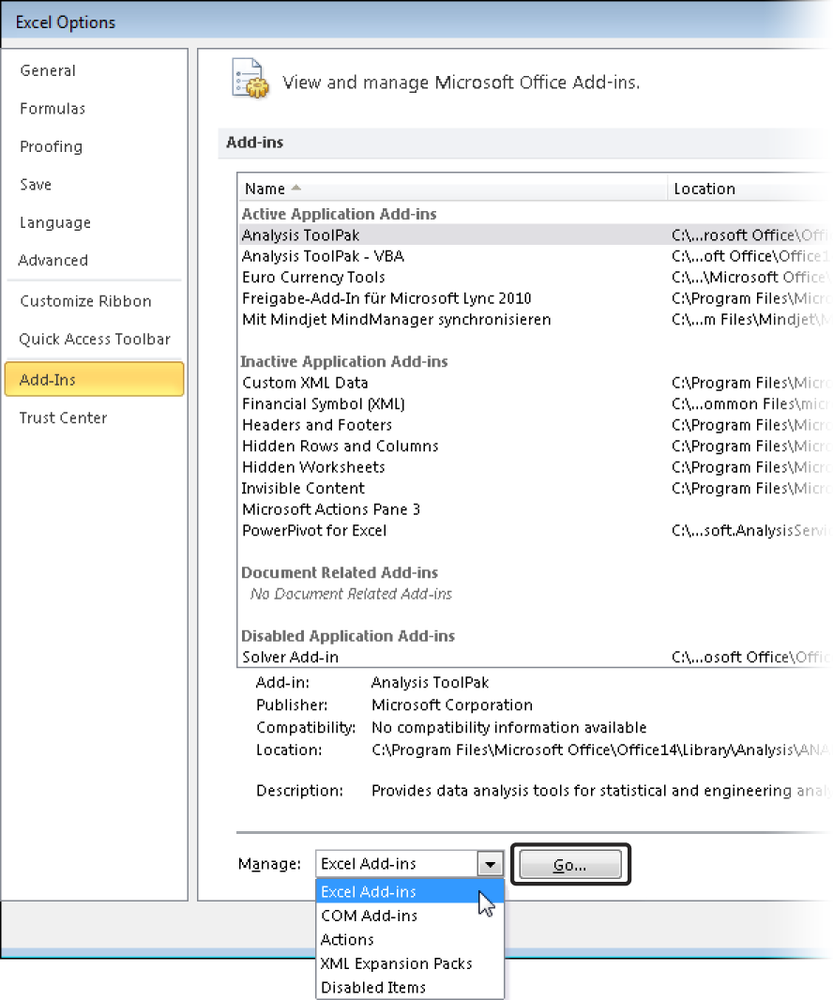
In the Excel Options dialog box, click Add-Ins, select Excel-Add-Ins in the Manage list, and then click Go (see Figure 12-59).
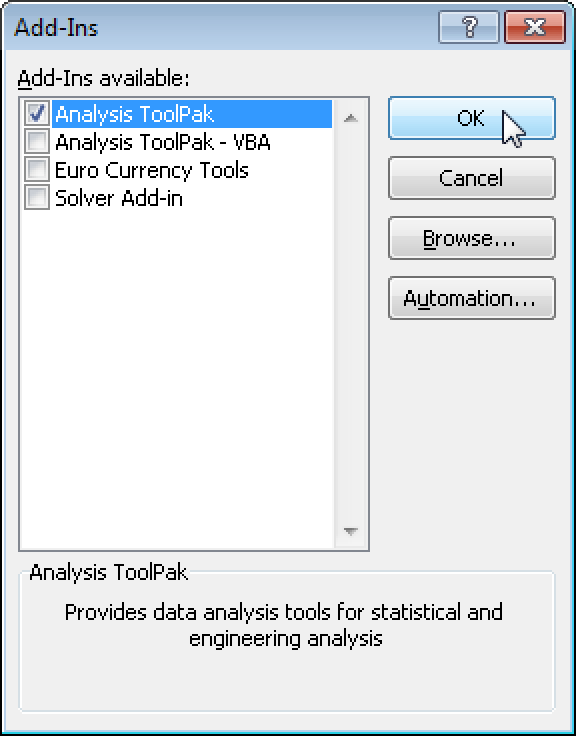
Select the Analysis ToolPak check box in the Add-Ins dialog box, and click OK (see Figure 12-60).
After the analysis functions have been installed, they are available on the Data tab (see Figure 12-61).