Syntax. NORMINV(probability,mean,standard_dev)
Definition. This function returns the quantile of the normal distribution.
Arguments
probability (required). A probability associated with the standard normal distribution
mean (required). The arithmetic mean of the distribution
standard_dev (required). The standard deviation of the distribution
Note
If one of the arguments isn’t a numeric expression, the NORM.INV() function returns the #VALUE! error.
If probability is less than 0 or greater than 1, the NORM.INV() function returns the #NUM! error.
If standard_dev is less than or equal to 0, the function returns the #NUM! error. If mean = 0 and standard_dev = 1, NORM.INV() uses the standard normal distribution (see the description of NORM.S.INV()).
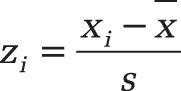
Background. A standardized normal distribution is a normal distribution with the mean value 0 and the standard deviation 1. Each normal distribution can be transformed into a standard normal distribution by subtracting the mean from the xi values and dividing the difference by the standard deviation.
Because the standard normal distribution is standardized, you can calculate the range for the normal distribution from the z-values by using the following formula:
See Also
You will find more information about normal distributions in the description of NORM.DIST().
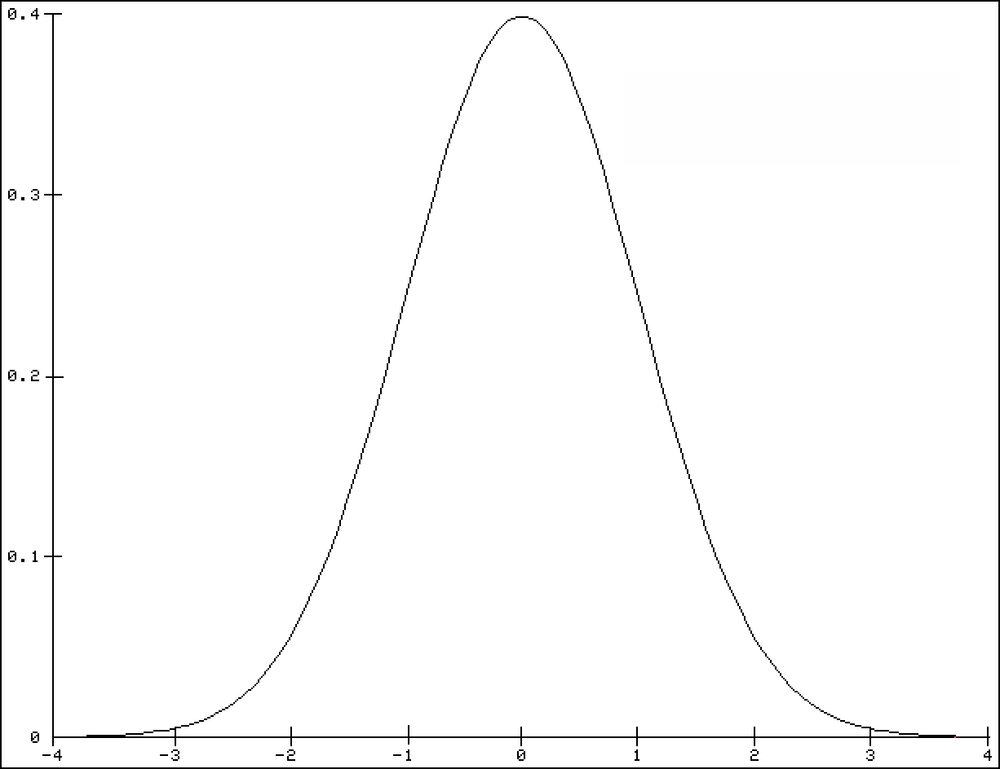
For the density function of the standard normal distribution, the intervals are 1, 2, and 3 standard deviations from the expected value 0 (see Figure 12-104). These ranges are about 68 percent, 95.5 percent, and 99.7 percent of the bell curve. The same percentages apply for all normal distributions regarding the expected values and the standard deviations.
Example. You are a light bulb manufacturer and want to analyze the performance of light bulbs. You also have calculated the average life cycle and the associated standard deviation. Now you want to know the performance of 85 percent and 15 percent of your light bulbs based on the mean values and the standard deviation.
For this calculation, you use the NORM.INV() function with the following arguments:
probability = 85 percent (15 percent); that is, you calculate the performance of 85 percent (15 percent) of the light bulbs
mean = 2,000 hours (calculated from the population n)
standard_dev = 579 hours (calculated from the population)
Figure 12-105 shows the results.
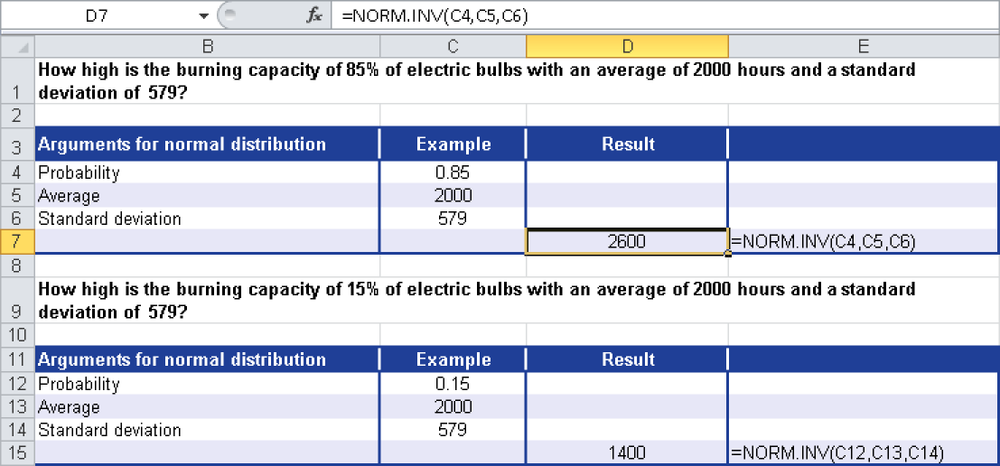
You can make the following statements from these results:
85 percent of the light bulbs have a performance of up to 2,600 hours.
15 percent of the light bulbs have a performance of up to 1,400 hours.