Syntax. RSQ(known_y’s;known_x’s)
Definition. This function returns the square of the Pearson correlation coefficient based on a set of data points known_y’s and known_x’s. The r2 value can be interpreted as the proportion of the variance in y attributable to the variance in x.
See Also
The Pearson correlation coefficient is explained in more detail in the section discussing the PEARSON() function.
Arguments
known_y’s (required). An array or a range of data points
known_x’s (required). An array or a range of data points
Note
Arguments can be numbers or names, arrays, or references containing numbers. If an array or a reference argument contains text, logical values, or empty cells, those values are ignored. However, cells with the value 0 are included.
If known_y’s and known_x’s are empty or have a different number of data points, the RSQ() function returns the #N/A error value.
Background. RSQ() calculates the coefficient of determination and is the square of the simple correlation coefficient. It is an indication of the strength of the relationship between the two sets of values.
Note
The correlation coefficient is a measure of association between two quantitative characteristics. The value ranges between –1 and +1 with the sign indicating whether the association is positive or negative; values closer to +1 or –1 indicate a stronger association. The value 0 indicates that no linear correlation exists.
The coefficient of determination ranges between 0 and +1 and is a measure of the variance in the y attributable to the variance in x. Thus, an r2 value of –0.0354 suggests that only 3.5 percent of the variation is attributable to the association between the two sets of data.
A coefficient of determination of 1 suggests a linear relationship, but care should be taken that a causal effect is not assumed. The equation for the Pearson correlation coefficient r is:
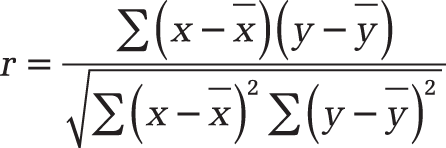
The values x and y are the average values of a sample AVERAGE(x_values) and AVERAGE(y_values).
RSQ() returns r2, which is the square of this correlation coefficient.
Example. The software company is still busy evaluating its website. The marketing department wants to know the extent of the association between the online orders and the website visits. The marketing department calculates the coefficient of determination for the two interdependent variables to assess any association between the two (see Figure 12-121).
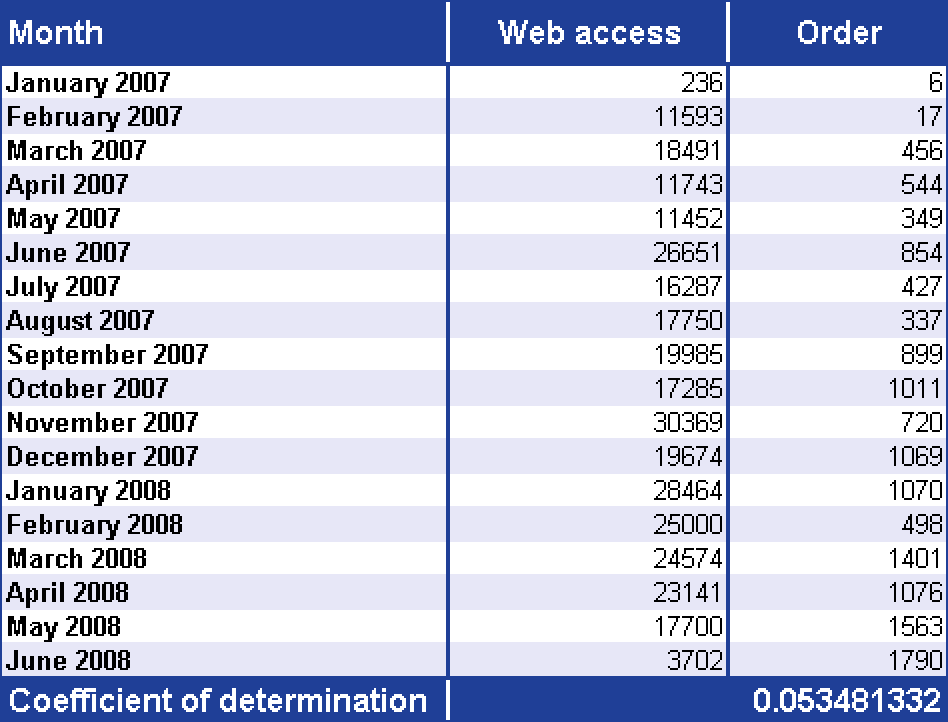
Figure 12-121. Calculating the coefficient of determination to show the association between online orders and website visits.
The online orders are compared with the website visits.
Then the RSQ() function calculates the association between the two and returns 5.35 percent.
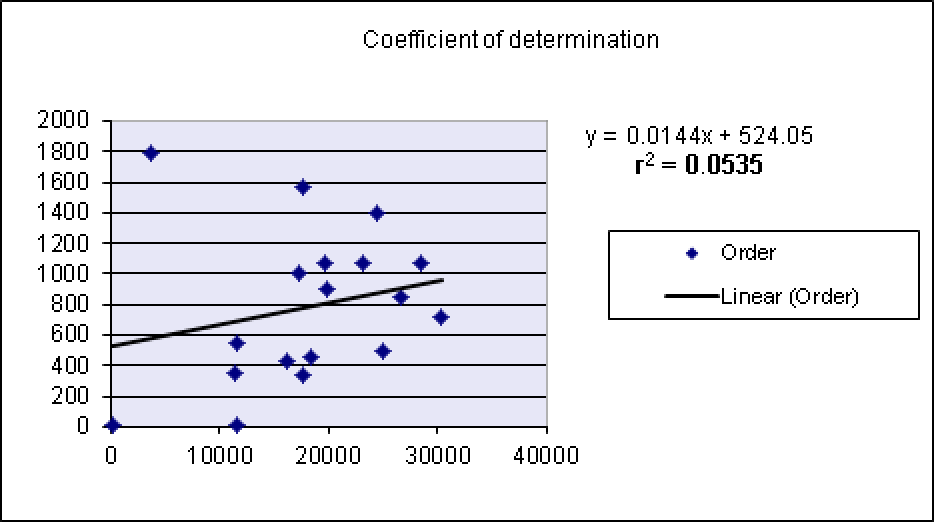
The illustration of the association of the online orders and the website visits in a chart returns the same result for r2 (see Figure 12-122).
Tip
To display the coefficient of determination r2, click Format Trend Line on the shortcut menu for the trend line, and then on the Options tab of the format Trent Line dialog box, select the Display R-Squared Value On Chart check box.
The calculation of the coefficient of determination and the result r2 = 0.0535 shows that only 5.35 percent of the association between website visits and orders can be explained by a linear relationship.