Syntax. STDEV.S(number1,number2,...)
Definition. This function estimates the standard deviation based on a sample. The standard deviation is a measure of how widely values are dispersed from the average value (the mean).
Arguments
number1 (required) and number2 (optional). At least one and up to 255 arguments (30 in Excel 2003 and earlier versions) corresponding to a sample of the population. You can also use a single array or a reference to an array instead of arguments separated by commas.
Note
The STDEV.S() function assumes that its arguments are a sample of the entire population. If the data passed as arguments are a population, calculate the standard deviation with the STDEV.P() function.
The calculated standard deviation is an estimate of the standard deviation of the sample from a population. This means that it is divided by n–1 instead of by n.
Logical values (TRUE and FALSE) and text are ignored. If you want to include logical values and text in the calculation, use the STDEVA() function.
Background. The standard deviation is the square root of the variance. The standard deviation indicates the variance in the measure for the characteristic.
Both measures are used in inferential statistics for the equation of the normal distribution. These measures are also used in descriptive statistics because they are considered more reliable than linear deviations.
The height of the variance and the standard deviation depend on the measure containing the characteristic. This factor has to be taken into account when comparing different distributions, especially for variables that also refer to different property dimensions.
In these cases, the variance coefficient is used. The variance coefficient is calculated by dividing the standard deviation by the arithmetic mean and the relative spreads. The higher the variance coefficient, the higher the variance relative to other distributions. To calculate the variance coefficient, the ratio scale is required.
The standard deviation is one of the most important spreads. Like the variance, the standard deviation describes the deviation from the mean. However, unlike the variance, the standard deviation is calculated based on the square of the difference.
In other words: The standard deviation is the square root of the arithmetic mean of the squared deviation of the values from the arithmetic mean. Therefore, the standard deviation is the root of the variance. STDEV() uses the following formula:
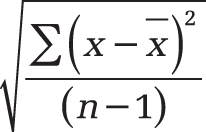
The value x is the sample mean AVERAGE(number1,number2,...) and n is the sample data set.
Example. You are the manager of the marketing department and already know a lot about statistics and the possible evaluations. Now you want to use the STDEV.S() function to create detailed evaluations of the website visits. The goal is to calculate the standard deviation based on a sample to evaluate the variance of the visits around the mean.
Note
The data to be evaluated is a sample. This means that although the website has existed for a long time, the calculation of the standard deviation with STDEV.S() and STDEV.A() is based on the data from 18 months (January 2007 to June 2008).
You have already created an Excel file containing the number of visits per months for different areas of the website. In addition to the standard deviation, you also calculated the variance, the average deviation, and the mean for each data set.
To calculate the variance, square the lower standard deviation by the returned value (see Figure 12-134).

If you take a closer look at the PRODUCTS area, you can make the following statement: The result of 3,789.62 indicates that the website visits (clicks) scatter in height of 3,789.62 around the mean of 5,215.06.
The ALL (SUM) column contains the standard deviation for all areas and months of the sample period and indicates that they scatter in height of 6,115.3 clicks around the mean.