CHAPTER 7
Digitizing
LEARNING GOALS
- Edit, create, and delete polygon features.
- Extract features from other map layers using the study area.
- Create and digitize point and line features.
- Use cartography tools to smooth features.
- Work with CAD drawings.
- Spatially adjust features.
Introduction
This chapter teaches you how to create new vector (point, line, and polygon) map layers using “heads-up” digitizing by using basemaps on the computer screen. First, you will create a new feature class including table attributes. Then you will use an existing map layer, such as streets, as a guide or spatial data reference for locations. Finally, you will use digitizing tools with the pointer on your screen to create new features and enter corresponding attribute data. Technologies such as lidar and satellite imagery are also references for heads-up digitizing. You will learn more about lidar data in chapter 11.
You can also use GPS receivers, which collect longitude and latitude data to create new vector features. Also, computer-aided design (CAD) and building information modeling (BIM) can be imported into GIS maps to create new feature classes.
In this chapter, you will edit existing features and create new features for a rapidly expanding university campus, Carnegie Mellon University (CMU), in Pittsburgh, Pennsylvania. New buildings, additions, and renovations to existing buildings are part of a campus master plan. Changes also include new or modified streets, sidewalks, parking lots, and so on. Architects, engineers, and planners need updated GIS features for the campus, and tutorials in this chapter teach the skills to create and edit them.
Tutorial 7-1: Edit polygon features
In this tutorial, you will move and rotate existing buildings in a map layer. Then you will add vertex points and split polygons to further edit them to match buildings in a World Imagery basemap. Note that imagery maps may change over time so the images may be slightly different from those in the tutorial. The user interface also may look slightly different from the figures you see in this chapter.
Open the Tutorial 7-1 project
- 1.Open Tutorial7-1.aprx from the Chapter7\Tutorials folder, and save the project as Tutorial7-1YourName.aprx. Tutorial7-1 contains a map of CMU’s main campus with buildings as semitransparent features on the World Imagery basemap. A clean copy of CMU’s building features named BldgsOriginal is located in Chapter7.gdb should you wish to repeat the steps of this tutorial.
- 2.Use the Main Campus bookmark to zoom to CMU’s main campus and academic buildings.

Move features
A few buildings on the campus are not in their correct locations and can be moved into exact locations using World Imagery as a reference.
- 1.Use the Cohon University Center bookmark and Select button
 to select the Cohon University Center building polygon. By default, a construction toolbar appears in the active map or when you right-click on the map.
 - 2.On the Edit tab, click the Move button
 . A yellow dot appears in the center of the polygon indicating that the polygon is ready to edit.

- 3.Drag the building polygon to match the building outline in the image.

- 4.Click anywhere outside the polygon. Continue to drag until the polygon is in the correct location.
- 5.On the Edit tab, click the Save button
 , and in the Save Edits pop-up window, click Yes to save your edits. Saving edits to features differs from saving ArcGIS Pro projects. If you do not want to save changes, click the Discard button.
 - 6.Close the Modify Features pane when finished.
YOUR TURN
Use the College of Fine Arts bookmark, and move the building polygon to its correct location. You will later add and move vertex points to create the U-shaped building. Pan the main campus map to find other buildings to move to the correct location. Save your edits and project.
Rotate features
Features may be in the correct location but must be rotated. This requirement applies to CMU’s Gates Center for Computer Science.
- 1.Use the Gates bookmark, and select the Gates building polygon.
- 2.On the Edit tab, click the Move button
 . Selecting the Move button enables edits for move, rotate, and scale.
 - 3.In the Modify Features pane, click the Rotate button
 . A yellow dot and green circle appear in the center of the building, indicating that the polygon is ready for editing.
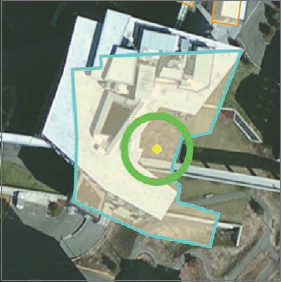
- 4.Move the pointer to the green circle, and then click and move and rotate the highlighted outline to match the approximate location of the building outline in the satellite image. The building might not align perfectly with the satellite image. You will later learn how to edit vertex points that could fix an imperfect alignment.

- 5.Click anywhere outside the polygon, click the Save button, click Save Edits, and close the Modify Features pane.
Add and move vertex points
Features are sometimes represented as simplified squares, rectangles, or circles, but vertex points can be added and modified to reflect the true building shape. The College of Fine Arts building was drawn as a rectangle, but the building actually has a U-shaped roof. Adding and editing vertex points will fix this problem.
- 1.Use the College of Fine Arts bookmark, and pan the map to see the entire building.
- 2.Select the College of Fine Arts building, click the Edit tab, and click the Vertices button
 . Four vertex points will appear at the corners of the polygon. You must add four more vertices to make the U shape.
 - 3.On the Construction toolbar, click the Add button
 , and click four points on the left (western) line of the College of Fine Arts building to add four vertex points as shown.

- 4.Click the Normal button
 and the second of the new vertex points.
 - 5.Drag the vertex point to the inside corner of the building as shown in the figure.
- 6.Click and drag the third vertex point, making a U shape.
- 7.Drag the vertex points to the corner of the building, making a U shape.

- 8.Click the Finish button
 .
. - 9.Save your edits, and close the Modify Features pane when you finish.
Split features
Two buildings on the campus are drawn as one polygon because they are connected. However, university architects and facility planners must identify the buildings as separate polygons, each with a separate record in the attribute table. The Split tool will accomplish this task.
- 1.Use the Baker Porter bookmark, and select the building polygon for these buildings. Baker Hall is the easternmost section of the building, and Porter Hall connects at the western end of the third wing as seen in the image (on the left). This location where buildings connect is where you will split the polygon.

- 2.On the Edit tab, click the Split button
 .
. - 3.Zoom in, and click on the north side of the small indented areas between Baker and Porter Halls, and double-click on the south side as shown in the figure. Be sure to click and double-click outside the border of the building. This action splits the building into two polygons at this location.

- 4.Save your edits, and close the Modify Features pane when you finish.
- 5.Select the new polygon for Baker Hall, and in the Contents pane, open the Bldgs attribute table.
- 6.Click the Show selected records button.
- 7.In the attribute table, type 2A for Number, BH for BL_ID, and Baker for Name.
- 8.Select the Porter Hall polygon, and for its fields, type 2B for Number, PH for BL_ID, and Porter for Name.
- 9.In the attribute table, click Clear to clear the selected records.
- 10.Close the attribute table, and use the Baker Porter bookmark. Two separate buildings are now labeled for Baker and Porter Halls.

YOUR TURN
Use the Hamerschlag Roberts bookmark to select and split one polygon into two separate buildings. The rectangular building with two triangles on the left (west) is Roberts Hall, and the building on the right is Hamerschlag. Edit the Roberts Hall polygon using 23 as the building number, REH as the BL_ID, and Roberts Engineering Hall as the name. Use the Move and Vertices tools to better match the building polygons to the World Imagery basemap. Save your edits and your project.

Tutorial 7-2: Create and delete polygon features
Changes to the CMU campus include a new addition to the Cohon University Center, a new building for the College of Engineering (Scott Hall), a new quadrangle for the Tepper School of Business (Tepper Quad), and a new addition to Heinz College, which is Hamburg Hall. A new feature class will highlight these development areas for communication with the campus community and the university’s neighbors.
Open the Tutorial 7-2 project
- 1.Open Tutorial7-2.aprx from the Chapter7\Tutorials folder, and save the project as Tutorial7-2YourName.aprx. The tutorial contains a map of CMU’s main campus and existing buildings.
- 2.Use the Cohon University Center bookmark, and zoom out twice.
Create a new polygon feature class, and add a field
You can create new feature classes directly in ArcGIS Pro’s Catalog pane and add new attributes using the attribute table.
- 1.Open the Catalog pane, and navigate to Chapter7.gdb.
- 2.Right-click Chapter7.gdb, and click New > Feature Class.
- 3.For Feature Class Name, type BldgsProposed, and for Geometry Type, click Polygon.
- 4.Under Coordinate System, click Bldgs.
- 5.Click Environments, and under Output Coordinate System, click Bldgs. NAD_1983_StatePlane_Pennsylvania_South_FIPS_3702_Feet will be selected as the coordinate system.
- 6.Run the tool, and after it finishes, close the Geoprocessing and Catalog panes. The new BldgsProposed feature class has been created in the file geodatabase, and a corresponding layer has been added to the map. The feature class is empty now. Later, as you digitize features, polygons will be added to the feature class and become visible on the map.
- 7.Open the BldgsProposed attribute table, add a field named BLDGNAME, select Text for Data Type, and type 75 for Length.
- 8.Save your edits, and close the BldgsProposed table and Fields view. Now your new polygon feature class is ready for digitizing.
Add a feature class, and create new polygons
Before you start adding features, you’ll change the style for the layer’s symbol.
- 1.In the Contents pane, change the color of the BldgsProposed layer to Tuscan Red with a White outline.
- 2.On the Edit tab, click the Create Features button
 .
. - 3.In the Create Features pane, click BldgsProposed and the Polygon button.

- 4.On the Configure toolbar, click the Line button
 , and drag to draw a rectangle similar to the figure. Double-click the last vertex point to finish the polygon. If the imagery map has an updated building footprint, use that as a guide to digitize the building.

- 5.Save your edits, and clear the selected polygon.
YOUR TURN
Use the Hamerschlag Roberts bookmark, zoom out a few times, and draw a rectangle to the north of Roberts Engineering Hall. Use the Tepper Quad bookmark to create a new polygon using the existing parking lot or building footprint as a guide. Use the Hamburg Hall bookmark, and create a new polygon between Hamburg and Smith Halls as shown in the figure. Save your edits, and use the main campus bookmark to see the proposed developments. In the attribute table, enter building names Cohon Addition, Scott Hall, Tepper Quad, and Hamburg Addition so that they coincide with the names shown in the figure. Show labels using the building name and a yellow halo. Save your project.

Delete polygons
New development often includes the demolition of existing buildings. As part of the university’s Forbes Avenue Innovation Corridor, four buildings will be demolished and must be deleted from the GIS buildings layer.
- 1.Use the Arts Park bookmark to zoom to this area of Forbes Avenue on CMU’s campus.
- 2.Select one of the two buildings on the right (east) of the Integrated Innovation Institute, and on the Edit tab, click the Delete button
 . You can also right-click after selecting a building, and click Delete and use the Shift key to select multiple buildings to delete.
 - 3.Repeat step 2 to select and then delete the other building on the right of the Integrated Innovation Institute building and the buildings on the right (east) of the 4615 Forbes (GATF) building.

- 4.Save your edits, and close the Create Features pane.
Create a study area polygon feature
Campus architects and campus planners want to know the square footage of a study area of the main campus where most of the academic buildings are located. Planners identify five streets (Forbes, Boundary, Schenley, Tech, and Margaret Morrison) that are used to create the study area. The Trace tool will quickly create a polygon using these streets as guides.
- 1.Open the Catalog pane, and expand Databases and Chapter7.gdb.
- 2.Right-click Chapter7.gdb, and click New Feature Class.
- 3.Type StudyArea for Feature Class Name, and use Polygon for Geometry Type.
- 4.For Coordinate System, click Bldgs.
- 5.In Environments > Output Coordinate System, click Bldgs.
- 6.Run the tool, and close it and the Catalog pane after the tool finishes.
- 7.Change the symbology of the StudyArea layer to 50 percent transparency.
Use the Trace tool to create a polygon feature
- 1.Use the Main Campus bookmark, and turn off the BldgsProposed and Bldgs layers.
- 2.On the Edit tab, click the Create button
 .
. - 3.On the Edit tab, click the Snapping button
 .
. - 4.In the Create Features pane, click the StudyArea layer and the Trace button
 .
. - 5.Click the intersection of Boundary St and Forbes Ave, drag the pointer south along Boundary St, then east on Schenley Dr, north and east on Frew St, north and east on Tech St, northeast on Margaret Morrison St, and then northwest on Forbes.
- 6.Double-click on Boundary Street as you near the original point at the intersection of Boundary and Forbes Streets. The new study area polygon will match the existing street centerlines exactly.

- 7.Save your edits, and close the Create Features pane.
YOUR TURN
In the Contents pane, open the StudyArea table, and note the Shape_Length and Shape_Area values, which are in feet.
Calculate campus acreage
It’s useful for campus architects and planners to know the acreage of the campus, and this can be automatically calculated.
- 1.On the Analysis tab, click the Tools button and search for Add Geometry Attributes.
- 2.Fill out the form as follows, and select Bldgs as the Coordinate System.
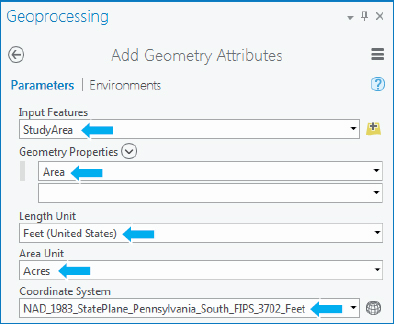
- 3.Run the tool, and close it after it finishes.
- 4.Open the StudyArea attribute table to see the new calculated POLY_AREA field. The value should be about 72 acres.
- 5.Use Fields View to change the field alias name to ACRES.
- 6.Save your project.
Tutorial 7-3: Create and digitize point and line features
Point and line features can represent public transportation and pathways on CMU’s campus. In this tutorial, you create new feature classes for bus stops (points) and directional paths (polylines). You then digitize points and lines for the bus stops and pathways to two commonly visited buildings on campus, Warner Hall (where the admissions office is located) and the Purnell Center (location of the School of Drama performances).
Open the Tutorial 7-3 project
- 1.Open Tutorial7-3.aprx from the Chapter7\Tutorials folder, and save the project as Tutorial7-3YourName.aprx. The tutorial contains a map of the campus with streets labeled, buildings turned off, and a light-gray canvas basemap. Also included in the Contents pane is a crosswalk table of bus stop IDs, stop names, and stop routes.
- 2.Use the Bus Stops bookmark.
Create a new feature class and attributes in its table
- 1.Open the Catalog pane, and navigate to Chapter7.gdb.
- 2.Right-click Chapter7.gdb, and click New > Feature Class.
- 3.For Feature Class name, type BusStops, and for Geometry Type, select Point.
- 4.For Coordinate System, click Bldgs.
- 5.Click Environments, and for Output Coordinate System, click Bldgs.
- 6.Click Run, and close the tool when it finishes.
- 7.Open the BusStops attribute table, and create a field named Stop_ID, with Text for Data Type and 5 for Length.
- 8.Close the attribute table. A new point feature class is in the file geodatabase and is ready for digitizing. You will use Stop_ID to join a crosswalk table that contains bus routes associated with each bus stop.
YOUR TURN
Create a polyline feature class in Chapter7.gdb named Paths whose coordinate system is NAD_1983_StatePlane_Pennsylvania_South_FIPS_3702_Feet. Create a field named PathName, with Text for Data Type and 25 for Length. Close the table.
Digitize points
- 1.Add the new point feature class BusStops, and rename the map layer CMU Bus Stops.
- 2.Change the symbol to Bus Station, color to Ultra Blue, and size 18.
- 3.On the Edit tab, click Create Features button
 .
. - 4.In the Create Features pane, click CMU Bus Stops and the Point button.
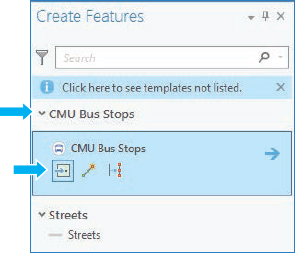
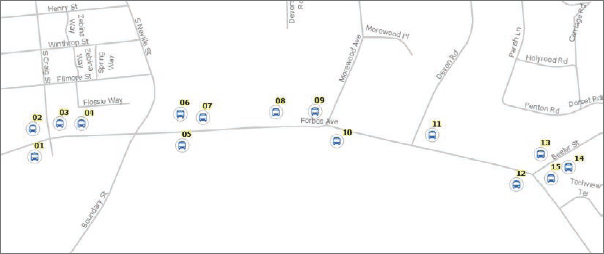
- 5.Working west to east, click points on the map to digitize the following bus stops at the approximate locations in the order as labeled in the figure.
- 6.Close the Create Features pane.
- 7.Open the attribute table, and type the Stop_ID values as 01, 02, 03, and so on, to match the labels on the map. This field is used to join the crosswalk table with bus routes associated with each stop. You will label the map in Your Turn.
- 8.Save your edits.
YOUR TURN
Join the BusStopCrosswalk table to BusStops using the Stop_ID fields. If you have trouble joining, save your project, exit Pro, and open the project again. In the map, click bus stop 09 at the intersection of Forbes and Morewood Avenues to see the stop name and route. Close the Create Features pane and attribute tables, and clear selections. Label the map using the stop name.
Digitize pathways
Street centerline and sidewalk/curb layers don’t provide internal campus paths to direct visitors from bus stops or a parking garage. In this exercise, you will digitize paths to commonly visited buildings on CMU’s campus.
- 1.Add Paths from Chapter7.gdb, and change its symbology to Mars red, 2 pt.
- 2.Change the basemap to Imagery, and use the Paths bookmark.
- 3.On the Edit tab, click the Create Features button
 .
. - 4.In the Create Features pane, click Paths and the Line button.

- 5.Using the imagery basemap as reference, click a starting point at bus stop 10, Forbes Ave Opp Morewood (Carnegie Mellon), click points along the path as shown in the image, and double-click to end the path at the entrance of Warner Hall.

- 6.Open the Paths attribute table, and type Bus to Warner Hall under PathName.
- 7.Digitize the path from CMU’s parking garage to Warner Hall, and type Garage to Warner Hall for the path name in the attribute table.

- 8.Save your edits, clear the selection, and label the paths using a font size 12, bold font, and blue halo.

YOUR TURN
Digitize the paths from the bus stop and garage to the Purnell Center building, and enter path names. Close the Edit and attribute tables, and clear selections. Change the symbology of the legend to unique values, using bright red for the Warner Hall paths and bright yellow for the Purnell Center paths. Save your project.

Tutorial 7-4: Use cartography tools
In addition to edit tools, GIS features can be modified using cartography tools. A useful tool to improve the aesthetic or cartographic quality of polygons is the Smooth Polygon tool. Organizations such as the US Census Bureau sometimes digitize lines and polygons at a small scale. The features are digitized with just a few line segments and don’t match the true geography. Smoothing features can fix this problem.
Open the Tutorial 7-4 project
- 1.Open Tutorial7-4.aprx from the Chapter7\Tutorials folder, and save the project as Tutorial7-4YourName.aprx.
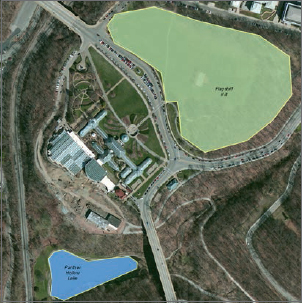
- 2.Use the Flagstaff Hill & Panther Hollow Lake bookmark. This tutorial contains a map with semitransparent polygon features, a park adjacent to the university’s campus, a golf course next to campus, and a lake south of campus. The map is zoomed to the park and lake.
Smooth a green space polygon
Flagstaff Hill is part of Pittsburgh’s Schenley Park between Carnegie Mellon University’s campus and Phipps Conservatory. The Flagstaff Hill polygon was roughly drawn with just a few line segments and can be smoothed.
- 1.On the Analysis tab, click the Tools button.
- 2.In the Geoprocessing pane, click Toolboxes, and expand Cartography Tools > Generalization, and click Smooth Polygon.
- 3.Type or make selections as shown, saving the output feature class to Chapter7.gdb.

- 4.Run the tool, and close it after it finishes.
- 5.Turn off the Greenspaces layer. The result is a new feature class of smoothed polygons for Flagstaff Hill and the polygons for Schenley Golf Course.

- 6.Use the Schenley Golf Course bookmark to see the new smoothed polygons for the golf course.
YOUR TURN
Use the Smooth Polygon tool to smooth the water feature of Panther Hollow Lake. Save the new features as WaterSmoothed to Chapter7.gdb. Save your project.
Tutorial 7-5: Transform features
Administrators, architects, and facility planners often combine GIS map layers and CAD drawings of separate buildings for strategic planning, including understanding the occupancy and use of every space on campus. CAD drawings, however, use Cartesian coordinates and are not geographically referenced to GCS, state plane, or UTM coordinates. CAD drawing units are also different from GIS units. For example, the leading CAD software, AutoCAD, uses one inch or one millimeter as the unit, and GIS maps generally use feet or meters as the unit. Transforming features in GIS makes aligning CAD drawings to GIS maps easy, regardless of drawing or map coordinates and units.
Open the Tutorial 7-5 project
- 1.Open Tutorial7-5.aprx from the Chapter7\Tutorials folder, and save the project as Tutorial7-5YourName.aprx.
- 2.Use the Study Area Buildings bookmark. Tutorial7-5 contains a map of CMU’s campus and the Oakland neighborhood to the north of campus. Academic buildings for the main part of campus are included and used to transform CAD drawings.
Add and export a CAD drawing
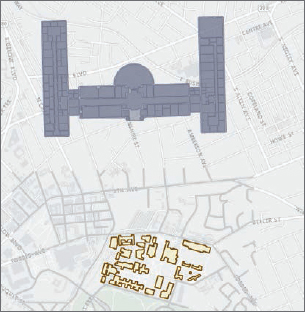
Next, you will add an AutoCAD drawing that includes polygons for every space on the first floor of CMU’s Hamburg Hall academic building.
- 1.Click Add Data, navigate to Chapter7 > Data, double-click HBH1.dwg, click Polygon, and click OK.
- 2.Zoom to the HBH1-Polygon Group layer. The drawing unit is one inch, and the drawing will appear as 12 times its actual size.

- 3.In the Contents pane, click the arrow next to HBH1-Polygon Group to expand the layers. CAD drawings contain layers in one drawing and are color-coded according to the layer color assigned in the CAD drawing. You cannot edit CAD drawings directly, so you will export the drawing to an ArcGIS shapefile.

- 4.In the Contents pane, right-click layer HBH1-Polygon, and click Data > Export Features.
- 5.In the Geoprocessing pane, for Output Feature Class, type HBH1SpacePlan, which you will save to Chapter7.gdb.
- 6.Run the tool, and close it after it finishes. HBH1SpacePlan is automatically added to the map in the same location as the original CAD drawing. The new layer is used for transformation to its actual location on the campus map.
- 7.Remove the HBH1-Polygon Group layer.
Explore attributes, and classify layers
Before transforming the drawing to the GIS coordinates, you will explore the attributes of the exported CAD drawing and classify spaces based on their layer assignment.
- 1.Open the HBH1SpacePlan attribute table. The results of exporting a CAD drawing are that properties of the drawing are added as fields in the attribute table. The Layer field shows designations of space use. Every polyline in AutoCAD became a polygon in the new feature class, and the layer on which the CAD polyline resided became the layer designation (for example, Office, Hallway, Classroom, and so on).

- 2.Close the attribute table, and in the Contents pane, right-click HBH1SpacePlan, and click Symbology.
- 3.In the Geoprocessing pane, use Import symbology, and click SpacePlan.lyrx from Chapter7\Data\ for Symbology Layer.
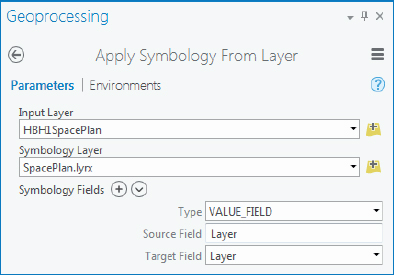
- 4.Run the tool, and after it finishes, close it and the Symbology pane.
- 5.In the Contents pane, turn off the World Light Gray Canvas and Streets layers.
- 6.Zoom and pan the map to see the HBH1SpacePlan and study area buildings.

Rotate a building
The features are now ready for transformation into the GIS units for the map. First, you will rotate the Hamburg Hall building 180 degrees.
- 1.In the Contents pane, right-click HBH1SpacePlan > Selection, and click Select All.
- 2.On the Edit tab, click Tools, and in the lower-right corner of the Tools group, click More Tools.
- 3.In the Modify Features pane, click the Rotate button
 .
. - 4.Drag the green circle to rotate the building approximately 180 degrees.
- 5.Pan the map if necessary to see the entire building.
- 6.Move the polygons closer to the study area buildings.
- 7.Save your edits, and zoom in to see your modified building and study area buildings. Hamburg Hall is the second building from the top left.

Transform polygons
Next, you will transform the building using eight links that align the floor-plan polygons to the building in the GIS map.
- 1.In the Contents pane, right-click HBH1SpacePlan > Selection > Select All.
- 2.In the Modify Features pane, click the Transform button
 .
. - 3.In the Modify Features pane, click Similarity for Transformation Method, and click the Add New Links button.

- 4.Click the lower-left corner of the HBH1SpacePlan layer and the corresponding lower-left corner of the Hamburg Hall building in the campus map.
- 5.Continue adding links as shown in the figure.

- 6.In the Modify Features pane, click the Transform button.
- 7.Wait while the polygons are scaled and moved to the geometry on the map.
- 8.Save your edits, close the Modify Features pane, and clear selected features.
- 9.Zoom to the HBH1SpacePlan layer to better see the transformed polygons on the map.

- 10.Save your project.
Assignments
This chapter has two assignments to complete that you can download from this book’s resource web page, esri.com/gist1arcgispro:
- Assignment 7-1: Conduct a campus storm water runoff project.
- Assignment 7-2: Digitize police beats.