Chapter Five
Long Distance Migration
5.1 The Migratory Instinct
Humans have always been restless and mobile. Even the movement of early homo sapiens out of Africa was motivated, we presume, by a need to acquire more food, clothing and peaceful surroundings. In modern terms, we call this a larger and more stable source of income. Nomadic peoples from the earliest times wandered in direct response to the need for additional pasture to keep their growing flocks of sheep and goats (resources). Great migrations took place more or less continuously.1 For instance, the Celts’ westward migration within Europe in pre-history was a likely response to economic and political pressure at their eastern border. The citizens of imperial powers such as the Egypt, Greece and Rome spread to the empire’s hinterlands; many stayed. In time, these imperial countries were beset by great barbarian invasions. The Visigoths, in the 5th century, moved westward within the Roman Empire, sacked Rome and eventually claimed land in southern Europe. Other barbarian sweeps followed. The Huns were, within several centuries, followed by the Mongols from Central Asia who not only spread westward but eastward into China where they established their own dynasty (the Yuan). Religion presented a motivation, or pretext, for expansion and subsequent settlement, such as the Muslims in the 8th and 9th centuries moving through North Africa into the Iberian Peninsula and East Africa, and the Spanish moving into large portions of South America in the 16th and 17th centuries. On a smaller scale, the emigration from England and Holland to the North American colonies in search of religious toleration had, like all others so motivated, both an economic motivation and consequence. The motives for migration are seldom uni-causal. But, whether part of a voluntary international movement, expelled, or migrating for other reasons, choices had to be made.
For some, the choices were limited or essentially non-existent. There is a rather touching statue just outside Liverpool Street Station in London. It depicts a group of several children, of various ages, all looking slightly lost. Each has a suitcase and a personal possession, a toy, doll or book. The statue is a memorial to the “kinder transport,” the Czech Jewish children whose anxious parents sent them to Britain by rail in 1939 to avoid repression and the coming holocaust. It also commemorates those people who engineered the transport at some danger to themselves. Wars were not the only cause of flight; as we well know there have been many types of human action, and indeed inaction, that caused widespread human suffering and death for those left behind. Unfortunately, memorials to peoples bravely fleeing to safety are common; for example, there are the recently erected memorials in Helmsdale, Sutherland, to the Scottish Highlanders forced off their crofts in the 18th and early 19th centuries and into the migratory stream and the one in Grosse Île, Quebec, to the starving Irish who landed at Quebec in the famine years of 1847–1849. There are many other flights to safety that are not memorialized – but remembered. The pogroms aimed at displacing European Jewry in the 19th and 20th centuries are celebrated in Yiddish literature for the resilience of those displaced.
In less traumatic circumstances, there were times when the basically rural population of Europe migrated to the towns with increasing frequency: as trade and port cities grew, as administrative centers evolved, and as industries such as the woolen trades became specialized. Yet, it was not until the early modern period (the 17th and 18th centuries) that the structure of the European and North American economies started to change systematically from agriculture to a more diversified industrial/service base. The movement of people became part of that change. It had three main components:
- the rural-urban shift;
- regional (internal) migration; and
- long distance or international migration.
The industrial transition loosened the population, or parts of it, from its traditional rural roots by the changing demand for labor. As reflected in the growing discrepancy between agricultural and non-agricultural wages (incomes), this labor flow proceeded more or less continually until the present day. In OECD countries and some others, however, it has slowed both in absolute numbers and proportional terms as the agricultural sector has become too small a part of developed economies to be the source of many migrants of any sort.
Regional migration within a country, including the rural-urban shift, and international migration are closely related historically. To take one example: farm laborers in Southern Italy decided to move northward to Milan in pursuit of higher wages. Once the question of migrating had been introduced, some would now consider, and could afford, a longer migration from rural Italy to, say, Boston or New York. So the decision to be an international migrant can be a two-stage process. An individual may be a regional migrant first and subsequently an international migrant, presumably based on acquiring information and amassing the funds to finance the international move. Naturally, the timing and intensity of flows varied with both the economic conditions of the migrant-receiving and migrant-donor countries. These are often referred to as the “pull” and “push” forces of migration respectively.
The most potent of these forces is the “better living” that international migrants expect to achieve in the country to which they go. This is typically expressed in terms of wages or incomes – the assumptions are that all income is earned income and that the immigrant has a fixed level of human capital or education. Figure 5.1 shows several examples of the expected wage profiles for a 20-year-old hypothetical immigrant and their wage profile at home.2 The home wage-age profile is relatively flat reflecting either a low level of skills or a lack of rewards with experience – in labor markets today such a profile would generally be predicted for an individual with a low level of education and no prospects of job advancement. However, for this potential immigrant the wage profile may not simply be higher but take on a different shape Wi2 e. That is, the wage continues to rise and peaks much later in life due to job advancement available only in the new country of settlement. If the expected (ex ante) wage is the realized (ex post) wage, the migration is clearly successful. But what if the realized wage profile is lower than expected? The migration might still be successful if a wage profile differential between that of home and immigrants-receiving country is positive and compensates for all the costs of migration. The second panel of Figure 5.1 shows alternate expected wage profiles from migration. One is wholly below the home wage-age profile and is unlikely to induce migration. The second, and by far the more interesting and historically more representative case, shows a wage-age profile that is initially below the home wage but rises above it at some later age, here about age 30 (Wi3 e). The current wage would not induce migration by itself. However, the higher wages beyond age 30 would be a stimulus to movement if their future value is taken into consideration from the outset and offsets the early wage losses. And because these are future values, this requires calculating the familiar discounted present value.
Figure 5.1 Expected Wage Profiles by Location.
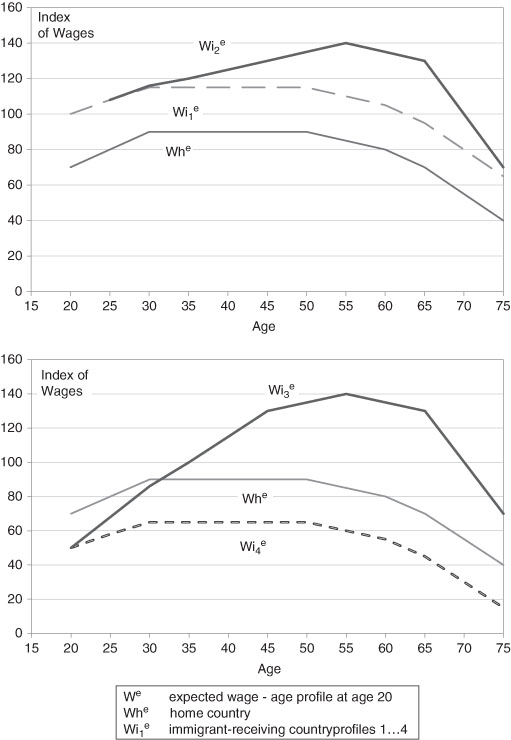
In order to induce migration the present value of the alternatives must be positive and take into consideration the (fixed) costs of migration. To this we might add the value of the immigrant child. Even today when asked the reasons for migration the immigrants will often respond that they migrated for the sake of the children to have a better life. The cost of international migration may be too high to compensate for the present value of the expected wage differential (income) and thus migration will not occur. It is, after all, the net present value from migration that is the key to the decision to migrate. Not only are there the costs of transport, plus any costs associated with financing them, but there are the costs (gains) of i) asset disposition; and ii) uncertainty. The disposition of assets (in the home country) and their replacement (in the immigrant-receiving country) is fraught with uncertainty. These assets include personal possessions and housing but may also include the cost of earning assets such as sewing machines or, if the international migration is a rural to rural one, a farm disposition and acquisition. This asset transfer problem is going to make older individuals more cautious about moving as they have more assets, and therefore more to lose, than younger potential international migrants – the less wealthy.
There are also the less adventurous among us and those who hold a special affection for the society and place in which they currently live, the so-called psychic benefits derived from remaining in place. Most people ignore or resist the temptation to move or are unaware of the benefits to becoming international migrants. Thus social scientists seeking to explain a flow of immigrants are looking for causes at the margin. First, there may be ignorance of the fact that a wage differential exists between countries especially as this differential necessarily is an average. Second, even when the average differential is known with some certainty, there may be uncertainty about where any one individual (the decision-maker) may end up on the wage distribution in the receiving country. Third, the cost of international migration may have simply been too high to compensate for the expected higher wages (income) - all appropriately discounted.3 Clearly, few did such calculations but rather asked questions that amounted to getting the same information: Will I be better-off? Will I be better-off in the long run? How much better-off will I be? Will I have friends or family there? Is it true, as I’ve heard, that New York (or Iowa, Manitoba, Christchurch, Woolongong) is really quite nice?
When labor migrates from a lower to a higher wage area, it changes the supply of labor in both places. An increased supply of labor pushes wages down in the one area, and the decline in the labor supply pushes wages up in the other. In the economic theory of trade, this flow of labor with its international equilibrating wage tendency is called factor price equalization. Economic historians look for real wage convergence (where the nominal wage of labor is adjusted for the cost of living at the chosen locations).4 Even if labor were immobile between economies, international trade would itself induce factor price equalization. The reason for this is that countries would specialize in the production of commodities that employed relatively more of the abundant factor within their own economies, thereby conserving on the use of the scarce, and more expensive, factor. This theory, the Hecksher-Ohlin model of trade, predicts that a country’s exports will embody the country’s abundant factor of production.5 Even without a flow of international labor or other factors of production, there should be a convergence of factor prices between countries. The historical problem is that, when we look at the massive migrations of the 19th and 20th centuries, both of these economic trends occurred. The international flow of goods and services and the increased flow of labor were not substitutes, but complements, in the process of economic growth. Although far from complete, both the convergence of real wages and that of commodity prices were the hallmarks of the increased globalization.6
International migration was also accompanied by a flow of capital. The countries of Argentina, Australia, Canada and the United States, for instance, borrowed massively from Europe in the long 19th century (to World War I). Much of the capital originated in Britain and was financed out of the positive balance of payments on current account. In turn, a large share of this capital was used to finance expansion of the transport infrastructure – particularly the large, transcontinental rail projects in these countries – and the growth of cities and towns. In North America, rail expansion onto the Great Plains and Prairies brought huge amounts of land into production. The expansion into Russian Siberia also brought new agriculture and new settlement as a result of an eastward expansion. In other areas such as Europe, China, India and Africa, railways encouraged new and higher productivity uses of land. Throughout the main phases of demographic transition, land, far from being a fixed factor of production, was rapidly expanding at the extensive margin, as were capital and labor. The demand for labor was shifting upward (outward) causing the wage convergence to slow down (if not reverse itself) from time to time.
5.2 Who’s In and Who’s Out
Historians face a difficult problem, one that persists even in today’s world, and that is counting the numbers who entered into the international migration streams. For the period before the modern age of record keeping, which we may date to the mid-19th century, all counts are based on the ingenuity of historians using local historical knowledge, shipping and port records, military records and incomplete censuses.7 The reason such censuses exist is the same that the Romans used: to determine who is to be taxed and to have a ready roster of (loyal) fighters available for local duty. Even when record keeping became more thorough, the count of immigrant arrivals was still incomplete, missed counts and “illegal” immigration notwithstanding. Also, countries were generally more concerned about the people who entered than those who left. Even today most countries do not have a formal process of counting permanent departures – the emigrants. (Modern OECD governments go to great lengths to estimate, not count, the emigrants through tax records, government benefits records and the like.) Unfortunately, for the counters, we only have a census at regular fixed intervals to verify the numbers (see Chapter One). By comparing the censuses over time, we measure the change in the size of the population. New population additions are made up of those born and new immigrants, both of which can be counted by the census. There are only two exits. The first is death, which we can also count from death registration records. The other is emigration which becomes the residual, balancing number. Of course, we have to account for those who are born and new immigrants who have been registered between the censuses in one country and then either die or migrate to another country.
Table 5.1 Region of Birth of the Foreign-Born Population of the United States: by Percentage, 1850 to 1930 and 1960 to 1990.
Source: US Bureau of the Census (1999) The Foreign-Born Population of the United States, Table 2, Internet Release, 9 March 1999.
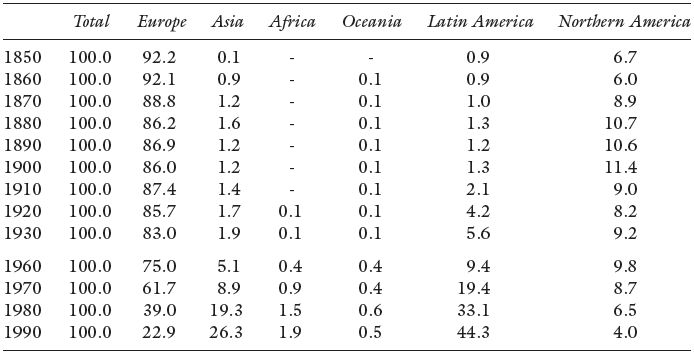
Every emigrant should be an immigrant somewhere. Unfortunately for the historians, there was not a systematic way in which immigrants were recorded. For instance, if we try to account for the substantial emigration from Canada by looking at the immigrant counts in the US (we know that overwhelmingly Canadians migrated to the US prior to 1945), the numbers are not even close. A Canadian may have been born in the UK, carried to Canada by its immigrant parents, spent almost their entire life in Canada, and then as an adult emigrated to the US. When that person entered the US, he or she was recorded as an immigrant from Britain because of their place of birth. Each country had its own standards and thus immigrants were recorded by some as: from their place of birth, last country of residence, last country of permanent residence, or citizenship. So the historical US records of immigrants will only note those who were Canadian-born and not our imagined British-born Canadian emigrant. Modern records are more complete (see Table 5.1).
The flow of immigrants on a year-to-year basis contributed to the stock of immigrants measured in the censuses. Thus countries have a stock of immigrants that reflects the cumulative inflow of past immigration, net of deaths and departures. The stock is defined to include anyone living, no matter what their current citizenship, who once had been an immigrant. Thus, the Canadian and Australian immigrant stocks are dominated by the British and Western Europeans, despite the fact that most of their immigrants in recent years are of Asian and South Asian origin. It takes time for the stock to adjust, but it will do so more rapidly in the near future as the British immigrant stock is an elderly one. Until recently (the 1980s) the same was true of the US where the stock of immigrants was largely of European origin. However, the flow of immigrants to the United States has recently been dominated by Latin Americans and Asians, and is of such numbers, that it has overwhelmed the stock resulting from the immediate post-1945 immigration boom which was largely European.8
5.3 Migration of the Unfree
During the US colonial period (1607–1775) there were over three-quarters of a million immigrants. A full 72.2 % of these immigrants came in some form of bondage – see Table 5.2. Black slaves from Africa were by far the most numerous, but there were also convicts, prisoners and indentured servants mostly from Britain. The free voluntary immigrants to Colonial America accounted for only slightly more than a quarter of the total in the years leading up to the American Revolution.9 But North America (including the Caribbean) was far from the only destination of the unfree: South America accounted for the largest number of transported African black slaves leaving an indelible imprint on the population. Prisoners and convicts were also shipped to Australia, but at a different time.
A. Slaves
In pre-modern history slavery was a relative common condition. Most ancient peoples kept slaves. Slavery could be a perpetual condition and inherited by children or it could be limited to the lifetime of the individual. The Persians, Greeks and Romans typically enslaved those whom they conquered. These were not necessarily different people, just enemies. The original purpose of slavery was to remove a population from its home (and source of income) so that it could not take up the conflict again. However, slaves also provided labor that did not require the payment of wages, but it was not costless. Classicists insist that slaves were a consequence of war, not a cause of it. While this may be true, the ratio of slaves to freemen in ancient Athens was at least 2 to 1 and maybe as much as 3 to 1. This suggests that replenishment of the stock of slaves was necessary from time to time to maintain it at existing levels. As the conquests became more distant from the homeland, the enslaved were naturally more distinct in terms of customs, languages and religions and could be regarded as inferior. Therefore, in the eyes of the enslavers, their condition was justified. The Romans shipped large quantities of slaves from the periphery of their empire to Italy to work the stone and salt quarries and row in the galleys (ships). But, the Romans also employed slaves as domestic servants and, on occasion, in highly responsible positions. Greek slaves were particularly prized.10 As empires expanded more and more, slaves were transported long distances and became an important element of the human migratory stream.
Table 5.2 Immigration into the US during the Colonial Period by Legal Status and Condition of Servitude.
Source: Adapted from Fogelman (1998), Table 1.
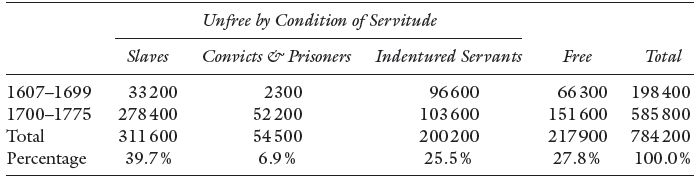
NB: rounded to the nearest 100.
Includes political exiles and kidnap victims as prisoners.
From the 9th to the 18th century, for instance, people were rounded up in the Caucuses and Eastern Black Sea regions and sold into slavery. They were then marched to various points of the Islamic empire. Known for their fighting ability, the captives were compulsorily converted to Islam and mustered into the armies of the caliphs. Clearly an incentive was needed and that was a promise of freedom (manumission) at the end of their period of service. The Mamluks, as they were known, became a formidable fighting force sometimes supplementing armies of non-slaves and sometimes being the entire fighting force. Originally mustered by the Assabid Caliphs of Turkey, they frequently assumed local power themselves after the caliphate collapsed in various regions as far flung as western India to Egypt. In Egypt, the Mamluks became the ruling elite in the 13th century and held power for 300 years in Cairo, all the while continuing to purchase more Mamluks (in the tens of thousands) for their armed forces.11 The Mamluks were renowned for the defeat of the Mongol armies in 1260 – clearly they were slaves of a different sort.
Yet there is nothing in the sad history of the institution of slavery to compare to the massive movement of black slaves from Africa to the Americas. Where it existed in the new world, it was generally profitable and an economically viable institution.12 Slaves were principally used as manual labor in the tobacco, rice, sugar and cotton plantations of the West Indies, South America and what became the US. As such slavery existed until the middle of the 19th century. However, the trade in slaves, as distinct from their ownership and use, was made illegal in the early part of the century due in great measure to the highly charged campaigns of the English reformer William Wilberforce. These campaigns aroused public indignation on both sides of the Atlantic. As a result, Britain passed the Abolition of the Slave Trade Act in 1807 although slavery itself was not made illegal in Britain and its Empire until 1833. In the year following the British 1807 act the United States legislated:
Be it enacted by the Senate and House of Representatives of the United States of America in Congress assembled, That from and after the first day of January, one thousand eight hundred and eight, it shall not be lawful to import or bring into the United States or the territories thereof from any foreign kingdom, place, or country, any negro, mulatto, or person of colour, with intent to hold, sell, or dispose of such negro, mulatto, or person of colour, as a slave, or to be held to service or labour. [original spelling].
[Public Statutes … of the United States of America, Statute II, Chap.XXII, 2 March 1808.]
But, only the end of its Civil War in 1865 brought an end to black slavery in the US.13 Spain and Portugal finally agreed in 1815 to the abolition of the slave trade within five years. France temporarily outlawed slavery at the time of its Revolution, but slavery was reinstated and lasted there until 1848. Likewise, Holland did not ban the holding of slaves until the 1840s. It has been estimated that altogether approximately 9.5 million individuals were transported as slaves from Africa to the Americas from the 17th to the early 19th centuries.14 Most slaves were destined for the West Indies and Brazil. A minority went to the other South American countries, and only about 10 % of those were landed in the British North American colonies (as distinct from the British West Indies) and later the US (see Figure 5.2). The journey to the Americas from Africa has been the subject of much historical inquiry just as it was a highlight of the Wilberforce abolitionist campaigns: the wretched conditions of transport by sea, the over-crowding and unsanitary conditions. While the abolitionists of the day evoked tearful sympathy describing these conditions, the voyage characteristics were actually fairly similar to those experienced by the crews and fare-paying passengers. Of course the slaves suffered indignities that the fare-payers did not: the degrading human bondage and rape of female slaves. But, there were actual incentives for the slavers to keep the slaves alive and healthy as the value of the slave was realized at the end of the voyage. The carrier with fare-paying passengers had no such incentive which, at the margin, might reduce mortality on the voyage. Certainly, the Middle Passage, as the various mid-latitude trans-Atlantic sailing routes from Africa to the Americas were collectively known, never produced the high rates of mortality experienced in the North Atlantic during the Irish Famine years of the late 1840s (see later).
Figure 5.2 Import of Black Slaves to the British West Indies, British North America and the US, 1630–1800.
Source: data from Carter (2006), US Historical Statistics, Table Ad3–15.
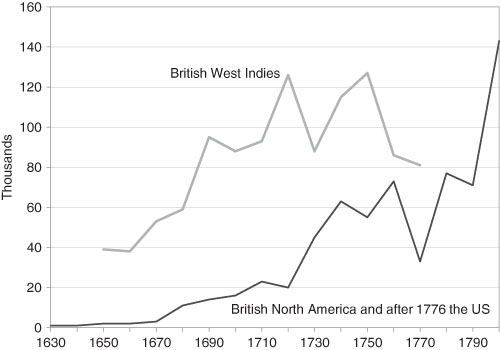
Note: British North America includes only the British Colonies that became the US.
In general, the mortality of slaves on the Middle Passage declined from the high figures in the 17th century at about the same rate as the deaths of immigrants on the North Atlantic – from about 16 % in the late 17th and early 18th centuries to rates about 7.7 %.15 A large part of this decline was due to the decreased length of voyages, the increased efficiency of vessels and the scale economies of slave gathering – the latter made voyages shorter as ships no longer undertook coastal cruises to pick up slaves at the various way points. Some routes on the Middle Passage continued to be more dangerous in large measure because of their long voyages. By only measuring the mortality on the voyages we overlook the long period of captivity before the trans-Atlantic shipment.16 We conjecture, in the absence of quantifiable evidence, the mortality in this period was high. If the deaths before leaving Africa were equal to those on the voyages, the slave migration in total probably killed one able bodied male for every three enslaved. The toll may have been higher among women and children.
B. Convicts and Indentured Servants
Apart from slavery there were other forms of migrant bondage, although not ones that usually resulted in a permanent alienation. From time to time in the 17th century prisoners and convicts were sent from Britain to the British North American Colonies (later to Australia). The object was simple: remove the most troublesome of British society, a classic push force. James Butler, a late-Victorian historian, noted that many of these were political prisoners including those captured in the English Civil War, Cromwell’s Wars against the Scots and the Irish, and the various uprisings of the period.17 However, in 1718, in the aftermath of the Jacobite Rising of 1715, the policy of shipping undesirables to the colonies became systematic in English law; the passing of the Transportation Act permitted such a sentence.18 Most of those transported were serious felons having committed more than one offence. A significant minority was guilty of capital crimes such as counterfeiting, kidnapping, highway robbery, manslaughter and murder. There were about 160 crimes punishable by death, but an individual might be allowed to live on condition they transported themselves out of England. Capital crimes, when leniency was exercised or a pardon from the death sentence was granted, were typically punishable by a seven-year, a 14-year or, on occasion, a life sentence. The labor service of the convicts and prisoners were auctioned off in the colonial markets. Since convict laborers could return to Britain at the conclusion of their sentence, and runaway convicts often made it back as well, it is uncertain how exactly they added to the population. Most who had served their sentences probably stayed in the colonies, albeit in a different area than their penal service. Because of the social odium, they sought out the anonymity of the frontier or the growing towns. Once their sentences were complete, the ex-convicts were no more likely to be guilty of offences than the general population.19 Although most colonies received shipments of prisoners (and there were objections to them in several colonies), the favored destination was the tobacco-growing areas, particularly Maryland, Virginia and the Carolinas.
With the Revolution the transportation of convicts to the US came to an end. However, the role of recipient was quickly taken up by Australian penal colonies, Botany Bay and Van Dieman’s Land. They were different from those of America in that they were established in a land with very few free immigrants in the early settlement period – and many of those were government officials who did not remain. The result was the transported prisoners contributed more to the growth of the Australian population than prisoners had to that of the US. In the 1820s more than half the Australians were prisoners-bondsmen. Even by 1841 over 20 % still were in bondage – new shipments and those serving out their terms.20 This does not include those who completed their sentences and remained in Australia.21 Nor does it include the children of the original prisoners, and their further progeny. Perhaps the large number (and proportion) of the population that originate from convict labor accounts for the Australian retrospective pride in these tough antecedents.
Unlike the case of the North American colonies where there was a ready demand for labor as household servants and agricultural workers, there was no such exuberant demand in Australia. Wasn’t the transportation of prisoners halfway around the world not a rather expensive way of getting rid of the troublesome elements, especially if there was little existing demand for their services? With the loss of the Thirteen Colonies there were few alternative places to send convicts that were relatively secure. Plus, there was another motive. Britain was in the throes of rebuilding its empire, and peopling the continent with British folk, albeit the more desperate ones, was part of the strategy.
Indentured servitude was the device developed to increase the migration of white European workers to the labor-short North American colonies. Almost as many people arrived in the colonies as indentured labor as arrived as free citizens. Researchers have documented how well-organized the markets were for indentured servants.22 An individual would contract with a ship captain or merchant to work for a specified number of years (usually between four and seven) in return for transportation across the Atlantic plus specified payments (usually food, clothing, housing, or perhaps some education or training in a craft or skill). Also specified was an amount of money or land to be paid when the contract was successfully completed, largely to help assure that the contract would be successfully completed. There was a good deal of bargaining between potential servants and those contracting with them. The holder of the contract in England paid the cost of the trip. When the ship arrived in North America, the contracts (and the people) were sold, usually onboard the ship. The purchase price, which depended upon the servant’s age, sex, and skills, was equal to the realized cost plus about a 50 % markup.
When the colonies adjoining Chesapeake Bay first discovered that crops were most profitably grown under a plantation system, the demand for indentured servants soared. A sample of over 20 000 indentures taken from surviving ship records suggests the majority chose to go to the Chesapeake. These individuals were predominantly young males in their late teens and early 20s who were farmers, artisans, (unskilled) laborers, and domestic servants.
For example, Walter Gibson, a ship’s master and merchant of Glasgow, published a broadsheet in 1683 in which fares for the voyage to Carolina were listed at £5 per adult. Once settlers had reached the colony each was eligible to apply for 70 acres of land from the colonial government for a fee of one penny per acre. There were terms, not onerous, that had to be fulfilled. But there was another pitch in this advertisement:
To such as are desireous to Transport themselves to the said colony of Carolina, and are not able to pay their Passage; If they be Tradesmen, who have past their Appentiship in any Handy-craft; The said Walter Gibson is content to Transport them on his own Charges, they obliging themselves to Serve him three years, during which time he will furnish them sufficiently with Meat, Cloaths and other necessaries. At the issue of the time of their Service, they are to have settled upon them and their Heirs from the Government, each of them fifty Aikers of Ground, they paying one Penny Sterling per Aiker yearly … [Original spelling retained.]
Gibson (1683), Proposals, 1.
Each person in the family, including servants, was eligible to receive the same land allowance. Folk without a trade had to serve Gibson for four years and settlers under 18 had to fulfill a service period of five years but were able to apply for the same land allocation on the same terms.23 Indenture contracts had status in courts of law, and servants could appeal to the courts for violations of their rights.24 Once the indenture was completed, the former servant was a member of the free population; children born of indentured servants during servitude were born free.
A related group was known as redemptioners. Most came from Germany and had a slightly different status than the English indentured servants. While English servants usually came over alone, the Germans came in families, bringing their own supplies and movable property with them.25 The ship captains that brought them generally allowed them time to arrange payment for their passage after arrival.
The rather abrupt shift from reliance on white servants to black slaves at the turn of the 18th century was attributed to the wars of King William III and, especially, those of the reign of Queen Anne. These wars reduced the supply of prime-aged males, which in turn reduced contract lengths, thereby increasing the effective price.26 With the return of peace, the market for indentured servants revived, but not to its previous numbers. On average, black slaves cost more than white servants because their “contract” to the buyer was for a longer time period. Thus, slaves tended to be more profitable to those involved in their transport and initial sale.
European immigrants wanted land for themselves, and there was unlikely to be a sufficient supply of indentured servants to meet the labor demand in the South. Although Virginia and Maryland were major destinations for indentured servants in the 17th century, by the 18th century, when potential servants had more choice, they chose to avoid the Southern colonies. Why this was true is not entirely clear. Most 18th-century white immigrants went to Pennsylvania where land was readily available and the institutions were liberal. But the same could be said of Virginia. The temperature-humidity mix of the middle colonies was as oppressive as that of the southern ones. Jefferson’s comment that, “In a warm climate, no man will labor for himself who can make another labor for him,” is just as true for residents of other climates.27 The fact that the South has warmer winters than the North should have made it attractive to Europeans. Further, if wages were high enough, they could “make” others labor.
Near the end of the 18th century, white servitude was declining in competition with wage labor. In the free market, white skilled workers were able to negotiate wages that were higher than the comparable real income derived from a contract of indenture. The rising demand for labor drove up the price of non-free white labor compared to that of black slaves leading to a decline in servitude. Nonetheless, in 1787, when the US Constitution was being written, white servitude still had to be taken into account, and it lingered on. A study of German redemptioners concludes the end came about 1820.28 Only 18 indentured servants arrived in 1820 and only 19 in total during the following 10 years. Most of these were children.
Concurrently, US judges began to refuse to imprison people for debt. If the indenture contract was not enforceable, it lost value. Negotiated wage contracts were more efficient, and any break by the employee before the contract expired released the employer from the obligation to pay wages.29 The other obligations of indenture (e.g., room, board, clothing, medicine, education in a trade, and payment at the end) did not apply to wage labor. However, as indentures disappeared, turnover costs increased, especially for employers who required more labor than their families could supply. When the cost of searching for workers and the cost of going without labor during a critical period was high, employers (i.e., Southern plantation owners) were attracted to slavery to mitigate these costs.30
C. Child Migrants
There were other forms of near bondage in immigration history, although few were as touching as the case of the “home children.” Beginning in the third quarter of the 19th century, there was a philanthropically inspired and managed movement of children from Britain to the “white” colonies and dominions. The home children were orphans, abandoned children, and other impoverished youngsters from Britain. Under the supervision of guardians, they were collected from the orphanages and shipped to Australia, New Zealand and Canada. The children were often referred to as “Barnado Children” after the principal charity active in securing better lives for the youngsters. It was classic Victorian “do-goodism.” The scheme continued in operation into the 1930s (we have abundant details from the shipping records.)31 For the most part, these children were sent to the farming districts of older settlement, those districts where the fertility rates were low because of the aging population – as seen in Chapter Four. In total, somewhat over 100 000 children were shipped from Britain to Canada under this scheme. Some of these children did indeed enjoy better lives. They were given some education, tutored in farm and domestic skills, and were more or less adopted into the family to which they were sent. Others were sent to farms where they were treated as chattel labor under brutal conditions. It was, at best, a scheme with mixed human results. Surprisingly, a similar scheme between Britain and Australia was instituted after the Second World War and lasted until 1967. It too had very mixed results.
5.4 The Atlantic: Waves of Immigration
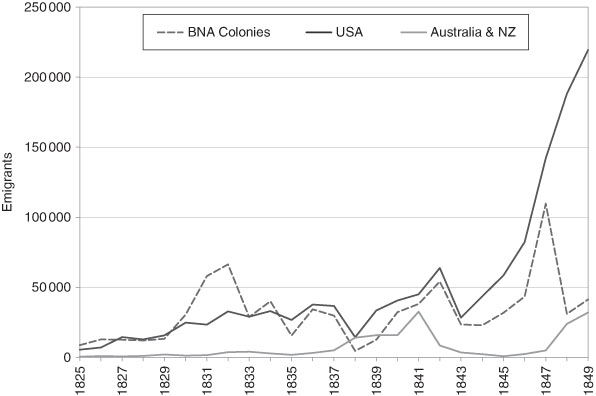
The years between the American Revolution in 1776 and the defeat of Napoleon in 1814 were ones of turmoil in the international trading economy and the small, but steady, flow of trans-Atlantic migrants was similarly interrupted. With the restoration of peace in the early 19th century the trans-Atlantic component of international migration grew to such unprecedented heights that economic historians have labeled it the “age of mass international migration.” Between 1815 and World War I approximately 55 to 60 million moved from Europe to North and South America.32 The flow of immigrants into North America in the decade after 1815 was initially much the same in character as in the 18th century: they came mainly from England, Scotland, Wales and Ireland with a sprinkling from Germany. But the volume was different, higher. Depression in British agriculture, demobilization of the armed forces, the re-alignment of British industry to peacetime conditions, and growing urban unemployment caused massive dislocation. While the fall in the cost of passage played a role in making emigration from Britain more attractive than earlier, it was the capacity that the ships now offered that made mass movement possible. Between 1825 and 1850 more than 2.25 million British emigrants left for the British North American colonies and the US – see Figures 5.3 and 5.4. These included the many Irish who left what was then Great Britain and Ireland (see Diasporas later in this chapter).
Immigrants Arriving at Ellis Island for Processing
Much of the great flood of pre-1914 Migration to the United States entered through the Ellis Island Immigration Station.
Source: Detroit Publishing Company Collection, Library of Congress, Prints and Photographs Division Washington.
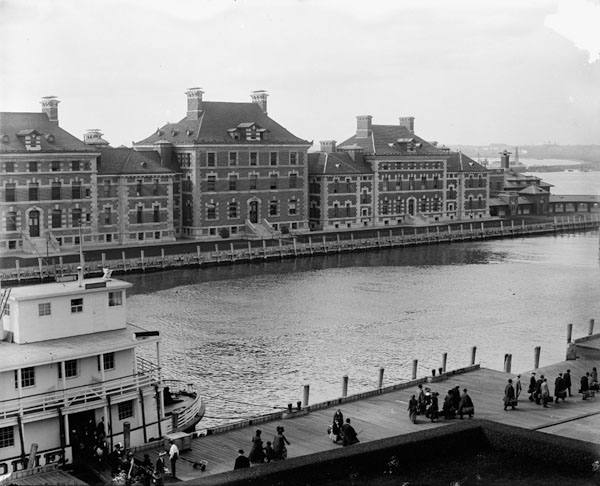
Figure 5.3 Annual Emigration of the British by Destination, 1825–1849.
Source: Colonial Land and Emigration Commissioners data from The Illustrated London News, Saturday July 6th 1850.
BNA Colonies: Upper Canada, Lower Canada, Nova Scotia, New Brunswick, Newfoundland, and the British West Indies.
The emigration from Europe to the “New World” had its distinct ethnic characteristics. In the years before the US Civil War the sources of immigration expanded to include a large flow of Germans whose instincts to enter the migratory stream were heightened by the unsuccessful Revolution of 1848 and its chaotic aftermath. At about the mid-century mark, the now substantial flow accelerated. The Germans were followed by the Scandinavians. As the century wore on the western Europeans were joined by, first, the southern and then the eastern Europeans. By the beginning of the First World War, the majority of immigrants were non-English speaking. The broad features of this migration were shared with British North America (Canada) but with different timing. The Spanish and Portuguese also entered into the trans-Atlantic migration, but they went principally to South America (Argentina, Chile, Brazil and Uruguay). Spanish emigrants in particular rejected the lure of the US, but, drawn by culture and language, they preferred the Latin south (98 % of all emigrants prior to 1914).33 But many Italians and British also added to this flow, especially that to Argentina and Chile. The Italians had specific geographic preferences that changed quite dramatically about 1900. From 1876 to 1900 for every Italian who went to North America more than two found a home in South America. From the turn of the century to the First World War, however, the flows changed destinations with 2.4 Italian immigrants now going to North America for every one going to South America.34 This changing flow mirrors the changing pace of economic growth in the respective hemispheres.
Figure 5.4 Emigration from Europe by Decade, 1851–1960.
Source: Mitchell (1998) International Historical Statistics: Europe, 129 – see General Sources.
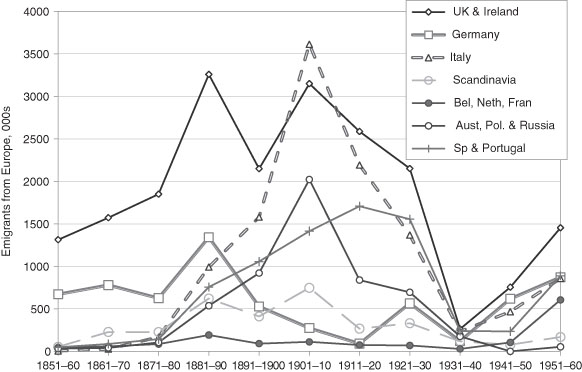
Notes: Figure refers to emigration to countries outside of Europe. Scandinavia is: Denmark, Finland, Norway and Sweden. Germany after 1941 includes only West Germany. Netherlands excludes emigration to the Dutch Overseas Colonies. The UK figures date from 1853 and until 1870 excludes the direct emigration from Irish ports. Some of the data that overlap World War II are truncated.
Immigration to “lands of new settlement” before 1914 has often been viewed by historians as happening in distinct waves, most importantly by Brinley Thomas and Arthur Lewis.35 Since these waves can be characterized by the new groups entering the migratory stream, sometimes as a majority, they raise a critical question: why do they become trans-Atlantic migrants in numbers at a particular period or date? The answer, anticipated earlier in this chapter, is that the historical process is dependent on dislocation in the home country. In some cases, the dislocation was caused by calamity. Most usually, however, it came about because of newfound economic strength in the home country, albeit modest. If the home economy is a traditional one with little change in the structure of employment, by industry, only a few individuals, at the margin, will become migrants. When, however, the home country begins to industrialize, there is an internal reorganization of labor markets in response. Labor moves from the traditional economic activity to the expanding sector. Attracted by higher wages reflecting a higher marginal product of labor, the workers must relocate within the country to take advantage of the higher income possibilities, rural-urban and inter-regional migration. There is a long-standing debate among economic historians about whether emigration and internal migration are positively or negatively related. The evidence largely supports the positive relationship.
Information, too, begins to flow more widely and abundantly. Shaken from their traditional roots in agriculture or low-productivity industries, labor becomes more open to the prospects of international migration. International migration was very often a two- or multi-stage process. So, for example, we find the Italians cast themselves into the international migratory flow just as the Italian economy shows signs of economic reorganization and real income per capita growth in the late-19th century. Thus, the background conditions of the waves of trans-Atlantic migration were the emergence of modern economic growth in the home countries. Waves of immigration, however, cannot go on with the same or growing intensity. It is the home economy “wage effect” that puts on the dampers. Real wages at home reacted to the loss of labor through immigration; they also responded to the continuing change of the structure of the economy in the home country.36 The international migrants expected the real wage differential between the donor and host countries to narrow.37
For potential immigrants, the attractive forces of North and South America in the years before 1914 did not send out steady signals. The frontiers were expanding westward. The frontiers drew in-migrants, both domestic and international. Some responded to the free farm land or its low price. After the US Civil War was over the provision of the Homestead Act (passed in 1862) had effect, and there was a flood of migrants to take advantage of its grants of free land. The US and Canadian railroad (railway) companies actively promoted the land they acquired from their governments.38 The Canadian frontier settlement lagged behind the US expansion by about three decades (and this fact was itself instrumental in the cycles that were generated). However, the gains (economic rents) were not simply in agriculture. They were in mineral industries and in processing the products of agriculture (meat packing, grain milling) and, importantly, shipping. Transport was one of the keys to the westward expansion, a necessity to exploit the frontier gains. The US and Canada built canal systems, the most significant were the Erie Canal and the Welland Canal, in each country respectively. The Erie linked the western regions, of the day, to the main export market in New York. The Welland linked the western Great Lakes to Lake Ontario and the St. Lawrence River and the Oswego Connector of the Erie. Canal building was replaced in the 1840s and 1850s by railroad (railway) building, and after the US Civil War the rail network became a trans-continental one. The relevant feature, for our purposes, was that canals and railroads were massive undertakings that were by their very nature “lumpy.” They sucked in labor, and other resources, for the construction period and then had little further need of them. On-going labor demand was for the operation of the transport network and farming. But most immigrants did not go to the farm-frontier areas, although many did: they went to the manufacturing and service centers that prospered because of the growth brought about by expansion.
Immigrants tended to be young. This (net) flow of immigrants added to the population of the receiving countries in ages typically associated with family formation and child-bearing. It has, as we have seen, the opposite effect on the immigrant-sending or donor countries. The historical pattern of fertility in those countries receiving immigrants was, in general, higher as a result of the changed age-structure of the population, now biased toward the young. (No country which began to receive the immigrants in the 19th century had yet entered the low birth and low death rate phase of the demographic transition.) Where these immigrants located geographically in the economy also mattered. Naturally, this was determined by the demand for the skills that the laborers supplied. Even within a country, as we have seen, both fertility and mortality were sensitive to location, especially at the level of the most basic distinction of place, rural and urban.39 Thus, in an historical sense, it is not realistic to view the demographic transition separately from the flows of new (net) immigrants.
During their transitions from an agricultural to manufacturing- and service-based industry many economies achieved an extraordinary high level of investment. The high investment rates propelled the transition at a more rapid rate than otherwise possible. Since these investment rates were well beyond the capacity of domestic savings to finance, capital inflows provided the difference. A capital inflow is nothing more than an international transfer of savings and was often linked to another transfer, the transfer of human resources. When these two flows happen together in significant amounts the capital flow is said to be “population-sensitive.” The massive flow of immigrants to the expanding “new” world economies, from the “old” world economies of Europe, in the 19th and early 20th centuries also witnessed an unprecedented flow of capital (savings) in the same direction. Each flow was a response to the higher rewards expected in an economy that was expanding more rapidly than another. Yet human and capital flows are not always found together. Much, it appears, depends on size. Small marginal benefits may be sufficient to attract financial arbitrage and result in an import of capital but insufficiently large to cover the transactions costs of human migration or open the wage differential. So we frequently find that capital flows are not directly “population-sensitive.” Foreign direct investment, for instance, where capital flows are designed to overcome barriers to trade and labor flows, is another example. (Foreign direct investment is investment by firms and usually takes the form of setting up manufacturing plants and distribution facilities.) The (savings) capital flow is actually a substitute for the inhibited labor flow in this instance. In the years before the First World War, international flows of labor and capital often occur together but we should not be surprised when there are exceptions.
The international migrants carried their savings and any movables with them as property when they migrated. The balance of payments name is cash and settlers’ effects. Important as these are to the individuals, however, they contribute only a small percentage to the net capital flow. But from the migrants’ point-of-view, this was a vital flow. The success in establishing themselves on a farm, in housing or in business or a profession often depended on this endowment brought to the new land.
Quantitatively more important from a balance of payments perspective was the transfer of demand into the country whose wage rates induced the immigration. To explain this we must remember that non-tradable goods made up the greatest part of consumption. Housing, school services, medical and educational services can normally only be produced and consumed at the point of residence.40 Young immigrants (remember that youth is their principal demographic characteristic) moved their demand for housing from their home country to their new country. This further spawned a demand for social infrastructure, much of it urban. For instance, even when the western farm sector was expanding most rapidly in North America of the 19th century, the population of the urban areas in the east was expanding even more rapidly. The needed infrastructure included water and sewage systems, roads, urban lighting (both gas and electricity), railroads and urban transport systems and the like. Immigrant-receiving countries were mostly current-account deficit countries in a balance of payments sense. That is, they typically imported more than they exported. The US, Canada, Australia, New Zealand, South Africa, Argentina, Chile, and Brazil were all countries with this immigration and balance of payments profile.41 During the Victorian era and up to World War I, they were all exporters of primary produce (grains, cotton, cattle and meat products, other farm produce, timber, minerals, and coffee). These net current account deficits were offset by capital account surpluses – think of this as an export of bits of paper, the paper representing the debt instruments such as bonds – as the overall balance of the international accounts is zero. Thus, when we look at the security placements in the world capital markets, dominated by Britain until 1914, they overwhelmingly represent the social overhead capital projects either directly or indirectly through national, provincial, state and city government debt.42
The overall timing of the capital inflows corresponds to the pace of the domestic restructuring. The faster the transition of the share composition of industry, the higher the rate of investment and the higher the reliance on imported capital (savings). Of course, there is circularity in this reasoning as one feeds on the other. What set these forces in motion were the great opportunities for rents in the “new” economies. By the same argument, it is the diminution of the economic rents that slows down the boom – the lumpiness referred to earlier. Over the course of the boom we find large immigrant flows and population-sensitive capital flows. As many historians have observed the pace of economic development (real GDP growth) in these new immigrant- receiving countries, and particularly the capital imports, has a cyclical quality. Not surprisingly, savings transferred to the expanding economies was at the expense of domestic investment in the home country. So too, was the imbedded human capital that we today call the ‘brain-drain’.43 Particularly after about 1850 when world commodity and capital markets were more integrated, the typical cycle was about 15 to 25 years in duration (the Kuznets Cycle). Kuznets Cycles were unique to the years between the early Victorian age and the outbreak of World War I.44
5.5 Unbalanced Cargoes
Prior to the 19th century, trade on the North Atlantic was carried out in relatively small ships. While there had been some growth in the size of vessels over the course of two centuries, the average 18th century Atlantic trading vessel out of Philadelphia was still less than 200 “measured” tons.45 The exports they carried from North America were largely tobacco, rice, wheat and flour, indigo, dried fish, and naval stores (specialized lumber, rope, tar and pitch, and turpentine). Ships clearing Caribbean ports in Jamaica, Grenada and Antigua tended to be a little larger as they carried goods such as raw sugar, molasses and rum. The goods shipped from Europe westward across the Atlantic were manufactured goods and specialized foodstuffs such as spices and, famously, tea. However, relative to the goods carried later, most eastbound cargoes, tended to be of high value relative to their bulk.
Yet, in the early 19th century, there was a revolution in shipping led by the demand for ships to carry low value, high bulk goods on the eastward voyage across the Atlantic. Once the political troubles between the US and Britain were resolved in the aftermath of the Napoleonic Wars, the US became a major shipper of cotton and wheat. Somewhat earlier, British North America (Canada, New Brunswick and Nova Scotia) became Britain’s woodyard, to use Arthur Lower’s well-worn phrase.46 Shippers responded by becoming more specialized, expanding vessel size, and increasing the number of ships. The average size of a sailing ship landing at the port of Quebec in 1800 was less than 150 registered tons. By 1851 it had risen to over 400 tons.47
The rise of the average capacity of the Atlantic fleet created a problem of unbalanced cargoes. The westbound voyage could not generate a similar volume of high value/low bulk traffic leading to what Harold Innis called the problem of unused capacity.48 He raised the questions – which he answered correctly – what price to charge on the westbound voyage for the space and what would occupy it? The solution was to carry immigrants and price the space using marginal cost principles. The increase in the supply of passenger travel space forced the price (cost to the immigrant) down. Most historians date the beginning of the age of mass trans-Atlantic migration to the immediate post-1815 years, the time when the price of westbound space declined significantly. The lowest quality passage, steerage class, was about £5 (approximately $ 24US) for the westward voyage in 1820s from Liverpool to Philadelphia. While this was about the same nominal fare being charged in 1684, in real terms (relative to the rise in average earnings) it was about one-third.49 Fares on the ships offering the poorest quality of steerage class, the timber ships, charged even less.
But passenger transport also became more practical as ships became larger and more efficient. Voyage times became shorter and more predictable, also contributing to the decline of cost per voyage. By the 1840s the new steam ships appeared. At first, the technology was applied to sailing ships as an auxiliary source of power – see Figure 5.3. Later, with the further enhancement of engine efficiency, exclusively steam-powered ships appeared. They were capable of meeting a relatively rigid time schedule and reaching more ports in Europe. For instance, in 1847 the first regular sailing by direct route to a continental European port, Bremen, was established by the SS Washington out of New York (an auxiliary). The demonstration of the latent passenger demand further spurred the development of specialized, fast ships to transport passengers and the mail. Passenger fares on the packet ships from Liverpool to Philadelphia fell to less than £3 10s by the mid-19th century, and declined further by the end of the century.50 By this time there were regular voyages of steamships devoted to passenger traffic – the precursor of the modern ocean liner. These ships were also capable of filling the hold with other goods such as wheat and cattle on the east-bound voyage.51 The unused capacity problem did not disappear in the bulk trades however, and many immigrants, but now a minority, in the late-19th century still took the trip in the old-style sailing vessels. By the beginning of the 20th century, however, sailing ships as passenger vessels had largely disappeared. The reduction of the barrier of the high fares on the trans-Atlantic passage was one of the many reasons for increased international migration.
The increase in passenger volume led in the early 19th century to the development of a European network of sea shipping routes, opened as feeders to channel passengers to the ports serving the US and Canadian migrant traffic. By mid-century, the growth of railway networks further linked places remote from the sea to the ports. The catchment area of potential migrants expanded enormously as the price of land transport fell. To a contemporary in mid- to late-19th century Europe, it must have seemed that the whole continent was on the move.
5.6 Information and Advertising
Information about costs and benefits of relocating was the key to the decision to become an immigrant or not. It had two dimensions: quantity and quality. Prior to the 19th century this information was typically modest in quantity and of uncertain provenance. It was only slowly transferred from the individuals in the host country to those in sending countries and within the latter area disseminated in an idiosyncratic manner. Furthermore, there is a ubiquity factor: the more people talked about America or Australia or South Africa the more people were open to the idea of emigration to these places. The Chinese who came to the west coast of North America in the 19th century were told stories at home of the “Land of the Golden Mountain” just as the Irish fed themselves on the myths of New York and Boston. Of course, the myth might just be that, a tall story. But it was a story that was widely spread and so came to be believed in some measure. However, for emigration to take place on a systematic basis the information had to pass a quality test of reasonableness and experience. Folk who signed on with Walter Gibson certainly had good information as far as it went. But they may not have fully comprehended the conditions under which they would serve, probably in the tobacco fields of Virginia. Part of the 19th century revolution in the technology of transport was the more rapid spread of information. Facilitated by a greater speed, variety and ease of communication (newspapers, telegraphs, the trans-Atlantic cable and international postal services) this meant a greater reliability about the information both by virtue of timeliness and source. This was particularly vital in reporting about labor market opportunities and the prospects for settlement. Information from distant locations fell in price and improved in quality and both gradually enlarged the catchment area of possible migrants. Alas it was also true that the new communications gave rise to advertising and persuasion some of which was hugely misleading. Thus, some of key elements promoting the international, and internal, mass movement of people came into being. Now, letters could be sent home regularly at low cost in which the personal fate of the past immigrants could be assessed by the potential emigrants. The high time-cost barrier was systematically reduced.
Indeed, one of the best predictors, in an historical sense, of where the immigration would come from was the stock of immigrants already in place, at least, when the flow was increasing. People informed one another, spoke of the benefits, spoke of their difficulties and even conveyed vital labor market information.52 Thanks to the exhaustive research of Simone Wegge into the social networks of German migrants in the mid-19th century, we know more about these processes and how they worked. In predicting, retrospectively, who might enter the migratory streams, family ties were very important, as were the close ties associated with the villages from which they came. Further, she found that the links were acted upon fairly soon after the first family member established themselves in the US, although some family networks operated for at least a decade. The village-family networks lasted much longer.53 The case of immigrants coming from Hesse-Cassel was not unique: “If you come to Boston, I can arrange a job on my worksite.” In addition, successful immigrants remitted cash to their homes which helped to finance (through grants or loans) the next generation of immigrants. These are known, in a balance of payments sense, as “immigrants’ remittances.” This flow of cash was accompanied by an equally vital flow of subtle information, largely immeasurable but much of it of good quality.
Information also came in the form of advertising. Some of this was blatant propaganda of self-seeking opportunists: the land development companies, the railroads with their land grants to sell off and individual employers looking for cheaper labor. But it was not necessarily a zero-sum game; the immigrant gained too. Public policy was also part of this mix as North American, Australian, New Zealand and South African provinces, states and national governments sought out and tried to attract immigrants. So too did South American countries such as Chile, Argentina and Brazil. These governments sponsored speaking tours (often bringing successful immigrants back to their places of origin), held town meetings, and published newspapers and pamphlets devoted to the cause of emigration and why their location was the most-favored.
We also cannot dismiss the effects of dramatic events as advertising. Gold discoveries such as those in California in 1840s, Australia in the 1880s and the Klondike in the 1890s, to name a few, attracted world-wide attention and induced a sudden influx of immigrants: gold rush fever. Ships set out for the west coast of North America, for instance, laden with the hopeful in 1848. But the high expectations were seldom met. The locals got there first. Even then, apart from a fortunate few, the gold rushes never did pay off for the miners/immigrants. Those who benefited were those who provided the services.54 However, the disappointed hopefuls mostly did not return home; they moved on to take up jobs in the rapidly expanding economies of the countries in which they now found themselves (although likely in an impoverished state).
5.7 Remittances: Then and Now
Immigrants’ remittances are money and goods that immigrants send to their countries of origin. For any country, this is a net flow. The payment of such remittances was common throughout the age of mass migration, but their volume increased significantly in the last third of the 19th century when the international transfer of funds became easier and immigrants became wealthier. Gary Magee and Andrew Thompson estimate that, between 1875 and 1913, US immigrants of British origin remitted approximately 16 % of their earnings back to the UK.55 The majority of remitters were motivated by four factors. First, remitters had a sense of obligation to help finance the next round of emigration (usually of other family members). Successive waves of migration were thus self-financing so long as the chain was not broken. Second, there was a desire to provide material support to those who remained at home. Indeed, the “new economics” of labor migration argues that remittances were part of an implicit contract between immigrants and the families they left behind – it was the expected thing to do.56 The decision to migrate was inseparable from the remittance decision for many. For instance, the many ethnic Chinese laborers who went to 19th century North America (and elsewhere) through revolving labor contracts sent a high proportion of their (low) wages home simply to afford a higher standard-of-living for parents, spouses and children in China.57 Many, particularly the Southern European immigrants to North America, came with no such guarantee of employment but were similarly motivated.58 However, there was also a third motivating factor: investing activities, acquiring and maintaining a home in their native country for planned retirement. Last, we must note that as several recent natural disasters reveal, émigrés contribute generously to (welfare) relief efforts in their country of origin.
Today, the World Bank’s reports of remittance flows throughout the world indicate that they have been growing rapidly. As measured in US dollars, migrant remittance inflows increased from $ 2 billion in 1970 to $ 35 billion in 1985 and to $ 132 billion in 2000. The estimate for 2008 is $ 433 billion, and it has been argued that the true amount could be as much as 75 % higher.59 Clearly much of this increase is due to greater diligence in tracking the flow; individual countries are doing a better job of collecting data and more countries are reporting to the World Bank. Because these flows were (and are) much larger than had been recognized previously, the question is raised as to what extent these remittances contribute to economic development in the receiving country? How are the families and friends that receive the monies using this income flow? For one group, the return migrants, the answer is clear: saving in the form of assets – see the next section of this chapter. One answer to this question, however, is clear in the case of Nepal and Malawi: the funds used contribute to the education of the young who receive more schooling than otherwise would be the case.60 Other questions are the subject of debate by development researchers who typically examine the problems of a particular country. But, at this juncture, there are few general lessons to be drawn.
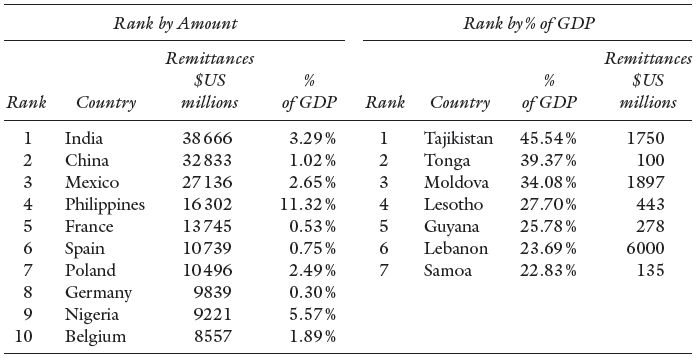
The ten top countries in the World Bank database for 2007 with respect to absolute amount of migrant remittance inflows measured in millions of US dollars are given in Table 5.3.
There are few surprises here; these are generally large countries with a large number of their native-born living elsewhere, but the right hand column has been included to indicate that, with the exception of the Philippines, these large dollar amounts are in reality a small percentage of the country’s GDP. Perhaps a more informative way of looking at the World Bank data is to look at the top ten countries with respect to percentage of the country’s GDP. With the exception of Lebanon, these are all classified as either “low-income” or “lower middle-income” countries. Remittances make a significant contribution to the immigrant-sending countries. While we lack the data to examine this as carefully as might be desired, it seems likely that the motivation and uses of these remittances has not changed much over the centuries. What has changed is the ease with which monies can be moved internationally, and the increase in volume has made this an important element for future study.
Table 5.3 Remittances by Absolute Amount and Rank by Percentage of GDP, 2007.
Source: United Nations (2008) Migration and Remittances Factbook 2008, http://www.un.org/esa/population/publications/2009Migration_Chart/ittmig_wallchart09_table.xls.
5.8 There and Back Again – Reverse Migrations
We do not know with any certainty where emigrants go (see earlier – Who’s In and Who’s Out).61 Even today it requires a highly focused investigation and plenty of research dollars, and time, to discover the truth of the matter.62 But there are some vital clues and some historical results. In the late 20th century in the United States approximately 30 % of all the foreign-born residents (citizens and legal permanent residents) enter the emigration stream. This has been surprisingly constant for the entire century.63 According to the last full census about one-quarter of a million permanent US residents left the US each year in the decade of the 1990s to take up permanent residence elsewhere. Over 80 % of these emigrants were foreign-born.64 We do not know that they all are true return migrants (returning to their country of origin) but many, probably a majority, are. Similarly, in the United Kingdom in 2006 and 2007, the emigration flow (about 63 % of the immigrant flow) was made up of a slight majority of non-British citizens (51 %) and of the remainder who are British citizens many of which would be foreign-born. (The British do not collect the same data as the US). The institutionalized free movement of labor within the European Union gives a range of flexibility to British migrants and a higher ratio of emigrants to immigrants than the US, an option not available to non-Europeans and, of course, not available to US emigrants. Germany too, whose data more resembles that collected in the US, finds that foreign-born residents are approximately 10 % of the total population, and about 80 % of the outflow, similar to the US.65
Return migration: immigrants to a country who have full-time residence status and who return to their country of origin (for a period of at least one year). They may have host country citizenship. Historically, before the 1920s, countries were more relaxed about citizenship and many immigrants never acquired the citizenship of their new country.
Temporary migrants: immigrants who have limited rights of residence such as “guest workers,” workers on specific term contracts and harvest time agricultural labor. Historically, many individuals did have a right to stay in the host country but chose not to do so either because of their contracts provided passage home or there was active discrimination directed at them. Chinese workers often fell into this group. The Chinese refer to temporary migrants as “swallows.”
Visitors: Some temporary migrants are technically “visitors.” Many such visitors come from northern countries taking up winter residence in warmer climates, such as Spain and Florida; they are often referred to as “snowbirds.”
But we know a little bit more of the recent German return emigration than we do of most others. Return migration was closely associated with remittances, as noted earlier. A close association with the family at home and individual life-cycle planning seem to lie behind this link between return and remittances. The latter suggests that individuals planned to return home although not necessarily at the beginning of their immigration experience. The more highly educated are more prone to return migration than those with low levels of human capital provided the labor markets in the country of origin are relatively open. Those whose actual income was well below that that was reasonably expected, whatever their level of education, were more likely to go home.66 Women tended to carry more of their “being a migrant” advantage home to their labor markets of origin than men.67 The causes of return migration were likely the same in the past as they are today. To be sure, the institutional setting was different, such as the lack of open labor markets in the country of origin, and the costs and penalties higher than they are now. This was a barrier to return.
Nevertheless, immigrants did return home. Even in the 17th century folk were returning to England from the New England colonies. The number can never be known as most left quietly with no records of their movements kept. Of those who left records, the highly educated, puritan zeal to proselytize at home seems to have motivated some to return. Many returned for more prosaic reasons, such as not adapting to the new world and escaping debt.68 And, as mentioned earlier, an unknown but large number of convicts and prisoners returned to Britain. The return of the British immigrants continued and probably reached its height, in both absolute and proportional terms, in the 50 years before the First World War. But the British were not alone.
Table 5.4 Italian Emigration by Destination, for Periods, 1876–1976.
Source: data from Bailey (1999) 24.
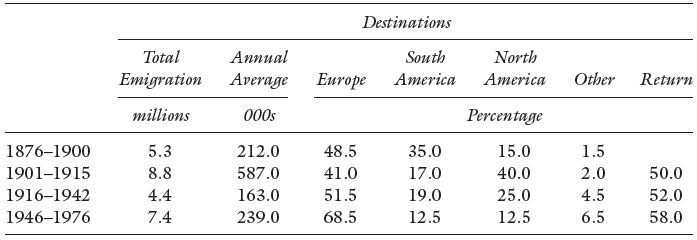
The years of high Italian immigration to the Americas are highlighted in Table 5.4. In the years 1870–1929, more than 50 % of the immigrants returned home. Italy had one of the highest rates of return migration and unlike the British return was much more dominated by acquisition of home country assets and the life-cycle retirement motives. (Southern Europeans, in general, appear more drawn back to their countries of origin than most.) The author Dino Cinel argues that the remittances associated with the return migration, actual and anticipated, were “one of the most important dynamics in the Italian economy and society during the half-century 1875–1925.”69 It touched so many families and reached a volume that inspired a national debate about how the imported savings could be directed in a macroeconomic sense.
No immigrant group had a higher rate of return migration than the Japanese who entered the US before the Second World War – a staggering 85 % of the 288 thousand immigrants who had arrived since the inception of Japanese immigration in the third quarter of the 19th century. Japanese immigrants, like their Chinese and other East Asian counterparts, had come under increasing anti-oriental prejudice with its origins in the late-19th century. By the period 1913–1925 this reached fever pitch with many states, especially in the west, restricting the ownership of agricultural land by Japanese immigrants.70 Not surprisingly, faced with this xenophobic attitude, the Japanese immigrants and many of their American-born children (Nisei) chose to leave. The exodus drew disproportionately from those connected to agriculture (market gardening) including the large number of farm laborers who made up the ethnic Japanese population of the US. The end result was that the Japanese population who were left in the US was comprised of the successful professionals and therefore was (or looked) essentially “middle class” – which itself has engendered a debate about the success of the Japanese in America.71 There is little question that the majority of Japanese immigrants intended to reside permanently in the US. Circumstances did not permit them to do so.
5.9 Diaspora
The term “diaspora” was first used to describe the removal of the Jews from their biblical homeland during the Babylonian Captivity and their subsequent spread and, often forced, movement throughout the world. In recent years the word has come to be applied to many other distinct ethnic or culturally-defined populations who shared some general characteristics of spread and forced movement. Thus in addition to the Jewish diaspora, we may talk of the African diaspora with its origins in Arab/European/American slavery and include the migrations and settlement of, say Afro-Caribbeans in Britain during the 20th century. Diasporas transcend national boundaries. And, diasporas may be found in the following list (with their initial cause):
- the Acadians, military-political resettlement in the 18th century;
- the Armenians, political repression in the 19th and 20th century;
- the Eritreans, political repression and poverty late-20th and early-21stt centuries;
- the Chinese, forced labor contracts and poverty in the late-19th and early-20th centuries;
- the European gypsies, ethnic discrimination in the 19th and 20th centuries;
- the Highland Scots, agricultural displacement in the 18th and 19th centuries;
- the Indians, forced labor contracts in the 19th and 20th centuries;
- the Irish, recurring famine conditions and poverty in the 19th and early-20th centuries;
- and many others.
What unites the various elements of the list is that there is an event such as a famine or political repression or religious or cultural intolerance that sets the forces of diaspora in motion.
A. The Chinese
The control of the highly centralized Qing government of China began to break down in the 19th century. As it did, the pace of migration of the Chinese population sped up both within China and, through emigration, to other countries. The background of this change was a growth of family size – the very beginning of the demographic transition. Specific disruptions caused by the Opium Wars (1839–1842), the Taiping Rebellion (1850–1864) and the Boxer Rebellion (1898–1901) helped further to create an unsettled economic climate. So too did the many local outbreaks of violence that troubled China in the waning years of the Qing Dynasty. Yet, the prime mover, on the supply side, was the grinding poverty in the well-settled areas. Some migrants were attracted by the greater income opportunities of the frontier areas of China, and even peasants who were legally tied to the land (about 10 % of the population) entered the migratory stream. But, it was not always the poorest who responded. Some better-off peasant families also moved, and in this sense their movement resembled the frontier migration of American farm families in the 19th century.72 So, too, the Chinese began to explore labor markets and trading opportunities abroad. It was the beginning of the mass spread of the ethnic Chinese to all corners of the world. It has been estimated that in 2000 34 million Chinese-born migrants lived outside China in 140 countries of the world. Today there are more as Chinese emigration has increased in the past decade – although numbers are difficult to measure. These tangren, as they call themselves, do not include those of Chinese ethnicity who were born outside China, residents and nationals of other countries.73 In many cases the second, and subsequent, generations of ethnic Chinese have rejected or just simply lost their ancestral identity, and often lost their Chinese language skills. Thus, the number of ethnic Chinese abroad is very much more, but unknown, than the overseas Chinese-born population.
But it is perhaps not the numbers that are so surprising. China through most of history has had the world’s largest population so emigration when it did take place was inevitably large. What is surprising is the rapidity of the Chinese diaspora and its extent. For instance, when the revolutionary patriot Sun Yat Sen raised money to finance his political cause in the late-19th century, he traveled to, and was able to gather funds from, a large and geographically diverse expatriate and ethnic Chinese community. Most of the migrants who went overseas came from Southern China, particularly the southern provinces of Guangdong and Fujian. The 19th century Chinese emigration was, on the demand side, essentially a response to: i) the demand for unskilled labor, and ii) the economic opportunities from trading. The Chinese diaspora, as noted, grew extremely rapidly in the second half of the 19th century and quite naturally it focused, in the first instance, on the countries of South-East Asia particularly the Malay States (now Singapore and Malaysia).74 Britain and France signed a migration treaty with China in 1860 in order to ensure a steady flow, indeed an increased flow, of labor to their South East Asian colonies. Unlike the western countries of the US, Canada, New Zealand and Australia, the South East Asian countries and European colonies of the region never introduced draconian anti-Chinese legislation. This is not to say that the migration was not troubled by discriminatory practices on the part of governments, it was. There were even legal barriers placed on the Chinese returning from abroad by the Chinese government itself although they were often overcome by specific treaties such as that noted above.75 However, the fever pitch of Western, and so-called White, countries was generally avoided.
In a relatively short period of time Singapore became an ethnically Chinese enclave, as seen in Table 5.5. The Chinese in Singapore were quick to exploit the trading ventures of the region. In order to explain this success historians point to the adaptability, education and entrepreneurial spirit of the Chinese throughout South East Asia.76 Chinese traders, some of whom lived outside of China, were very familiar with the commercial possibilities in the Straits of Malacca and the South China Sea areas. Indeed, many of them, according to Wang Gungwu, were familiar with the British and Dutch trading regimes and their practices and were quickly adapted to Singapore.77 However, Singapore was unusual in that the ethnic Chinese became the majority population – thereby contributing to the break with the rest of the Malay States. In most South East Asian countries into which Chinese migrants flowed in great numbers they remained a minority (Malaya, Indonesia, Thailand, Burma, the Philippines and the countries of Indo-China).78
The first recorded Chinese in Latin America were earlier than the 19th century. William Bernstein describes the petition of Mexico City “barbers” in 1635 against the Chinese barbers who had settled there. There was also an early 17th century migration to Peru associated with the trans-Pacific trade in gold-silver (eastward) and Chinese silk (westward). Since this trade was conducted through the Philippines, it is not surprising to find that it induced a movement of people from China to Manila as well. Migration tended to follow trade. Chinese manual laborers were imported to work the mines.79 In the latter half of the 19th century when the diaspora gathered force, Chinese settlement was encouraged in Brazil where state-sponsored tea agriculture was introduced in the mid-19th century. The authorities sought cheap but experienced tea workers from China. In other areas the Chinese migrants provided the usual unskilled labor. There was, for instance, a substantial migration to Latin America and the Caribbean, particularly Peru and Cuba, where the “coolies” were employed in the mines and sugar cane fields. The latter was a direct consequence of the abolition of slavery in Cuba in 1845; the first Chinese arrived in Cuba two years later as indentured servants.80
Table 5.5 The Chinese Population of Singapore, 1824–1947.
Source: Freedman (1957), p. 25 and Ee (1961), 50.
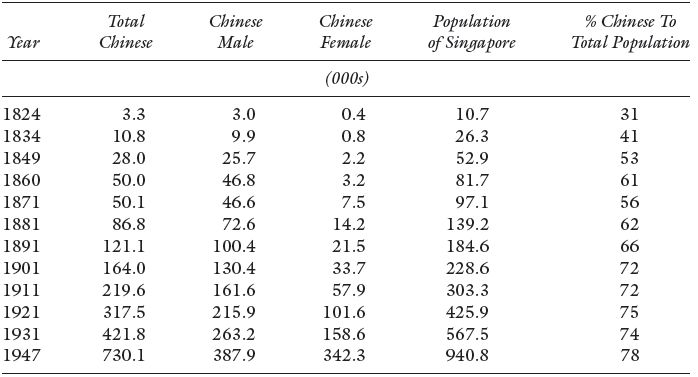
Note: These data are the ethnic populations, not simply those born in China.
In North America, the first Asian immigrants arrived in the US and Canada during the gold rushes of the 1840s and 50s where, amongst other things, they contributed to the local taxes to such an extent that anti-Chinese local sentiment did not get political backing at this time.81 Economic self-interest overcame stark prejudice. (The coincident gold rushes in Australia signaled the first arrival of the Chinese in that continent.) The mammoth projects of trans-continental railway building were also underway in the aftermath of the US Civil War and the Chinese provided the brute labor particularly in the western states, territories (and provinces). Notably, the anti-Chinese sentiment began as these projects wound down. The Chinese advantage in supplying the labor lay in vast quantities without affecting the price of labor. Even during World War I tens of thousands of Chinese laborers were recruited to dig the trenches and to carry-on the civilian building repair and menial work vacated by the French conscripted into the army. Aided by the Allied governments many traveled across the Pacific and through the US on sealed trains before crossing the Atlantic to France.
Many, if not most, of the Chinese laborers were principally interested in remitting funds back to families. It was often based on a family decision which may have included the choice of which son would be the emigrant. Many who emigrated on limited labor contracts repeated the experience and so became permanent “temporary residents” much like the many guest workers in post-1945 Europe. Others became trapped in a form of “debt-peonage.” Gangs of laborers were recruited in China by China-based recruiters acting for foreign contractors and for overseas Chinese merchants who financed the migration. Somewhat similar to the indentured servants of the 17th and 18th centuries’ migration from Europe, the merchants would pay for the passage and other expenses, one of which was an immigrant “head tax.” Workers were required to reimburse the merchants who paid the passage and head tax, but, because they often had not paid in full by the end of their period of contract service, they were required to extend their stay and agree to new labor contracts. They were caught in a revolving debt trap. While indentured service was illegal in the US by this time (the late 19th century), there is compelling evidence to show that extra-legal means were used to enforce the practice. One of contributing factors was the immigrants’ ignorance of alternatives because of the cultural and language barriers.82
It was very difficult, especially after the 1880s, for an existing Chinese migrant to North America to sponsor his spouse and family because of either the prohibitions or the very high head tax applied to the Chinese women migrants.83 A stated objective of the anti-Chinese policy which emerged in the last quarter of the century was to discourage the permanent settlement of the Chinese immigrants by forcing a low sex ratio (females to males) in the community, thus preventing new families and the re-unification of existing families. The consequence was a population of aging men far from the families they supported. There were, however, loopholes as the government’s anti-Chinese policies were also generally class-based, and exceptions were made for merchants’ families. It is also highly likely that many laborers evaded the prohibitions and “were hidden in plain sight.”84 Perhaps the exclusionary tactic was not as effective as once believed. Apart from manual labor, in the late-19th century, the low (offer) wage Chinese were beginning to move into domestic service industries directly and indirectly, such as laundries, just as women were beginning to exit domestic employment and expand the range of their work choices in increasingly industrializing economies.
Today, the Chinese diaspora consists of many individuals who are not Chinese nationals and are members of the diaspora only through their ethnicity, itself a somewhat imprecise concept. (Where ethnicity is a characteristic actually identified by modern censuses, it is through self-declaration.) For instance, from the last complete census of the United Kingdom (2001), 0.42 % of the population describe themselves as ethnic Chinese – a small ethnic group by British standards. Almost 30 % of these were British born and an additional 40 % were born in countries other than China and Britain. The latter are the ethnic Chinese who were immigrants from Hong Kong (under British rule) and other countries as varied as South Africa and Malaysia.85 That is, more and more the ethnic Chinese diaspora takes on characteristics separate from the ancestral home. Even these links and associations are weakening, including for the reason of mixed ethnic marriages, “neither hauqiao nor hauren.”86 The same acculturation trend is found in the United States, Canada, Australia and New Zealand. In the US, for instance, the ethnic Chinese are one of largest minority groups, 3.54 million (2007), after the Hispanics, in the non-white and non-black populations. Almost two million of the ethnic Chinese are US-born and many of them have long family histories in the US. So too, the Canadian population is 3.9 % made up of those with Chinese ancestry. Many of those chart their family trees to the first settlements in British Columbia. But, migrants from the People’s Republic of China and Taiwan are now among the larger immigrant groups in contemporary North America and Australia. Some within the ethnic Chinese communities are caught between two cultures.87
B. The Irish
One part of the British exodus in the early 19th century was the Irish. Ireland suffered a series of bad harvests and local famines and for many years in the early 19th century the Irish made up the largest single component of the British emigration. (About 1.5 million people left Ireland, for all destinations, during the years 1815 to 1845.)88 Driven by famine conditions and desperate poverty, it may seem surprising that so many favored the British North American colonies compared to the US before the mid-1840s. The most common route to North America was via Liverpool, and a large Canadian fleet of timber ships were available to take passengers. That they landed in Quebec City did not mean that the Irish stayed in British North America however. A large, but unknown, proportion of them subsequently left for the US where canal and later railroad building and the rapidly burgeoning industrial economy provided employment. For Canada, the Irish were the accidental tourists of the day; it was simply a matter of getting on the first available ship in the port of Liverpool. The Irish diaspora reached a climax in the 1840s. Bad as the earlier crop failures had been, none equaled the widespread famine conditions which prevailed in 1846 with the failure of the potato crop.89 It became known as the Irish Famine (by the world) or the Great Hunger (by the Irish) and resulted from the blight which rotted the potato crop; potatoes were the staple crop of domestic consumption.
Ireland had a pre-famine population of 8.18 million, according to the Census of 1841, but this had declined by 1.62 million by the time the worst of the famine was over, according to the Census of 1851. The difference is deceptive. How many Irish died in the famine interval and how many left Ireland to feed the diaspora? To get to the correct (approximate) number of those who died due to the famine we have to add the children who were born in the census interval (some of whom may have died), subtract the number who would have died in normal circumstances for Ireland, and then count the emigration and the immigration – the latter being presumably very small. These values are, however, not recorded accurately. Joel Mokyr and Cormac Ó Gráda, nonetheless, estimate that, after accounting for the census under-reporting of deaths and other biases, approximately 1 million deaths were directly attributable to the famine conditions in Ireland in the late 1840s.90 The other part of the population loss which came from emigration was approximately 1.28 million. Many who left escaped across the Irish Sea to England and Scotland to become absorbed in the industrial population of those countries.91 (Ireland was no stranger to large scale emigration as about 1.5 million people left in the 30 years before the famine conditions of 1846.) The majority of the emigrants (923 000) took the first available ship to North America or traveled to Liverpool and Glasgow to subsequently embark on the trans-Atlantic journey.92
Figure 5.5 The Irish Population from the Great Famine to the Present.
Source: data from Central Statistics Office, Ireland and Northern Ireland Statistics and Research Agency.
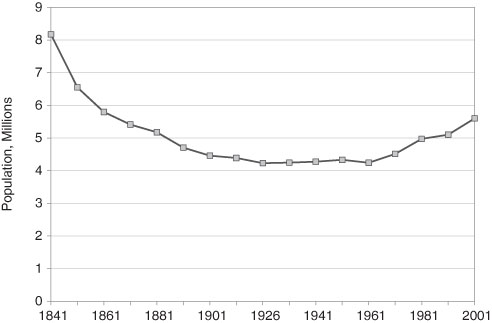
The consequence of this emigration was a decline in fertility because of the loss of young people of child-bearing age. Yet, there is no evidence to suggest a reduction of married woman’s age-specific fertility in those who remained. The continual stream of departures and its effects on the age structure and sex ratio, however, did result in an Irish population that declined for one hundred years.93 Irish agriculture then began a long and slow adaptation to the change in the human resources available, a process that was assisted by the removal of the Corn Laws in 1846 – which had help breed the hot-house conditions of pre-famine agriculture. Not until the second half of the 20th century did the Irish population increase again (see Figure 5.5). The effect on the regions to which the Irish went was also profound. Carrying a relatively low level of human capital they provided the workforces for the mines and the factory systems that were emerging in North America and Britain. Irish immigrants to the US improved their lot, but their income gain was far less than that for many other groups. The Irish tended to congregate in the cities and maintained their social and religious distinctiveness. They also, for the first generation immigrants, retained their demographic distinctiveness with a high marital fertility.94 There is an on-going debate among historians of the Irish as to why the emigration came to be seen “as exile and banishment rather than a quest for opportunity and self-improvement.”95 The celebration of St. Patrick’s Day throughout North America (and now also in Ireland) is a harkening back to the black days of the 19th century – a mixture of pathos and exaggerated romantic attachment. After all, no country has ever surrendered a greater continuing percentage of its population to emigration.
C. The Jews
The second major Jewish dispersion, after that conducted by the 5th century BC Assyrians, began in the 1st century AD as a result of “The Great Revolt” against the Romans. From then on, faced by repression in their native land, Jews began a migration that initially took them to other parts of Africa and Asia, and ultimately all over the globe. But by the 4th century, the Jewish community in Egypt had largely disappeared, the Jewish population of Palestine was in decline, and Babylon had emerged as the centre of Jewish life. Thereafter, Jewish political authority in the original homeland was surrendered unwillingly to the successor imperial powers, religious invaders and occupiers. The list is long: the Byzantine Empire, Arab empires centered in Damascus and Baghdad, European Christian states, the Egyptian Mamluks, the Ottoman Turks and the British mandate (from the League of Nations). It was not until the late-19th century that Jews began returning to Palestine to form a national home, by deliberate policy and weight of numbers. The Jewish state of Israel was created in 1948.96 Two millennia of a people being separated from a national home raise the age-old question much discussed by Jewish and non-Jewish scholars alike: are the Jews one ethnic group or many, and does the religious identification provide the over-arching cultural identifier?
In the mid-19th century, there were significant Jewish populations in Eastern Europe, particularly Poland and Russia. From then to the eve of World War II, the Jewish population expanded, from a little over 2 to 32 million people. It then fell dramatically with the Holocaust and its subsequent demographic consequences. Maristella Botticini estimates that the 2007 population (13.155 million) was less than half of the 1939 population, with the largest concentrations now in Israel, North America and Western Europe – see Table 5.6. Similar to many groups not covered in a national census and given self-declared characteristics they are extremely difficult to count. Precision is made more difficult in this case by the strict (when applied) matrilineal definition of Jewish.97
There are two major features of the Jewish diaspora over the ages.98 First, Jews have always been a minority in the places where they have lived outside of Israel – often a very small proportion of the population where they lived. In that, they are very different from the Chinese diaspora whose numbers often led them to become a significant part of the host’s population as in Taiwan, Singapore and the countries of South East Asia. As a minority with a history of being persecuted, the greater heterogeneity of the society into which they came, the less likely any one group is singled out for discrimination. Jews, in the US for instance, have long played an activist role in shaping a liberal immigration policy to favor the non-Europeans.99 The second feature of the Jewish diaspora since the Middle Ages in Western Europe, and later North America, is that it has been overwhelmingly urban in character. However, it is not sufficient to observe that the occupations chosen were ones practiced in urban centers (although they were). The occupational choices were strategically made. Jewish migrants entered skilled occupations or became merchants that embody a good deal of human capital such as the professions of medicine and financial intermediation and the mercantile ventures of the diamond trade and the fur trade. As such, skills and specialized talent are the most highly portable form of capital investment, in this case human, should relocation be required. The argument that the diaspora led Jews to invest in their human, as opposed to physical, capital because of its portability is compatible with the argument that restrictions and prohibitions against Jews led to those occupational choices.100 Indeed, restrictions against Jewish land ownership and merchant guild proscriptions against Jewish membership directed these occupational choices. In 1931 in Toronto, a fairly typical small North American city of the period, Jews were under-represented in occupations such as stationary engineer, police, civil engineer, and metal molder and over-represented in the fur and textiles merchant trades, and the professions such as dentist, physician and lawyer.101
Table 5.6 Countries Ranked by Size of Its Jewish Population, 2007.
Source: Della Pergola (2007) American Jewish Year Book, Tables 5 and 8.
| Country | Jewish Population | Percentage of World Jewish Population |
| Israel | 5 393 400 | 41.0 |
| United States | 5 275 000 | 40.1 |
| France | 490 000 | 3.7 |
| Canada | 374 000 | 2.8 |
| United Kingdom | 295 000 | 2.2 |
| Russia | 221 000 | 1.7 |
| Argentina | 184 000 | 1.4 |
| Germany | 120 000 | 0.9 |
| Australia | 104 000 | 0.8 |
| Brazil | 96 200 | 0.7 |
Note: The Jewish population of Israel is 74.9 % of the total Israeli population (does not include West Bank and Gaza).
If the Jewish diaspora was proportionately small in the various host countries, and absolutely small in some cases, was there an advantage to small size? For instance, Avner Greif argues that Jewish merchants who engaged in long-distance trade during the Middle Ages were successful because they were members of a relatively small community. The case of the Maghribi traders of the Mediterranean is illustrative of what Greif calls the “community responsibility system” which enabled merchants to protect property rights, thereby facilitating spot exchange of chattels between buyers and sellers from different localities, different countries.102 The system required that both legal and political power in each community be the responsibility of those who stood to gain from exchange. Local courts had the incentive to enforce contracts between locals and outsiders and to protect the property rights of those from outside that locality. Even in the absence of formal institutions, members of what today are called commercial or trade networks could use community sanctions to minimize opportunistic behavior. The group could ostracize, even exclude from the network, those who violated or abused basic trade relationships. In fact, there were often personal, even family, connections between traders located at distant points. One often finds in commercial networks that community members retain the ability to read and write in their own language as well as develop linguistic skills in other languages. This enables them to use their native language within the group and to use alien languages for transactions with local customers. Thus, in markets where information could be privately held, the Jewish traders had a cost advantage in operating within such a framework in Europe and North America in the same fashion as the Chinese traders in Asia.103 It also gave them a global reach not available to local traders.
A major transformation of the Jewish diaspora began in the last quarter of the 19th century with the widespread emigration out of Eastern Europe. The new center of Jewish influence became that of the diaspora in North America/Western Europe, with the former having greater numeric significance. Then after the ravages of the Holocaust and the creation of the modern state of Israel the dual definition of Jewry became that of the diaspora and the homeland. The transformation began with the large influx into the US from the Russian and Austro-Hungarian empires driven by the land displacement policies (pogroms) of these regimes.104 Similar to many migrations, it often involved stops along the way. For instance, we now know that there was a substantial flow through France and England, particularly Paris and London, that ended up in the US after some time.105 Nonetheless, many did remain in France and England. Both countries, which now count among the largest of the Jewish diaspora nations, had long histories with their Jewish populations. Both had expelled the Jews in the Middle Ages, re-admitted them in the early modern period when well established (although small) communities were established. Members of the diaspora included the 18th century international financiers of the Rothschild family and, we need to mention David Ricardo, the great economic thinker and member-of-parliament. Benjamin Disraeli, the mid-Victorian era Prime Minister of Britain, was the poster-child of successful adaptation (despite private pain). And therein lay the dilemma of those of the diaspora, the trade-off between integration and distinctiveness.
The greatest part of the Jewish diaspora is found in the US and is derived from the Jewish immigration prior to the late 1920s. Most of these immigrants were poor and had levels of literacy lower than that of other European immigrants. They clustered together in low-priced housing of the larger North American cities, primarily New York. They worked in low wage industries and faced quite explicit anti-Semitic discrimination, the most pernicious of which were the barriers to higher education. Opposition to discrimination took two forms; the persistent resistance and the integration of the Jewish-Americans into the American social fabric. This, in turn, gave the Jewish diaspora of North America a liberal political quality. The Jewish immigrants of the late-20th and early 21st centuries (also mainly from Russia) often do not share the earlier attitudes.106
5.10 The Barriers Go Up
When the Irish arrived in North America during the Famine Years of the 1840s, their ships often carried a yellow flag at the masthead. This was the signal that the ship was carrying disease; cholera and smallpox were the most frequent and most feared. The ship would be quarantined, and medical inspectors alone determined when and if the immigrants could land – or could only land to be admitted to a quarantined segregation station. In this era the only restriction that immigrants faced was that of the health inspector. However, in the later part of the 19th century governments began to adopt new policies that limited entry to their countries or severely restricted certain immigrants when they landed. In the US it began with the anti-Chinese sentiment of the late-19th century. Erika Lee argues persuasively that in this racial discrimination was the origin of the modern notion of America as its own “gate-keeper.”107 Canada almost step-by-step followed the US lead in various forms of anti-oriental legislation that surfaced in the 1880s although there were some critical differences – Canada did not have a complete ban on workers from China until 1924.108 Australia, at roughly the same time, followed suit and by the beginning of the 20th century had in effect what came to be known as a “White Australia” policy. Who was responsible for the anti-Chinese bias in legislation? Some blame the trade unions while others suggest that politicians led the movement in response to a general climate of economic pressure. While it was true that Chinese immigrants provided cheap labor, they often worked in non-competing (dual) labor markets. However, by the late-19th century, three of the great immigrant receiving-countries were virtually closed to East Asian immigrants, or, if admitted or already resident, were allowed only limited access to pursue employment and enjoy a settled life.
It was an easy step to extend the discriminatory policies to cover other Asian immigrants. So-called “gentlemen’s agreements” limited the flow of Japanese-born migrants from Canada to the US and between Japan (which was interested in limiting emigration) and the North American countries. But bizarre regulations also created a high barrier to entry such as, in the British case, the requirement that South Asian migrants journeying from India to Empire countries must do so without breaking their journeys, which included the ship calling into any other port en route!
Before World War I, non-Asian immigrants faced few such barriers to entering the US. That changed in the aftermath of the war. Restrictive immigration policies have been the norm in most developed countries since then, although they loosened to some extent in the last decades of the 20th century. Why did they change when they did? Since the European migration across the Atlantic contributed to American economic growth before the war, why restrict it after the war? A part of the answer is that some factions within the US had been trying to restrict it via a literacy test since the 1890s.109 An act passed both houses of Congress in 1892, but was vetoed by the president. Congress did not override the veto. Similar bills were introduced periodically thereafter with the support of both capital and labor. Indeed, such an act passed in 1912, but with the same result as the one two decades. In 1917, when a literacy test finally did pass Congress, it did so over a presidential veto.
As Claudia Goldin noted, “The ultimate switch in policy is not hard to explain. The perplexing part of the legislative history of immigration restriction is its timing.”110 The usual explanation given for why the measure finally passed is that a combination of nationalism and chauvinism developed during World War I. Fear of European “radicalism” and the resurgence of protectionist sentiment, together with organized labor’s resistance to the influx of any new waves of immigrants on the pre-war scale, produced sufficient political support for restriction.111
As a result, immigration rates in the US fell over the first half of the 20th century. They began to increase in the second half, but not back to 19th-century levels.112 Immigrants were a small proportion of the total population during the 20th century, but they remained a significant contributor to the rate of population growth. In the 1950s, legal immigration was responsible for roughly one-tenth of population growth, and the comparable figure today is roughly one-third.113
The Immigration Act of 1965 shifted policy away from geographical quotas toward a set of standards that emphasized labor market skills, the reunification of families, political asylum, and other humanitarian aims. In the aftermath, the proportion of immigrants arriving from developing countries has increased.114 Yet, immigrants with professional occupations comprise about 25 % of legal immigrants today as compared to about 1 % in the first decade of the 20th century.115 Similarly, those reporting their occupation as domestic servant or laborer constitute about 20 % of today’s flow as compared to 70 % in that first decade. Illegal immigrants, estimated at about 30 % of the legal flow, are more likely to be unskilled.
Similar trends are present in Canada, Australia, New Zealand and the European Union.116 Immigration policy in developed nations today has to grapple with attracting productive immigrants but also allow for the re-unification of families, granting asylum to those in peril in their home countries, maintaining the security of their borders, and even the potential for “trafficking in human beings.” Given that these goals may conflict, this is not an easy task. The subject of granting citizenship to a large number of immigrants who have been living illegally in the US for decades has become a “hot button” political topic. It is no less so in the European Union. The attempt to develop common immigration policies across the EU has articulated principles, but, like the US, has not been able to pass legislation.117
5.11 The Walker Thesis, Displacement and Savings
In the late 19th century, Francis Amasa Walker (professor at Yale, then president of MIT, the American Economic Association, and the American Statistical Association), theorized that, given American conditions, there was some maximum rate of population growth – a distant echo of Malthus. This meant that each European immigrant filled a place that would otherwise have been occupied by a native-born American. This was tantamount to saying that each European immigrant meant one less native-born American in the population:
Foreign immigration into this country [US] has … amounted not to a re-enforcement of our population, but to a replacement of native by foreign stock. That if the foreigners had not come, the native element would long have filled the places the foreigners usurped …
Dewey (1899) 425118
The Walker Thesis, as this view came to be known, was examined by Paul Uselding who observed that: i) there never was a maximum growth rate and ii) each European immigrant represented a capital transfer from Europe to North America. The value of the transfer was equal to the rearing cost of the migrant to the age of migration.119
Since most immigrants were young males and females ready to enter the labor force, North America got the benefit of their training without incurring the cost. In this, Uselding elaborated the idea found in the work of an Italian statistician, Agostino de Vita, who argued that the American capital stock in 1914 was little more than the accumulated cost of rearing, feeding, educating and transporting the millions of European migrants to the United States. The consequence of the Atlantic migration was to “free” American resources to build the capital equipment the immigrants used as part of their labor. This is why North America was able to pull ahead of the Europeans economically. Unfortunately, de Vita overstated the case, but Uselding, nonetheless, pursued the basic idea using known data. He concluded that during the period between 1839 and 1859 the additional capital formation due to immigration was within 5 % to 10 % of GNP. Later with co-researcher Larry Neal, they expanded the calculations to the period between 1790 and 1912. They concluded that, by the end of the longer period, the additional capital stock created by immigration was 10 % to 20 % of GNP.120 Thus, immigration meant that the American economy grew faster than it would have otherwise. This positive impact of immigration was apparent before the US Civil War.
The growth effects of immigration, however, did not benefit everyone. Joseph Ferrie’s work demonstrates that the arrival of immigrants, particularly Irish immigrants, during the 1850s had a negative impact on native-born American craft workers. This seems to be a result of the fact that the highest rates of immigration were realized just when the American economy began to industrialize:
Though their [the Irish] arrival apparently led to some down-grading of native skilled workers, they may have also paved the way for less skilled natives to enter factory work as well, by being available just as employers were preparing to change their production processes.
Ferrie (1997) 208121
Robert Gallman further noted that, by 1860, probably 35 % of the adult males in the Northern states were foreign-born (half the Union army was foreign-born during the US Civil War of the 1860s).122 Consequently, he added a caveat to the Walker thesis: since most of the immigrants stayed in the cities, the migration of native-born Americans to urban areas was less rapid than it would have been otherwise. If native Americans were more likely to stay in rural areas where the birth rate was higher, the native-born American birth rate was higher than it would have been had more moved into the growing cities.
5.12 A Final Word on Long Distance Migration
Where there is a push from an emigrant-producing area and a pull to an immigrant-receiving one, long distance migration is likely to provide positive net benefits in the aggregate to both areas. Adjustments will be required, and not everyone will benefit, especially those whose skills put them in direct competition with immigrants. However, not all long distance migration is associated with economic incentives and an open market. Over time, imperial countries have expelled their citizens from the mother country and forced movements of their captives. While this may have positive net benefits in the aggregate, there are equity issues that transcend any consideration of efficiency. Finally, in spite of potential net benefits, countries have taken steps to limit immigration when socio-political concerns trump economic ones. The lost benefits are the opportunity cost of the ignorance, fear, and prejudice that underlie many of those restrictions.
Net Present Value of Migration to the Individual
In order to induce movement the expected net present value of migration to the individual must be equal to or greater than zero. Of course, the values anticipated may not be realized. The expected net present value is calculated as:
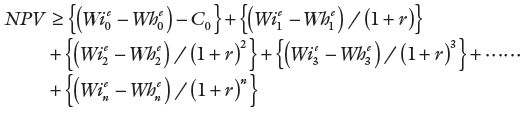
where
| C | Transport costs |
| Wh | Wages at home |
| Wi | Wages in immigrant-receiving country |
| 0,1 … n | time |
| r | discount rate |
| NPV | Net present value |
Hatton and Williamson employed a similar method to estimate the average lifetime gains of income of various US immigrant groups in 1905.123 With the use of data on wages, imputing a variable skill premium by group, including the costs of immigration, and employing a discount rate of 10 % they estimate the following gains by country of origin for the individual on average and in percentage terms:
| Germany | 63 % |
| Britain | 58 |
| Ireland | 51 |
| Italy | 83 |
| Spain | 167 |
| Sweden | 50 |
Endnotes
1 Forster (2004).
2 If migration was delayed, to say age 25, the profile of expected (and actual) wages would be different and so with every possible migration age. It would be more accurate to talk about a family of expected profiles, some perhaps higher but some lower then the ones shown.
3 See Appendix 5.1 for a formalized statement of the net present value calculation.
4 The wage deflator is usually taken as the implicit GDP price deflator or a near historical substitute.
5 The Hecksher-Ohlin model is named after the two Swedish economists who amplified the basic comparative advantage Ricardian model of trade.
6 Freeman (2006); Hatton and Williamson (1998); and Taylor and Williamson (1997).
7 During the colonial periods in both French and British North America, soldiers who were about to be shipped home were often give the option of demobilization in North America. The reasons were the same that the Roman Army gave: to have a ready force of loyal fighters available for local duty.
8 Censuses do count the illegal immigrants (but not separately), but, since “illegals” try to avoid the government agents any reporting, this group is under-represented.
9 This is simply the cumulative flow of immigrants and thus does not include the progeny of those immigrants.
10 Finkelman and Miller (1998) and Wiedemann (1981).
11 Humphreys (1977a and 1977b) and Jackson (1990).
12 Fogel (1989).
13 Lincoln’s abolition of slavery in 1863, the Emancipation Proclamation, only applied to the break-away Confederate States of America. Slavery existed in Maryland and the District of Columbia until 1865.
14 Curtin (1969).
15 These figures are from Cohn (1985) Table 1. The last figure is a trans-Atlantic route weighted (by number of voyages) mean calculated by the authors.
16 Haines, McDonald and Shlomowitz (2001); Grubb (1987); and Richardson (1987).
17 Butler (1896) and Smith (1934).
18 Ekirch (1985).
19 Ekirch (1987).
20 Robson (1965).
21 Lewis (1988) argues that the return rate was about 6 % in the period 1796–1810.
22 Galenson (1977) and Galenson (1981) both argue that indentures follow from the English legal notion of “service in husbandry.”
23 Gibson (1683).
24 Either party could sue if the contract’s terms were not fulfilled.
25 See Grubb (1988).
26 Grubb and Stitt (1994).
27 Jefferson (1788).
28 Grubb (1994).
29 Horwitz (1997).
30 Hanes (1996).
31 Parr (1980).
32 Two-thirds of total immigrants from all sources to North America amounted to approximately 40 million from 1850–1913. Hatton and Williamson (2005).
33 Sanchez-Alonso (2000).
34 Bailey (1999).
35 Thomas (1972), Thomas (1973 and 1954) and Lewis (1978).
36 Hatton and Williamson (1998).
37 Friedberg and Hunt (1995).
38 Green, MacKinnon and Minns (2002).
39 Ferrie (1999).
40 These non-tradable goods and services may contain tradable components.
41 The US became a net capital exporter in the first decade of the 20th century. All others remained net capital importers.
42 The US balance of payments changes fundamentally in the first years of the 20th century.
43 Cervantes and Guellec (2002).
44 Because of lags in immigration to the stimuli and because of the lack of precise and accurate historical data it has been difficult to show the relationship between immigration and capital flow econometrically.
45 McCusker (1997), Table 3.2, 53. See also the discussion about “registered” and “measured” tonnage.
46 Britain deliberately switched its imports from the Baltic countries to BNA due to the war by imposing a high tariff on Baltic timber and lumber in 1805. This did away with the transport cost disadvantage. Lower (1974).
47 Registered tonnage probably underestimates the measured tonnage by about 33 % according to McCusker (1997).
48 Innis (1956).
49 Gibson (1683): Killick (2008), Table 3c.
50 Killick (2008).
51 Harley (2008).
52 Wegge (2003).
53 Wegge (2008).
54 Clay and Jones (2008).
55 Magee and Thompson (2006).
56 Lucas and Stark (1985).
57 Chen (1939).
58 Baines (1994).
59 Freund and Spatafora (2005); Mansoor and Quillin (2007).
60 Bansak and Chezum (2009); Davies, Easaw and Ghoshray (2009).
61 Borjas and Bratsberg (1996).
62 Ley and Kobayashi (2005). These are known as longtitudinal studies and are based on individual life records. They are, one hopes, a representative sample of the emigrants.
63 Mulder, Guzmán and Brittingham (2002); Jasso and Rosenzweig (1982).
64 ‘Emigration is defined as the number of US permanent residents departing from the United States to reside abroad. This population accounts for the departure of both native and foreign-born legal residents. The departure of unauthorized migrants, migrants from Puerto Rico, and temporary migrants is excluded.’ Mulder et al. (2001), US Census Bureau…, Table 7.
65 Gundel and Peters (2008). Net immigration is only 22.7 thousand with gross emigration 639.0 thousand in 2006. See also OECD (2008) and Tannenbaum (2007).
66 Arrivals in UK, averaged 584 000 for the years 2006 and 2007, and emigrants averaged 370 000 of which 189 000 were not British citizens. Data are not kept in such a way as to make the UK and US comparable. Emigrants are in this UK definition those who remained outside the UK for at least one year. UK (2009) National Statistics, Emigration.
67 Co, Gang and Yun (2000).
68 Delblanco (1986).
69 Cinel (1991).
70 The Supreme Court of the United States held in 1922 that ethnic Japanese were ineligible to become naturalized citizens. Suzuki (1995).
71 Suzuki (1995) and Higgs (1978).
72 Campbell and Lee (2001).
73 Poon (2007) and Ng (1998).
74 Ee (1961).
75 Ee (1961).
76 For a brief history of some of the prominent Chinese businessmen in South East Asia, see Mackie (2004). Also see Charney, Yeoh and Kiong (2003).
77 Wang (1991).
78 Pan (1990).
79 Bernstein (2008).
80 Chang-Rodríguez (1958).
81 Kanazawa (2005).
82 Cloud and Galenson (1987). These views are disputed by McClain (1990), but rebutted in Cloud and Galenson (1991).
83 Walker (1977). North of the border, the Canadian head tax was imposed by authority of the Chinese Immigration Act of 1885. It was $ 50 per individual and was subsequently raised several times being $ 500 at the end of Chinese immigration in 1923, the Chinese Exclusion Act. The latter was loosely based on the US Chinese Exclusion Act of 1882.
84 Chew and Liu (2004).
85 United Kingdom (2010), National Statistics On-Line, Census 2001 and Table 3.7. Also see Census Release: Ethnicity and Religion, Table 2. The non-white ethnic population of England and Wales is 8.7 % of the population. The mixed ethnic group accounts for 1.4 %.
86 Wang (1998), 15–33. Huaqiao refers to the Chinese nationals overseas whether intending to remain or not whereas Huaren refers the overseas Chinese with more distant links to China.
87 Pan (1990). Also see her charming and insightful foreword in her Sons of the Yellow Emperor. The same theme is explored in the novel by Terry Woo (2005), The Banana Boys, Toronto: COR.
88 Mokyr (1983).
89 Mokyr (1983).
90 Mokyr and Ó Gráda (2002).
91 Boyle and Ó Gráda (1986) Table A1. On a personal note [DGP]: My mother remembers, with great affection, her grandmother who was carried as an infant in arms by the family escaping from Ireland in 1849.
92 Akenson (2009).
93 See also the decline of the native Indian population of North America in Chapter Ten. Guinnane (1997).
94 Guinnane, Moehling and Ó Gráda (2006).
95 Kenny (2003).
96 Metzer (1978).
97 See discussions in the American Jewish Year Book (Della Pergola, 2007).
98 Milfull (2007) and Botticini (2003).
99 MacDonald (1998).
100 Botticini and Eckstein (2005). The former argument is associated with Brenner and Kiefer (1981) and earlier with Sombart (1951, 1911); the latter argument, with Roth (1945). Arguments emphasizing the desire to maintain religious identity were offered by Weber (1952) and Kuznets (1960).
101 Hiebert (1993).
102 Grief (2006).
103 Olegario (1999).
104 Gold (1999).
105 Estimating the flow through of Jewish immigrants has always been difficult simply because they might often be classified by the officials as Poles if they were Polish speaking and did not otherwise reveal their identities: Gartner (1960). For a contemporary statistical profile of London’s Jewish community see Piggott and Lewis (2006).
106 Gold (1999). Nor do they share the same low level of educational attainment and relative poverty as the earlier group.
107 Lee (2002).
108 Ward (2003).
109 Such tests normally required an immigrant to demonstrate the ability to read an excerpt from the US Constitution in a language of his or her choosing.
110 Goldin, (1994). An excellent discussion of policies restricting immigration can be found in Hatton and Williamson (2005), chapters 8 and 9.
111 Jenks and Lauck (1926); Hutchinson (1949). Brinley Thomas (1954, 1973) argues that US immigration restrictions after 1921 enhanced the rise of totalitarianism in central and eastern Europe. According to Thomas, because the escape route to American had closed, local governments in central, southern, and eastern Europe were forced to find places at home for increasing populations. The results were protectionism, large-scale government intervention in economic life, and, ultimately, totalitarianism.
112 One reason for the fall is suggested by Ferrie (2005) in which he argues that both intergenerational occupational mobility and geographic mobility declined in the US in the first half of the 20th century.
113 Hatton and Williamson (1998).
114 Borjas (1992). Interesting discussions of current immigration policy can be found in both Hatton and Williamson (2005) and in Borjas (1999).
115 The corresponding figure for employed natives is around 16 %. See Simon (1999).
116 Green and Green (1999).
117 See, for example, European Union, Europa, Summaries of EU Legislation and United States, Congressional Budget Office, Immigration Policy in the United States.
118 The quotation above can be found in Walker (1899), vol. II, a compendium of Walker’s writing. This is taken from a paper entitled “Immigration and Degradation” that appeared earlier in The Forum, vol. 11, 1891. Walker’s presidential address to the AEA in December 1890 dealt with immigration issues and he returned to the subject often over the next decade or more.
119 Uselding (1971).
120 Neal and Uselding (1972).
121 Lazonick and Brush (1985) suggest these immigrants were more easily “driven” by foremen to greater effort and individual productivity increases than was true of native-born Americans. The estimate is based on the work of Soltow (1975).
122 Gallman (1977), 27–31.
123 See Hatton and Williamson (2005) Tables 5.2 and 5.4 for details.
References
Akenson, Donald (2009) The Irish in Ontario: A Study in Rural History, 2nd ed., Montreal: McGill-Queen’s University Press.
Bailey, Samuel L. (1999) Immigrants in the Land of Promise, Italians in Buenos Aires and New York City, 1870–1914, Ithaca and London: Cornell University Press.
Baines, Dudley (1994) “European Emigration, 1815–1930: Looking at the Emigration Decision Again”, Economic History Review, 47(3), 525–44.
Bansak, Cynthia and Brian Chezum (2009) “How Do Remittances Affect Human Capital Formation of School-Age Boys and Girls?” American Economic Review, 99(2), 145–8.
Bernstein, William J. (2008) A Splendid Exchange; How Trade Shaped the Modern World, New York: Grove Press.
Borjas, George (1992) “National Origin and the Skills of Immigrants in the Postwar Period,” Immigration and the Work Force: Economic Consequences for the United States and Source Areas, eds., George Borjas and Richard B. Freeman, Chicago: University of Chicago Press.
Borjas, George (1999) Heaven’s Door, Princeton: Princeton University Press.
Borjas, George J. and Bernt Bratsberg (1996) “Who Leaves? The Outmigration of the Foreign-Born”, The Review of Economics and Statistics, 78(1), 165–76.
Botticini, Maristella (2003) “Jewish Diaspora,” in Joel Mokyr, ed., The Oxford Encyclopedia of Economic History, Oxford: Oxford University Press.
Botticini, Maristella and Zvi Eckstein (2005) “Jewish Occupational Selection: Education, Restrictions, or Minorities?” Journal of Economic History, 65(4), 922–48.
Boyle, Phelim P. and Cormac Ó Gráda (1986) “Fertility Trends, Excess Mortality, and the Great Irish Famine”, Demography, 23(4), 543–62.
Brenner, Reuven and Nicholas M. Kiefer (1981) “The Economics of the Diaspora: Discrimination and Occupational Structure,” Economic Development and Cultural Change, 29(3), 517–34.
Butler, James Davie (1896) “British Convicts Shipped to American Colonies”, American Historical Review, 2(1) (Oct.), 12–33.
Campbell, Cameron and James Lee (2001) “Free and Unfree Labor in Qing China Emigration and Escape among the Bannermen of Northeast China, 1789–1909”, History of the Family, 6, 455–76.
Carter, Susan B. (2006) “ Decennial Net Migration to English America, by Region and Race: 1630–1800”, Historical Statistics of the United States, Table Ad3–15.
Cervantes, M. and Guellec, D. (2002) The Brain Drain: Old Myths, New Realities, Paris: Directorate for Science, Technology and Industry, OECD.
Chang-Rodríguez, Eugenio (1958) “Chinese Labor Migration into Latin America in the Nineteenth Century”, Revista de Historia de América, 46 (Dec.), 375–97.
Charney, Michael, Brend S.A. Yeoh and Tong Chee Kiong, eds (2003) Chinese Migrants Abroad, Singapore: Singapore University Press.
Chen, Ta (1939) Emigrant Communities in South China: A Study of Overseas Migration and Its Influence on Standards of Living and Social Change, New York: Institute of Pacific Relations.
Chew Kenneth S.Y. and John M. Liu (2004) “Hidden in Plain Sight: Global Labor Force Exchange in the Chinese American Population, 1880–1940”, Population and Development Review, 30(1), 57–78.
Cinel, Dino (1991) The National Integration of Italian Return Migration, 1870–1929, Cambridge: Cambridge University Press.
Clay, Karen and Randall Jones (2008) “Migrating to Riches? Evidence from the California Gold Rush”, Journal of Economic History, 68(4), 997–1027.
Cloud, Patricia and David W. Galenson (1987) “Chinese Immigration and Contract Labor in The Late Nineteenth Century”, Explorations In Economic History, 24, 22–42.
Cloud, Patricia and David W. Galenson (1991) “Chinese Immigration: Reply To Charles McClain”, Explorations In Economic History, 28, 239–47.
Co, Catherine Y., Ira N. Gang, Myeong-Su Yun (2000) “Returns to Returning”, Journal of Population Economics, 13(1), 57–79.
Cohn, Raymond L. (1985) “Deaths of Slaves in the Middle Passage”, Journal of Economic History, 45(3), 685–92.
Curtin, Philip C. (1969) The Atlantic Slave Trade: A Census, Madison, Wisc.: University of Wisconsin Press.
Davies, Simon, Joshy Easaw, and Atanu Ghoshray (2009) “Mental Accounting and Remittances: A Study of Rural Malawian Households,” Journal of Economic Psychology, 30(3), 321–34.
Delbanco, Andrew (1986) “Looking Homeward, Going Home: The Lure of England for the Founders of New England “, The New England Quarterly, 59(3), 358–86.
Della Pergola, Sergio (2007) “World Jewish Population, 2007”, American Jewish Year Book, 107, 551–601.
Ee, Joyce (1961) “Chinese Migration to Singapore, 1896–1941”, Journal of Southeast Asian History, 2(1), 33–51.
Ekirch, A. Roger (1985) “Bound for America: A Profile of British Convicts Transported to the Colonies, 1718–1775”, The William and Mary Quarterly, Third Series, 42(2) (April) 184–200.
Ekirch, A. Roger (1987) Bound for America: The Transportation of British Convicts to the Colonies, 1718–1775, Oxford: Clarendon Press.
European Union (current), Europa, Summaries of EU Legislation at http://europa.eu/legislation_summaries/justice_freedom_security/free_movement_of_persons_asylum_immigration/jl0001_en.htm.
Ferrie, Joseph P. (1997) “The Entry into the U.S. Labor Market of Antebellum European Immigrants, 1840–1860”, Explorations in Economic History, 34(3), 295–330.
Ferrie, Joseph P. (1999) Yankeys Now: Immigrants in the Antebellum United States, 1840–1860, New York and Oxford: Oxford University Press.
Ferrie, Joseph P. (2005) “The End of American Exceptionalism? Mobility in the U.S. Since 1850,” Journal of Economic Perspectives, 19(3), 199–215.
Finkelman, A. Paul and Joseph C. Miller, eds., (1998) Macmillan Encyclopedia of World Slavery. New York: Macmillan Reference USA.
Fogel, Robert William (1989) Without Consent or Contract: The Rise and Fall of American Slavery, New York: W. W. Norton.
Fogleman, Aaron S. (1998) “From Slaves, Convicts, and Servants to Free Passengers: The Transformation of Immigration in the Era of the American Revolution”, Journal of American History, 85(1) (June), 43–76.
Forster, Peter (2004) “Ice Ages and the Mitochondrial DNA Chronology of Human Dispersals: A Review,” Philosophical Transactions: Biological Sciences, The Evolutionary Legacy of the Ice Ages, 359, 1442, 255–64.
Freedman, Maurice (1957) Chinese Family and Marriage in Singapore, London: H.M. Stationery Office.
Freeman, Richard B. (2006) “People Flows in Globalization”, The Journal of Economic Perspectives, 20(2) (Spring), 145–70.
Freund, Caroline L. and Nikola Spatafora (2005) “Remittances: Transactions Costs, Determinants, and Informal Flows”, World Bank Policy Research Working Paper no. 3704, Washington, D.C.: World Bank.
Friedberg, Rachel M. and Jennifer Hunt (1995) “The Impact of Immigrants on Host Country Wages, Employment, and Growth.” Journal of Economic Perspectives, 9(2), 23–44.
Galenson, David (1977) “Immigration and the Colonial Labor System: An Analysis of Length of Indenture,” Explorations in Economic History, 14(4), 360–77.
Galenson, David (1981) White Servitude in Colonial America: An Economic Analysis, New York: Cambridge University Press.
Gallman, Robert E. (1977) “Human Capital in the First 80 Years of the Republic: How Much Did America Owe the Rest of the World?”, American Economic Review, 67(1), 27–31.
Gartner, Lloyd P. (1960) “Notes on the Statistics of Jewish Immigration to England 1870–1914”, Jewish Social Studies, 22(2), 97–102.
Gibson, Walter (1683?) Proposals. Walter Gibson, Merchant in Glasgow, To Such Persons as are Desirous to Transport Themselves to America. Glasgow (?).
Gold, Steven J. (1999) “From “The Jazz Singer” to “What a Country!” a Comparison of Jewish Migration to the United States, 1880–1930 and 1965–1998”, Journal of American Ethnic History, 18(3), 114–41.
Goldin, Claudia (1994) “The Political Economy of Immigration Restriction in the United States, 1890 to 1921,” in Claudia Goldin and Gary Libecap, eds., The Regulated Economy, Chicago: University of Chicago Press.
Green, Alan G. and David A. Green (1999) “The Economic Goals of Canada’s Immigration Policy: Past and Present”, Canadian Public Policy/Analyse de Politiques, 25(4), 425–51.
Green, Alan G., Mary MacKinnon, Chris Minns (2002) “Dominion or Republic? Migrants to North America from the United Kingdom, 1870–1910”, Economic History Review, 55(4), 666–96.
Grief, Avner (2006) Institutions and the Path to the Modern Economy: Lessons from Medieval Trade, Cambridge: Cambridge University Press.
Grubb, Farley (1987) “Morbidity and Mortality on the North Atlantic Passage: Eighteenth-Century German Immigration “, Journal of Interdisciplinary History, 17(3), 565–85.
Grubb, Farley (1988) “The Auction of Redemptioner Servants, Philadelphia, 1771–1805,” Journal of Economic History, 48(3), 583–603.
Grubb, Farley (1994) “The End of European Immigrant Servitude in the United States: An Economic Analysis of Market Collapse, 1772–1835,” Journal of Economic History, 54(4), 794–5.
Grubb, Farley and Tony Stitt (1994) “The Liverpool Emigrant Servant Trade and the Transition to Slave Labor in the Chesapeake, 1695–1707: Market Adjustments to War,” Explorations in Economic History, 31(3), 376–405.
Guinnane, T.W. (1997) The Vanishing Irish: Households, Migration, and the Rural Economy in Ireland, 1850–1914, Princeton: Princeton University Press.
Guinnane, Timothy W., Carolyn M. Moehling and Cormac Ó Gráda (2006) “The Fertility of the Irish in the United States in 1910”, Explorations in Economic History, 43, 465–85.
Gundel, Sebastian and Heiko Peters (2008) “What Determines the Duration of Stay of Immigrants in Germany? Evidence from a Longitudinal Duration Analysis”, International Journal of Social Economics, 35(11), 769–82.
Haines, Robin, John McDonald and Ralph Shlomowitz (2001) “Mortality and Voyage Length in the Middle Passage Revisited”, Explorations in Economic History, 38, 503–33.
Hanes, Christopher (1996) “Turnover Costs and the Distribution of Slave Labor in Anglo-America,” Journal of Economic History, 56(2), 307–29.
Harley, C. Knick (2008) “Steers Afloat: The North Atlantic Meat Trade, Liner Predominance, and Freight Rates, 1870–1913”, Journal of Economic History, 68(4), 1028–58.
Hatton, Timothy J. and Jeffrey G. Williamson (1998) The Age of Mass Migration: Causes and Economic Impact, New York and Oxford: Oxford University Press.
Hatton, Timothy J. and Jeffrey G. Williamson, (2005) Global Migration and the World Economy, Cambridge: Cambridge University Press.
Heavner, Robert (1978) “Indentured Servitude: The Philadelphia Market, 1771–1773,” Journal of Economic History, 38(3), 701–13.
Hiebert, Daniel (1993) “Jewish Immigrants and the Garment Industry of Toronto, 1901–1931: A Study of Ethnic and Class Relations”, Annals of the Association of American Geographers, 83(2), 243–71.
Higgs, Robert (1978) “Landless by Law: The Japanese Immigrants in California Agriculture to 1941”, Journal of Economic History, 38(1), 205–51.
Horwitz, Morton (1997) The Transformation of American Law, 1780–1860, Cambridge: Harvard University Press.
Humphreys, R. Stephen (1977a) “The Emergence of the Mamluk Army”, Studia Islamica, 45, 67–99.
Humphreys, R. Stephen (1977b) “The Emergence of the Mamluk Army (Conclusion)”, Studia Islamica, 46, 147–82.
Hutchinson, Edward (1949) “Immigration Policy Since World War I,” Annals of the American Academy of Political and Social Science, 262, 15–21.
Innis, Harold A. (1956) “Unused Capacity as a Factor in Canadian Economic History”, in M. Q. Innis, Essays in Canadian Economic History, Toronto: University of Toronto Press, pp. 141–55.
Ireland, Republic of (current), Statistics, Population, Central Statistics Office Ireland, http://www.cso.ie/statistics/Population1901-2006.htm.
Jackson, Peter (1990) “The “Mamlu¯k” Institution in Early Muslim India”, Journal of the Royal Asiatic Society of Great Britain and Ireland, 2, 340–58.
Jasso, Guillermina and Mark R. Rosenzweig (1982) “Estimating the Emigration Rates of Legal Immigrants Using Administrative and Survey Data: The 1971 Cohort of Immigrants to the United States”, Demography, 19(3), 279–90.
Jefferson, Thomas (1788) Notes on the State of Virginia, London: John Stockdale.
Jenks, Jeremiah and Jeff Lauck (1926) The Immigration Problem, New York: Funk & Wagnalls.
Kanazawa, Mark (2005) “Immigration, Exclusion, and Taxation: Anti-Chinese Legislation in Gold Rush California”, Journal of Economic History, 65(3), 779–805.
Kenny, Kevin (2003) “Diaspora and Comparison: The Global Irish as a Case Study”, Journal of American History, 90(1), 134–62.
Killick, J.R. (2008) “North Atlantic Steerage Fares, Mortality, and Travel Conditions: Evidence From The Cope Line Passenger Service, 1820–1870”, Leeds University, Prepared for the Economic History Society (March).
Kuznets, Simon (1960) “Economic Structure and Life of the Jews,” in Louis Finkelstein, ed., The Jews: Their History, Culture, and Religion, vol. 2, Philadelphia: Jewish Publication Society of America.
Lazonick, William and Thomas Brush (1985) “The ‘Horndal Effect’ and Early US Manufacturing,” Explorations in Economic History, 22(1), 53–96.
Lee, Erika (2002) “The Chinese Exclusion Example: Race, Immigration, and American Gatekeeping, 1882–1924”, Journal of American Ethnic History, 21(3), 36–62.
Lewis, Frank (1988) “The Cost of Convict Transportation from Britain to Australia, 1796–1810”, Economic History Review, 41(4), 507–24.
Lewis, W. Arthur (1978) Growth and Fluctuations, 1870–1913, London & Boston: G. Allen & Unwin.
Ley, D. and Kobayashi, A. (2005) “Back to Hong Kong: Return Migration or Trans-national Sojourn?”, Journal of Transnational Affairs, 5(2), 111–27.
Lower, Arthur R.M. (1974) Great Britain Woodyard: British America and the Timber Trade, 1763–1867, Montreal: McGill–Queens University Press.
Lucas, Robert E.B. and Oded Stark (1985) “Motivations to Remit: Evidence from Botswana”, Journal of Political Economy, 93(5), 901–18.
MacDonald, Kevin (1998) “Jewish Involvement in Shaping American Immigration Policy, 1881–1965: A Historical Review”, Population and Environment, 19(4), 295–356.
Mackie, James (2004) “Five Southeast Asian Chinese Empire Builders: Commonalities and Differences”, in Chinese Migrants Abroad, eds. Michael W. Charney, Brenda S.A. Yeoh and Tong Chee Kiong, Singapore: Singapore University Press, 3–22.
Magee, Gary B. and Andrew S. Thompson (2006) “ ‘Lines of credit, debts of obligation’: migrant remittances to Britain, c.1875–1913,” Economic History Review, 59(3), 539–77.
Mansoor, A. & Quillin, B., eds. (2007) Migration and Remittances: Eastern Europe and the former Soviet Union, New York: The World Bank.
McClain, Jr., Charles J. (1990) “Chinese Immigration: A Comment On Cloud And Galenson”, Explorations In Economic History, 27(3), 363–78.
McCusker, John J. (1997) “The Tonnage Of Ships Engaged In British Colonial Trade During The Eighteenth Century”, in Essays in the Economic History of the Atlantic World, ed. John J. McCusker, New York and London: Routledge, pp. 43–75.
Metzer, Jacob (1978) “Economic Structure and National Goals – The Jewish National Home in Interwar Palestine,” Journal of Economic History, 38(1), 101–19.
Milfull, John (2007) “Exile, Diaspora and Jewish Identity”, Diaspora(s): Movements and Cultures, eds. Nicholas Hewitt and Dick Geary, Nottingham: Critical, Cultural and Communications Press, 7–15.
Mokyr, Joel (1983) Why Ireland Starved: A Quantitative and Analytical History of the Irish Economy, 1800–1850, London and Boston: Allen and Unwin.
Mokyr, Joel and Cormac Ó Gráda (2002) “What Do People Die of During Famines: the Great Irish Famine in Comparative Perspective”, European Review of Economic History, 6, 339–63.
Mulder, Tammany J., Betsy Guzmán and Angela Brittingham (2002) “ Evaluating Components of International Migration: Foreign-Born Emigrants”, Population Division, US Census Bureau, Washington, D.C. 20233. http://www.census.govwww.census.gov.
Mulder, Tammany J., Frederick W. Hollmann, Lisa R. Lollock, Rachel C. Cassidy, Joseph M. Costanzo and Josephine D. Baker (2001) US Census Bureau Measurement of Net International Migration to the United States: 1990 to 2000, Population Division Working Paper No. 51, Washington: U.S. Census Bureau.
Neal, Larry and Paul Uselding (1972) “Immigration, A Neglected Source of American Economic Growth: 1790–1912,” Oxford Economic Papers, 24(1), 68–88.
Ng, Wing Chung (1998) “Becoming ‘Chinese Canadian’: The Genesis of a Cultural Category”, in The last Half Century of Chinese Overseas, ed. Elizabeth Sinn, Hong Kong: Hong Kong University Press, 203–15.
OECD (2008) “Economic Effects of Migration on the Home Country: A Simple Life-cycle Model”. OECD Development Centre, Vol. 2007, 16, 56–69 and “Return”, 122–30.
Olegario, Rowena (1999) “ ‘That Mysterious People’: Jewish Merchants, Transparency, and Community in Mid-Nineteenth Century America”, The Business History Review, 73(2), 161–89.
Pan, Lynn (1990, 1994) Sons of the Yellow Emperor, London: Secker and Warburg.
Parr, Joy (1980) Labouring Children: British Immigrant Apprentices to Canada, 1869–1924, London: Croom Helm.
Piggott, Gareth and Rob Lewis (2006) 2001 Census Profile: The Jewish Population of London, London: Greater London Authority.
Poon, Wei Chi (2007) “ Displaying History: The Challenges of Creating a Chinese Overseas Exhibition”, in Chinese Overseas: Migration, Research and Documentation, Tan Chee-Beng, Colin Storey and Julia Zimmerman (eds.), Hong Kong: The Chinese University Press, 387–408.
Richardson, David (1987) “The Costs of Survival: The Transport of Slaves in the Middle Passage and the Profitability of the 18th Century British Slave Trade”, Explorations in Economic History, 24, 178–96.
Robson, L.L. (1965) The Convict Settlers of Australia, Melbourne: Melbourne University Press.
Roth, Cecil (1945) The Jewish Contribution to Civilisation, Oxford: The East and West Library.
Sánchez-Alonso, Blanca (2000) “Those Who Left and Those Who Stayed behind: Explaining Emigration from the Regions of Spain, 1880–1914”, Journal of Economic History, 60(3), 730–55.
Simon, Julian L. (1999) The Economic Consequences of Immigration, 2nd ed., Ann Arbor: University of Michigan Press.
Smith, Abbot Emerson (1934) “The Transportation of Convicts to the American Colonies in the Seventeenth Century”, American Historical Review, 39(2) (January), 232–49.
Soltow, Lee (1975) Men and Wealth in the United States, 1850–1870, New Haven: Yale University Press.
Sombart, Werner (1951, 1911) The Jews and Modern Capitalism, Glencoe, IL: Free Press.
Suzuki, Masao (1995) “Success Story? Japanese Immigrant Economic Achievement and Return Migration, 1920–1930”, Journal of Economic History, 55(4), 889–901.
Tannenbaum, M. (2007) “Back and Forth: Immigrant’s Stories of Migration and Return”, International Migration, 45(5), 147–75.
Taylor, Alan M. and Jeffrey G. Williamson (1997) “Convergence in the Age of Mass Migration”, European Review of Economic History, I, 27–63.
Thomas, Brinley (1954, 1973) Migration and Economic Growth; a Study of Great Britain and the Atlantic Economy, Cambridge: Cambridge University Press.
Thomas, Brinley (1972) Migration and Urban Development: a Reappraisal of British and American Long Cycles, London: Methuen.
United Kingdom (current) Census Reports, Northern Ireland Statistics and Research Agency: http://www.nisranew.nisra.gov.uk/census/Census2001Output/PopulationReport/populationreport1.html.
United States (2006) Congressional Budget Office, Immigration Policy in the United States, (February) at http://www.cbo.gov/ftpdocs/70xx/doc7051/02-28-Immigration.pdf.
United States Bureau of the Census (1999) The Foreign-Born Population of the United States, Table 2, Internet Release, 9 March 1999, http://www.census.gov/population/www/documentation/twps0029/tab02.html.
Uselding, Paul (1971) “Conjectural Estimates of Gross Human Capital Inflow to the American Economy,” Explorations in Economic History, 9(1), 49–61.
Walker, Francis A. (1899) Discussions in Economics and Statistics, edited by Davis R. Dewey, New York: Henry Holt and Company.
Walker, Townsend (1977) “Gold Mountain Guests: Chinese Migration to the United States, 1848–1882”, Journal of Economic History, 37(1), 264–67.
Wang, Gungwu (1991) China and the Chinese Overseas, Hong Kong: Times Academic Press.
Wang, Gungwu (1998) “Upgrading the Migrant: Neither Huaqiao nor Huaren”, in The Last Half Century of Chinese Overseas, ed. Elizabeth Sinn, Hong Kong: Hong Kong University Press, 15–33.
Ward, W. Peter (2003) White Canada Forever, 3rd ed., Vancouver: UBC Press.
Weber, Max (1952), Ancient Judaism, translated and edited by Hans H. Gerth and Don Martindale, Glencoe, IL: Free Press.
Wegge, Simone (2003) “The Hesse-Cassel Emigrants: A New Sample of Trans-Atlantic Emigrants Linked to Their Origins”, Research in Economic History, ed. Alexander J. Field, Boston: Elsevier Science, 357–405.
Wegge, Simone (2008) “Network Strategies of Nineteenth Century Hesse-Cassel Emigrants”, History of the Family, 13, 296–314.
Wiedemann, Thomas (1981) Greek and Roman Slavery, Baltimore: The Johns Hopkins University Press.
World Bank (2008) Migration and Remittances Factbook 2008, http://www.econ.worldbank.org/external/.