CHAPTER 3
FROM THE INSIDE
WHAT IT'S ALL ABOUT 
- Generating value for customers
- Assessing competitive advantage
- Defining the mission and objectives
- Summarising the overall situation
- Cross-checking with actual performance
Multiple aspects of the internal situation can be evaluated – for example, products, services, brand, costs, technology, people, skills, systems, organisation structure and culture, leadership, vision, performance, and financial strength. So where do you start?
To focus your thinking and data collection, consider that the only things that matter about the inside are those that affect the fit of the organisation with its environment. Products, services and brand have to be understood in the context of how they deliver value for customers. Costs and technology need to be evaluated not in absolute terms, but how they compare to competitors.
Bearing in mind this need to focus on how the internals fit with environment, there are just a few important questions that need to be answered. The first is: How much value are we creating for customers and stakeholders? To avoid a navel-gazing exercise about your own organisation, ask yourself what it is that you do to meet the needs of those you serve. What value do you create for them? What makes them want to buy, or not buy, your product or service? This is sometimes described as a CVP (customer value proposition) or USP (unique selling point). It can also be used to describe the perspective of other important stakeholders, e.g. employees, partners, government, donors and local communities.
The second question is: What is your competitive advantage? Or, to be blunt, Are you winning? In a competitive market, being good at serving customers is not enough. You have to be better than the competition.
It may seem surprising to start an analysis of the ‘internal’ situation by involving customers, stakeholders and competitors, but internal capabilities and characteristics are only valuable if they create more value for stakeholders than competitors. By focusing on these two questions you will be less likely to fall into the trap of listing what your organisation is good at, rather than seeing how those characteristics contribute to its success or failure.
One other important aspect of the internal situation is: What are our current mission and objectives? While your performance may ultimately be determined by your competitive position, you need to understand what your organisation is ultimately trying to achieve – your mission and strategic objectives.
CREATING VALUE FOR CUSTOMERS
Why start with customers? Because being the strongest competitor is not very rewarding if you do not create any value for customers – as the leading producers of horse-drawn carriages, vacuum tubes, and vinyl records will testify.
Those who find new ways of creating value for customers often end up as market leaders. Apple created the iPod and the iPhone, Google its search engine, McDonald's provides reliable fast food at low cost, Fairtrade enables consumers to support developing country producers, Oxfam ensures that your donations are put to good use, and so on. All of these organisations were leaders in creating new sources of value for their customers and stakeholders.
WHO SAID IT...
“Profit in business comes from repeat customers, customers that boast about your product and service, and that bring friends with them.”
– W. Edwards Deming
Finding new ways to create value through what is sometimes termed value innovation, is particularly helpful for new businesses. It also appeals to the hopes of many managers in mature organisations who know how tough it is to operate in mature, competitive markets.
Note that some organisations have more than one customer. For example, traditional newspapers or magazines compete for both readers and advertisers. In such businesses each customer needs to be analysed separately. The analysis can also be performed for ‘stakeholders’ rather than ‘customers’.
EVALUATING CUSTOMER VALUE CREATION
There are many ways to collect information about what your customers value and how they view your organisation, including talking to sales people, analysing competitor products, conducting customer, distributor or retailer interviews, carrying out focus groups or market research, and comparing prices and market shares of different products.
What you need is a simple tool to draw together the implications of the data collected. A simple first step is to list customers’ purchasing criteria. For example, the following factors might influence how a tourist travelling from London to a holiday destination selects a particular airline:
- price;
- ambience of the airport;
- convenience of airport location;
- comfort of the seat;
- convenience of flight time;
- reliability;
- friendliness of staff;
- perks for frequent traveller.
Having identified the basis on which customers make their choices you can now compare your ‘customer value proposition’ (CVP) vs. that of competitors. A useful tool to use is a ‘value curve’. For example, a comparison between BA and Ryanair on the purchasing criteria listed above might look like the following:
Value curve for two airlines
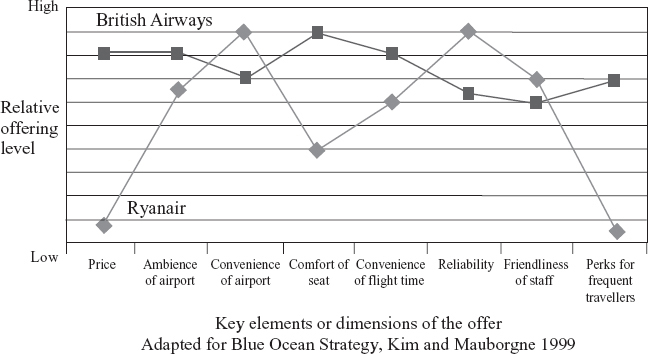
This tool provides a simple way of comparing CVPs and works particularly well for mass market products. It also helps in sparking and focusing a debate – for example, you might disagree with the chart and have a different view on Ryanair and BA. Initial discussions should be followed by more detailed customer research.
Note that the value curve describes the product but says little about how customers weigh the importance of each of the criteria. A useful refinement is to circle the most important criteria, or rank them.
THE IMPORTANCE OF COMPETITIVE ADVANTAGE
Creating value is vital but not sufficient. As stated earlier, in a competitive market you have to do so better than alternative providers. For example, traditional airlines undoubtedly created a lot of value for customers, as demonstrated by the steady growth of the industry, but low-cost airlines created even more value, and have grown much faster than their traditional counterparts. Similarly, Nokia undoubtedly made great mobile phones, but Apple's iPhone was better, and was therefore able to win significant market share. It is not the value you create that counts, but the extent to which you create more value than competitors.
A fundamental idea in business strategy is that competitive advantage is the key to long- term success. In a competitive marketplace, the organisation which has an advantage should enjoy a virtuous circle of winning more customers, achieving economies of scale, making higher margins, investing in better products, and thus winning yet more customers.
As evidence of the importance of competitive advantage, consider that profits in most businesses are highest for the leading competitor. According to one study, the leading competitor in the average industry made a return on investment of 32%, while the number two made only 22% – being the best was worth a full 10 percentage points of profitability. Some businesses can be described as ‘winner takes all’ – there is only one successful competitor. (‘Network’ businesses such as eBay, Google or Facebook tend to have these characteristics). In other industries, coming second or third provides a reasonable living but the goal is still to be as close to the number one competitor as possible.
A strong competitive position can outweigh the disadvantages of being in a tough industry. Ryanair, for example, is profitable in the notoriously tough airlines business. A competitive advantage can even compensate for being mediocre at operations. For example, Saudi Arabia does not claim to have the best technology for extracting oil, or to have unique skills in operating oil fields, but it enjoys a competitive advantage in oil production because its costs of extraction are so low.
Competitive advantage is such a vital concept that there is a vast debate about its roots. To be a good strategist you need to understand something of this debate, the sources of advantage in your business, and how competitive your organisation is.
DIFFERENT WAYS TO EVALUATE ADVANTAGE
A simple way of thinking about advantage is that it comes in two forms – cost and customer value or differentiation. In other words, something is an advantage only if it allows organisations to have lower costs or to provide higher value to customers. It is hard to be both a cost and differentiation leader, as such companies risk being ‘caught in the middle ’. However, there are a few, exceptional organisations who compete successfully on a mix of both dimensions – for example, Singapore Airlines and Toyota.
Another way of thinking about advantage is that it comes from the positions that an organisation owns. A position provides the ability to earn a superior return, such as a brand, patent, market share, or privileged access to low-cost resources. Valuable positions are typically difficult to develop – particularly in a mature business – although they can often be bought and sold. In the 1960s and 70s, companies with strong positions appeared to be the most successful in the long run, whether they were in mature markets such as cars (GM and Ford) or earth moving equipment (Caterpillar), or higher growth markets such as computers (IBM) or photocopiers (Xerox).
WHO YOU NEED TO KNOW
Bruce Henderson
Henderson (1915–1992), founder of the Boston Consulting Group (BCG), was one of the most innovative thinkers about strategy. Like Michael Porter and Henry Mintzberg, Henderson studied engineering and, like Porter, attended Harvard Business School, leaving early to work for Westinghouse. He was named one of Time Magazine's top 10 news-makers under 30 years old.
Henderson set up a consulting arm for the Boston Safe Deposit and Trust Company in 1963, spinning it off as BCG in 1974. Henderson developed and popularised many important concepts, including the Experience Curve (stating that costs come down in relation to the cumulative production of the product) and the famous Growth-Share Matrix (with its ‘cash cows’, ‘stars’, ‘dogs’, and ‘question marks’). He drew attention to competitive advantage as the driver of long-term success. His timing was perfect as US companies, grown fat on the post-war boom, suddenly needed to reassess their corporate strategies following the oil crisis of 1973 and the emergence of Japanese competitors.
A brilliant man who was also a great communicator, his pithy ‘perspectives’, consisting of a few hundred words which delivered a powerful insight, were read widely. Under Henderson BCG was an innovative, creative organisation, although it suffered, as Henderson did, from a lack of focus on serving its customers’ needs, being more inclined towards intellectual elegance.
A number of other insightful strategists developed at BCG under Henderson's leadership and influence, such as Tom Hout, Philip Evans, Tom Wurster and George Stalk. Others, such as Bill Bain, left to form their own companies. BCG also inspired competitors, such as McKinsey, to develop their own strategy practices.
However, as the 1980s and 90s demonstrated, even companies with strong positions could be outmanoeuvred. Toyota and Honda took on the US auto giants, and Komatsu caught up with Caterpillar. Emerging competitors such as Compaq, Intel and Microsoft took market share away from IBM, as did Canon from Xerox.
Part of the reason for the success of these competitors, who started out at a positional disadvantage, was their emphasis on building and using the superior capabilities that resulted from combining an aspirational organisational culture with new technology and manufacturing processes. These allowed them to be more efficient and provide superior products, out-competing larger but more cumbersome and less capable competitors. (There is an arcane argument about the differences between ‘capabilities’ and ‘competencies’ that is not reviewed here – so consider them as equivalent).
WHO SAID IT...
“... the essence of strategy is not the structure of a company's position in products and markets, but the dynamics of its behaviours.”
– George Stalk
For example, Honda used its leaner manufacturing processes and expertise in the internal combustion engine to sell cheaper and more reliable cars. Canon used its expertise in lenses to build market share in photocopiers.
WHO YOU NEED TO KNOW
Tom Peters
Tom Peters is one of the most provocative thinkers and speakers on strategy. Born in 1942, he studied engineering at Cornell and completed an MBA and PhD at Stanford. Peters served in Vietnam and was a senior White House advisor on drug abuse before joining management consultants McKinsey in 1974. He quickly became involved in a project to identify what made organisations effective. He and his colleagues soon realised that the answer went beyond structure and strategy – McKinsey's view at the time.
Working with Robert Waterman, Peters put together a view on excellence that turned into the best-selling book In Search of Excellence. Ultimately, the pair would prove the accuracy of the adage that ‘no prophet is welcome in his hometown’ – both leaving McKinsey to work independently.
‘In Search of Excellence’ argued that the key to strategic sense was operational and organisational excellence, as well as what others later termed ‘capabilities’ – captured in eight themes including ‘bias for action’, ‘close to the customer’, ‘simple and lean organisational structures’, and ‘stick to the knitting’. Inspirational for some, others thought it deeply flawed, especially when a third of the ‘excellent’ companies profiled in the book were in serious financial and strategic difficulties within a few years. It also introduced the famous 7S framework – derided by some for its lack of rigour and lauded by others as a counterbalance to the narrow-mindedness of economists as exemplified by Michael Porter.
Peters is an inspirational speaker. He laid the ground for similar gurus such as Richard Pascale, Rosabeth Moss Kanter, John Kotter, Jim Collins and Gary Hamel. He provides a reminder that strategy is only as valuable as the quality of its execution. One of his favourite quotes is ‘Execution is strategy’. However, he and his followers failed to create strong intellectual underpinnings, unlike Porter's economics-based view of strategy. Peters sparked a revolution, but it is still just that – an anti–establishment challenge, but not a well-researched and consistent replacement.
Particular attention has focused recently on those capabilities that allow organisations to respond effectively to turbulent change. Don Sull, a professor at London Business School, has highlighted how adaptability and resilience are of particular value as sources of advantage at such times. A strategic dilemma for many organisations is how to manage the compromise between the benefits of being highly focused on optimising their current competitive position, while retaining enough excess resources to survive lean times and adapt to changing situations.
The implication is that it can be helpful to look at competitive advantage in two ways: How well suited is an organisation to its current environment? And how able is it to adapt and survive turbulent change?
WHO SAID IT...
“ You have to be fast on your feet and adaptive, or else a strategy is useless. ”
– Charles de Gaulle
A competitive advantage is more valuable if it is sustainable – in other words, it is not easily copied. For example, the production facilities of the clothes retailer Zara allow it to customise the colours and designs of the items in its stores. This is a relatively sustainable source of advantage because it is difficult to copy, unlike a retail strategy based on extending opening hours or having a sale, which can be rapidly copied by competitors.
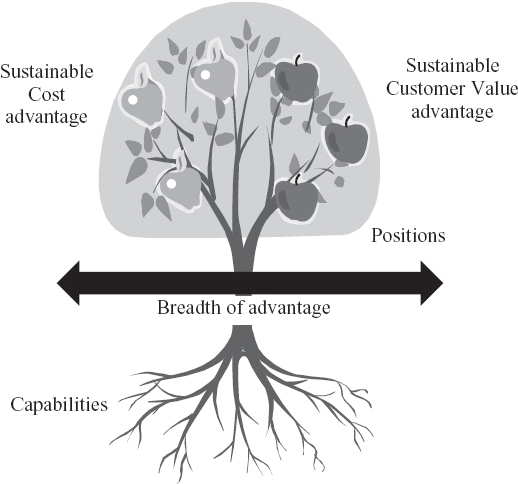
The following figure shows how different ways of thinking about advantage fit together. The roots of competitive advantage are the capabilities of an organisation, which gives rise to its positions. These are of value if they bear the two fruits of advantage – lower costs or higher value. The more sustainable these advantages are, the better. A further source of advantage is the breadth of the tree – the ability to avoid being over-reliant on a narrow niche. This can be achieved by being agile or by having abundant resources, such as a strong balance sheet or a global scope that foster resilience in times of trouble.
The key idea to take away from this section is that competitive advantage comes from a broad network of positions and capabilities that lead to sustainably low costs and high levels of customer value. Understanding exactly how this network operates can be difficult, requiring a mix of analysing hard data, such as costs and prices, and soft data, such as the motivation of the staff and management team. It also requires a broad range of data covering the organisation, its competitors and the environment. Fortunately, there are many tips, tools and frameworks that can help. A selection is presented below, with further references at the end of the chapter.
Different perspectives on competitive advantage
EVALUATING COST AND CUSTOMER VALUE ADVANTAGE
A very direct approach to evaluating your competitive advantage is to compare your costs and price point with those of different competitors, although this normally requires extensive data collection, modelling and some educated guesses. The exhibit below offers a comparison of the cost and average price per passenger mile for a traditional and a low-cost airline. The stacked bars represent the major elements of cost for each competitor. The lines at the top of the bars indicate the price.
The reasons for differences between the two types of competitor are summarised on the right of the chart. For example, budget airlines typically have 20% more seats and enjoy a 30% higher utilisation of those seats – providing significant cost savings on fuel, plane leasing, staff and airport charges.
Example: Advantage of low cost airlines
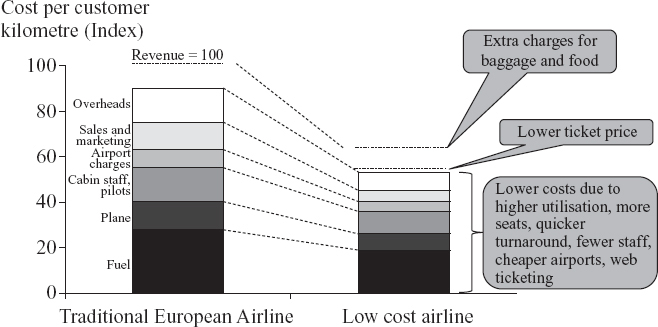
This approach forces the strategist to be precise about the size, nature and drivers of advantage. However, it can be difficult to obtain the data required, so personal judgment and some back-of-the-envelope calculations will be required.
To make this approach work, it is best to start with your own cost structure and average prices and think through how these might vary for your competitors. For example, in the exhibit above, the starting information was the cost structure of a traditional airline. Differences in average prices were estimated using travel websites. Data on the number of seats and utilisation of planes were collected through surveys of budget airlines carried out in airports.
EVALUATING POSITIONAL SOURCES OF ADVANTAGE
Cost and customer value advantages are partly generated by the positions of an organisation, such as market share, customer relationships, long-term contracts or established distribution networks. However, positional advantage is a rather woolly concept. The following checklist will help you make an assessment:
- Market positions arising from the benefits of market share, scale, experience and scope. Market share often provides a competitive advantage. For example, GE enjoys a scale advantage in its gas turbine business because, as market leader, it is able to spread its R&D costs over a bigger base of business. It also benefits from ‘experience curve’ effects, whereby the more gas turbines it makes, the more the cost of production declines due to the learning acquired. Because it makes more turbines than anyone else, GE has the greatest experience curve effects, the lowest costs, and the most advanced products. ‘Scope’ effects are the benefits of competing across a range of segments. For example, GE's presence in financial services enables its turbine business to provide attractive financing packages to potential customers.
- Brand and reputation. A strong brand can be a particularly valuable source of advantage, particularly in consumer goods. Brands may be closely linked to scale advantage, as in the case of Ford or Coca Cola, for example, but advantages can also come from having a distinct position in a market or niche, such as Red Bull or Bollinger champagne.
- Value chain design and vertical integration. Having particular positions along the industry value chain (i.e., the sequence of activities involved in the industry) can bestow an advantage. For example, the personal computer industry value chain includes activities such as the manufacture of hardware, software, marketing, retailing and after-sales service. Apple has chosen to remain relatively vertically integrated – having a presence in all of these activities – in contrast to many of its competitors. This is currently a source of advantage, allowing Apple to have a distinct positioning in laptop computers, although at times the extra costs of this strategy have nearly sunk the company.
- Access to unique resources or relationships. Pharmaceutical companies extract huge value from the patents they hold. Mining companies seek to secure the lowest cost sources of minerals. National defence companies typically gain a significant share of national defence spending due to their political influence. All these illustrate the advantages that flow from favoured access to intellectual property, raw materials, technology, suppliers, customers or government relationships.
- Input costs. In mature, low-tech industries such as textiles, clothing or plastic toys, access to low-cost labour can be key. Other inputs may be important, such as low-cost energy. Large aluminium plants, which use a lot of electricity, are often located near a source of low-cost hydro power.
- Focus. Being a specialist can provide an advantage, often through a mix of the sources described above. German mid-sized companies are often highly specialised (for example, in garden rose breeding, glockenspiels, portable sanitation or ring tones). Being a specialist provides a range of positional advantages such as scale within a niche, experience, brand, vertical integration and access to specialist local suppliers.
EVALUATING CAPABILITIES
As with sources of positional advantage, it can be helpful to have a checklist of different types of capability which create advantage. Such lists can be grouped either in terms of the benefits of the capabilities (e.g. speed, operational effectiveness, agility and innovativeness), or the nature of the capabilities themselves. Examples of the latter include:
- IT and logistics systems. The success of both Wal-Mart and Tesco is based on the ability of their logistics systems not only to stock the shelves, but to provide actionable information to management about what is selling.
- Processes. Cisco has developed standardised processes for acquiring and integrating new technology companies, allowing it to remain at the forefront of the rapidly developing hardware businesses in which it competes.
- Skills. Many Italian mid-sized companies and the regions in which they are located seek to be the most skilled in particular niches, such as glass manufacturing in Murano.
- People. Consulting companies such as McKinsey and BCG pride themselves on their ability to attract the best and the brightest. BCG uses a particular metric to measure success in recruiting: the percentage of candidates who have had an offer from both McKinsey and BCG, but who eventually choose BCG. Small companies often rely on one or two exceptional key people.
- Organisational structure. Companies often reorganise to generate more value from their businesses. For example, Unilever took some of the decision-making powers from its highly autonomous country organisations and put it in the hands of global product managers.
- Organisational culture, style, values and behavioural norms. Southwest Airlines developed a culture based on having fun (as well as working hard) that differentiated it from the more fractious workforces of its traditional rivals.
Another way to map capabilities is the 7S model, which can be investigated further via a web search.
Note that the distinction between positional and capability advantages is not always clear. Don't worry about which category a particular source of advantage belongs to; the distinction is intended only to ensure that you generate a comprehensive list of what drives advantage in the industry.
ARE WE WINNING?
With so many ways to evaluate value creation and competitive advantage, it is easy to end up with a lot of lists and a mishmash of ideas. A relatively simple method for drawing this thinking together is shown in the following chart, which provides an overall perspective on how well your organisation is doing. It collates all the analysis covered in this chapter into a view of how well you are serving customers and how well you rank against your competitors, as a basis for debate about any further improvements that could be made.
The top box on the left shows the market segment being evaluated (don't forget that competition occurs primarily at the segment level). The example compares a potential budget competitor to British Airways and Virgin on the highly profitable London/New York route. The box in the top right adds the customer perspective, highlighting the dimensions on which a customer will evaluate competitors’ offerings. This makes it easier to check back that the sources of advantage will deliver what customers value in terms of price and value.
Comparison of competitive advantage
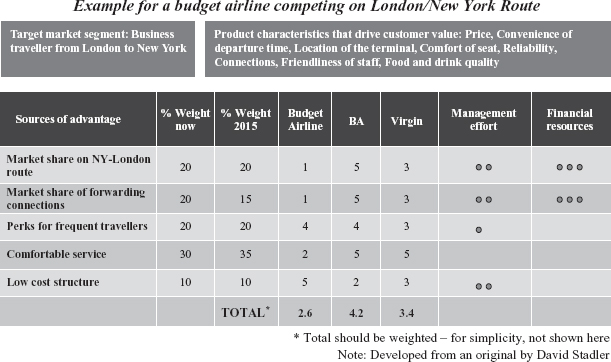
The main table defines the primary sources of advantage, which are a mix of positions (e.g. market share), customer value (perks for frequent travellers) and capabilities (motivated staff, lean overhead structure). Deciding which are the key sources of advantage involves first going through the analyses described earlier and then making a judgment call about which are most important.
This should prompt questions about how the sources of advantage might change (in this case, the business is seen as stable), how different competitors rank today (the budget airline is disadvantaged on several important dimensions), and the implications for the airline's management team and investment programme. The table format provides a great one-pager for discussion and links analysis to action. Variants on this simple approach are easy to generate.
(A cautionary note: If some competitors have a very different business model, this approach may underestimate their strength because it rates all competitors on the same sources of advantage. For example, if we were to use the same table to evaluate competition on the London/Paris route, it could be difficult to define the sources of advantage for Eurostar or self-drive using a ferry, both of which are significant competitors.)
THE VALUE CHAIN
The competitive advantage matrix is only one of many approaches to exploring how value and advantage are created. As this is such a crucial issue for strategists, it is worth having a few other approaches in your toolkit.
One that has already been described is to draw up the cost and revenue structures of different competitors, such as for the budget airlines mentioned above. This can yield a similar discussion and insights to that generated by the competitive advantage matrix, although with less focus on what the management actions should be.
A similar approach is to use the value chain – one of the most popular tools in use today, first popularised by Michael Porter. The value chain is the sequence of activities that an organisation executes, e.g. R&D, product design, production, marketing & sales, distribution and customer service (the actual sequence will vary according to the industry). Value chain analysis starts by describing the value chain for a particular organisation and uses this as the basis for a series of further analyses. One such analysis is to ask which parts of the value chain create value for customers. For example, a lot of value is created by Apple in product design, whereas Cristal Champagne, which retails at £150 per bottle, creates value through its marketing.
Another analysis is to determine which parts of the value chain are sources of advantage or disadvantage for a particular organisation. Apple has significant competitive advantage in purchasing (due to its scale), product design (due to its scale and experienced staff) and brand image, for example. However, it has no advantage in after-sales service; indeed it may even have higher costs than some competitors.
DEFINING THE MISSION AND OBJECTIVES
Another important aspect of the internal situation is the current objective, as future strategy options should be consistent with that objective. It is important to distinguish between an organisation's strategic objective and its mission – both of which are important to understand. The strategic objective, e.g. ‘enter a new market’, ‘defend market share’, or ‘increase profit by 25%’, is typically subsidiary to the overall mission of the organisation, e.g. ‘to refresh the world’ (from Coca Cola's mission statement).
The mission can be tricky to identify. What is written in the formal mission statement – if indeed one exists – is often not what is perceived by, and motivates, the individuals in the organisation. It can therefore be useful to have some tools for understanding the overall mission of an organisation. Two such tools are the Ashridge Mission Diamond and Stakeholder Analysis.
In their book, A Sense of Mission, Andrew Campbell and Sally Yeung posit that an organisation's mission is captured not by what is written in the mission statement, but by what is really believed and acted upon. This ‘sense of mission’ can be captured by examining four components – purpose, strategy, values, and standards and behaviours (see figure below).
As an example, consider the YHA (Youth Hostel Association), a charity which owns and operates a chain of hostels around the UK. The historic purpose of the YHA was to ‘Help all, especially young people of limited means, to a greater knowledge, love and care of the countryside.’ The strategy to achieve this was to build a network of volunteer-run rural hostels, which made them cheap and provided access to the countryside for young people. The values were to be open to all, particularly to young people. The behaviours were those of a volunteer-run organisation – those in charge hostels were given significant autonomy to run the hostels as they saw fit, while guests were required to do chores to keep costs to a minimum.
The Ashridge Mission Diamond
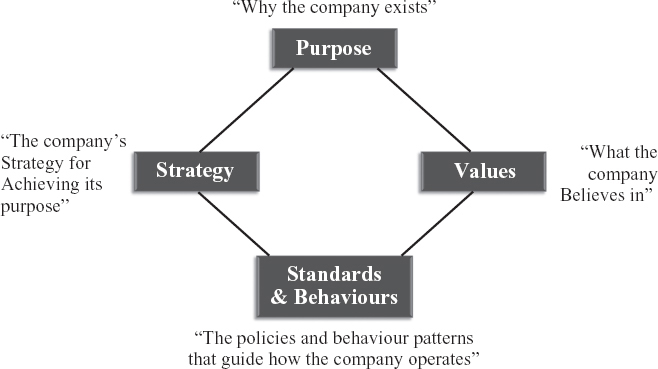
Note that the strategic objective is only one of the four elements of the mission – illustrating its critical but subsidiary role.
The Ashridge Diamond is a useful tool for describing the overall mission of the organisation and the strategic objective. It also provides an initial evaluation of the overall sense of mission and any conflicts there may be with the current strategy. To be powerful, there has to be a good fit between the various corners of the Diamond.
In the case of the historic YHA there was a good fit. However, in recent years, the strategy has been changed to reflect the changing needs of the tourist market. Small, primarily rural hostels have been sold off and the cash invested in building hostels in more popular, urban locations. Visitors are no longer required to do chores and there has been an attempt to professionalise the management of hostels. As a result there has been some conflict between the strategy and other points of the Diamond. The management of the YHA has restated the purpose: ‘To help all, especially young people of limited means, to a greater knowledge, love and care of the countryside, and appreciation of the cultural values of towns and cities.’ Nevertheless, the changes have been controversial within the organisation.
STAKEHOLDER ANALYSIS
In addition to an organisation's mission, it can be useful to understand the broader context within which the mission is set, particularly if there are many influential stakeholders. Stakeholders rarely define the mission – that is something that is typically done within the organisation – but they do put constraints on what that mission can be.
Imagine, for example, that you are part of a local council that has to establish a mission that reconciles pressures from the voting public, local businesses and organisations, customers of council services, employees, suppliers, central and regional government organisations, national politicians, special interest groups, and local political party organisations. To conduct a stakeholder analysis, evaluate each one's motivations, interests, requirements and the extent of their power and influence. From this, draw conclusions about the constraints within which the mission of the organisation is pursued. The results may be messy, but that is the point. Conflicting pressures need to be mapped out and understood as part of the assessment of the current situation.
SUMMARISING THE OVERALL SITUATION
The external and internal assessments described in these last two chapters should provide a great deal of information. How can you bring all the thinking together into a concise statement about the situation?
The most common tool used is a SWOT analysis. The idea is to document the strengths, weaknesses, opportunities and threats, and then come up with a strategy that seizes the opportunities and counteracts the threats by addressing weaknesses and building on strengths. There are two problems with SWOT analysis. The first is that a strength can also be a weakness, and an opportunity can be a threat. For example, the low inventories required by Japanese companies are typically seen as a strength because they lower costs and increase flexibility. However in China they were a weakness because of the unreliable nature of suppliers, and thus the higher risk of a disruption in deliveries. Similarly, global warming may represent an opportunity for wind turbine manufacturers in the West, but a threat for farmers in the low-lying deltas of Bangladesh. SWOT analysis can fool organisations into serious misjudgements about their position. A second problem is that SWOT does not include any reference to the goals of the organisation.
A superior variant of SWOT – although less well known – is the Strategy Triangle, shown in the following diagram. To use it, first list an organisation's objectives, internal capabilities (broadly defined to include positions) and external opportunities at the three points of the triangle. At this stage there need be no judgement about whether the capabilities are a strength or a weakness, or whether the opportunities are attractive or threatening.
Next, ask whether there is a good fit between these three. For example, do the capabilities provide the necessary strengths required to address each of the opportunities? Do the opportunities offer the potential for the objectives to be achieved?
Consider, as an example, a small high-tech business with a new type of voice-recognition software, spun off from a university and run by three academics who have set themselves the strategic objective of developing a sustainable and profitable business. There are plenty of opportunities to do so because the market for their product exists. They also have the technical capabilities – being world leaders in the relevant software. However, they lack sales and marketing skills and financial capital. The Strategy Triangle provides a simple framework to summarise their situation.
The Strategy Triangle
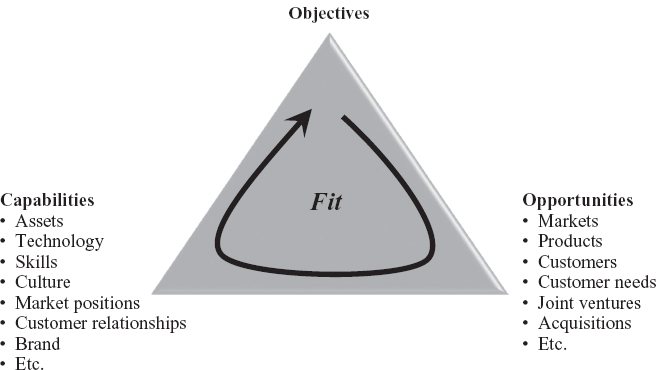
While the Strategy Triangle is helpful for a high-level discussion, it has a potential weakness: it can easily allow sloppy thinking to go unchallenged. Hence it is best used as a brainstorming tool, or with a team who are truly expert, or as a way of summarising the situation after a decent amount of analysis has been conducted.
To encourage more rigorous thinking, a popular alternative is the Strategy Matrix (also known as the McKinsey or GE matrix) – as shown in the following for British Airways.
In this example, BA is competing in four segments – each shown as a circle. The average segment profitability for all competitors is shown by its positioning on the vertical axis. Segment size is indicated by the size of the circle (which can also be coloured to show the market growth of the segment). Competitive advantage is shown by the position along the horizontal axis.
The figure suggests that BA has a relatively attractive position regarding its flights to North America and other intercontinental destinations (its main focus for growth).
The strategy matrix for BA
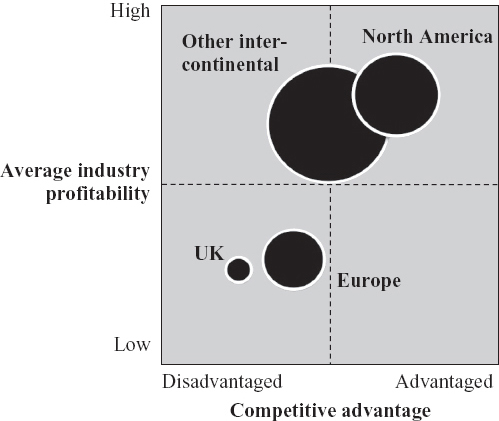
It has weaknesses in the highly competitive UK and European markets (where it has been retrenching and cutting costs). All aspects of this assessment can be supported by more detailed analysis and facts using the tools and frameworks described earlier.
This matrix is a development of the famous Boston Consulting Group matrix, which had growth rate in place of average industry profitability, and market share in place of competitive advantage. The BCG matrix was a revolutionary strategy tool in its time and is appealing because the dimensions can be quantified (although there is always an argument about the definition of the relevant market to use to come up with market share) However, one of its underlying assumptions – that market share is a guarantee of competitive advantage – is regarded as too simplistic in today's business environment.
The strategy matrix provides a high-level summary of many of the issues addressed in the external and internal assessment of the situation. Notable exceptions are the objectives of the organisation (the Strategy Triangle is better for that) and what is going on in the broader environment (although this is reflected indirectly in the assessment of segment profitability, size and growth).
A REALITY CHECK: WHAT IS ACTUAL PERFORMANCE?
One of the challenges of strategic analysis is that it often requires making judgments that cannot be proven, at least not without an unreasonable amount of data and analysis. Therefore check whether your assessment makes sense by asking whether it is consistent with actual performance. For example, if you conclude from the analysis that you are a very strong competitor in a very attractive market, you would expect to be performing well.
Note that performance, like strategy, should be analysed at the segment level. Overall measures of performance are better than nothing, but not by much. Also, a range of metrics should be used. The right mix will vary, but is typically a combination of financial, strategic, and operational.
WHO SAID IT...
“However beautiful the strategy, you should occasionally look at the results.”
– Winston Churchill
Financial metrics are the most common. The most relevant are the profitability ratios rather than liquidity or financial leverage ratios (which have more to do with financial than business strategy).
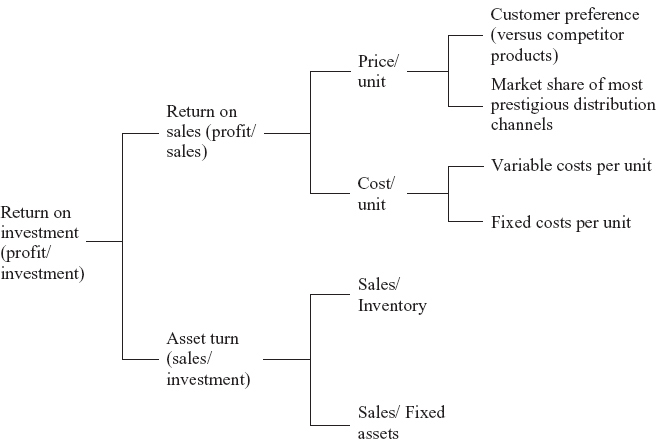
It can be useful to create a Value Tree that breaks out financial performance at progressively finer levels of detail. The exact tree will vary by industry (and the availability of data). An example, for a consumer product, is shown in the following diagram.
Ideally, the metrics should be chosen so that they can be measured and benchmarked against the competition in order to throw maximum light on whether or not the organisation is performing well.
Example of a Simple Value Tree
Strategic metrics include:
- Market and segment attractiveness (market size, growth rates, average levels of profitability).
- Competitive success (e.g. market share and trends in market share, brand image and reputation, mystery shopper rating, relative price point, share of sales from recent products).
- Performance from the perspective of stakeholders other than shareholders (e.g. number of safety incidents, public opinion about the organisation, results of employee surveys).
- Forward-looking indicators (e.g. products in the pipeline, size and quality of the talent pool).
Operational metrics are typically highly customised, so the examples that follow are illustrative only:
- Capacity utilisation, strength of the wholesale network and advertising spend for the beer industry.
- Costs per sales call, customer churn rate, value per sale, and conversion rates for sales-oriented businesses.
- Operating cost per MWhour of production, availability during peak hours and efficiency of conversion of fuel to energy for a power plant.
A challenge involved in measuring performance is that sometimes the strategy delivers results which are far out in the future. For example, a nuclear power plant will take 10 years to build and bring on line, so it is necessary to be thoughtful about what metrics will provide a reasonable measure of the value generated today. Indeed power generation companies often use net present value (the value of future cash flows) to assess whether their current strategies and investments are likely to create value over their lifetime.
What happens if performance is different from what was anticipated from the strategic assessment – for example, if a business that you think has a strong competitive position is losing money? It is possible your strategic assessment is wrong. It is also possible that something is causing the organisation to perform above or below the level that its strategic position merits. For example, strongly positioned businesses may be failing to deliver good financial performance because someone other than the shareholder is getting the value (e.g. employees, unions, pensioners, customers). Alternatively, operations may be very inefficient (as with the US automotive companies in the 1980s). In such cases, the priority should be to fix the operational problems before moving on to develop a new strategy.
WHAT YOU NEED TO READ

- W. Chan Kim and Renee Mauborgne's Blue Ocean Strategy, Harvard Business School Press, 2005, is a popular strategy text which particularly emphasises the importance of creating value for customers.
- For a discussion of sources of competitive advantage, see various chapters in Robert Grant, Contemporary Strategy Analysis and Lords of Strategy by Walter Kiechel III, Harvard Business Press, 2010.
- A useful way to understand how different sources of advantage link together and deliver higher performance is to use ‘systems thinking’. Books on this include The Fifth Discipline by Peter Senge, Random House, 1993 and Strategic Management Dynamics, John Wiley & Sons Ltd and Strategy Dynamics Essentials (eBook from www.strategydynamics.com) – both by Kim Warren.
- For more reading on mission and objectives, consult A Sense of Mission by Andrew Campbell and Sally Yeung, Economist Books/ Hutchinson, 1990, or Creatinga Sense of Mission, Long Range Planning, Vol 24, No 4, August 1991.
- For general information on financial ratios, see Contemporary Strategy Analysis by Grant, Chapter 2 ‘Putting Performance Analysis Into Practice’. Richard Koch's Guide to Strategy also provides some interesting examples.
IF YOU ONLY REMEMBER ONE THING
Successful strategies are founded on a rich understanding of your own situation.