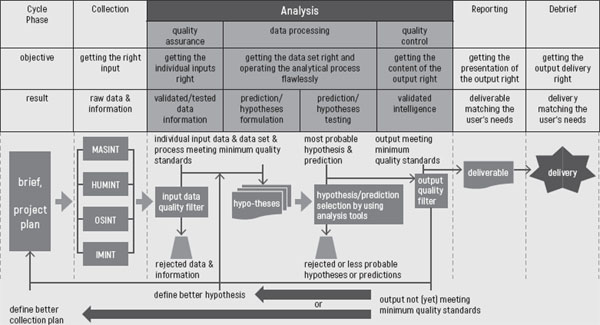
DIAGRAM 10.1 STEPS FROM RAW DATA TO DEBRIEFING IN THE ANALYSIS CYCLE
|
INTRODUCTION |
This chapter will focus on the quality assurance of individual input data, both in terms of data correctness and completeness. In diagram 10.1 , the material we’ll be focusing on in this chapter falls under input data quality filter . This chapter is symbolized by the input data quality filter.We will be examining the critical importance of high data quality prior to starting the actual data processing.
|
INDIVIDUAL DATA |
The two most relevant dimensions in individual data quality assurance testing are:
• Data correctness.
• Data completeness.
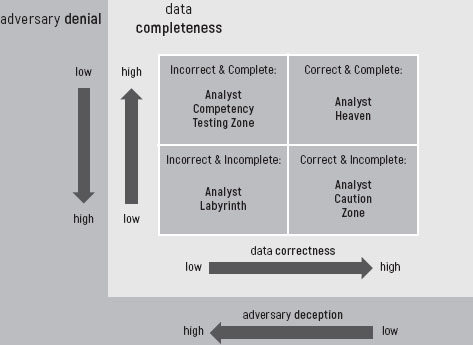
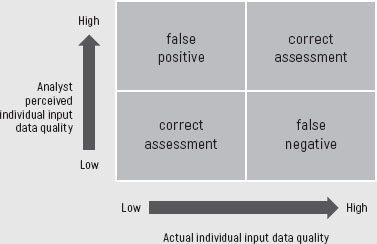
Diagram 10.2 gives a simple two-by-two matrix, featuring both dimensions. Data correctness is featured from low to high on the horizontal axis. Data completeness ranges from low to high on the vertical axis. Data correctness and data completeness as dimensions show the actual situation. The actual situation in the case of data correctness may be the result of intentional competitor deception or simply of poor analysis or sloppiness during collection work. The same holds true for the data completeness axis. Data may be incomplete due to a competitor intentionally limiting the release of data on its capabilities or intent, or again due to poor collection efforts. In other words, the cause of poor or strong data completeness or data correctness may be internal or external.
DATA COMPLETENESS ISSUES DUE TO INTENTIONAL DENIAL
In strategic analysis work, for a competitor aiming to limit the data completeness of your strategic analysis the term intentional denial is used. The competitor that prevents its rivals from acquiring useful data on its competences and intent can enhance the impact of its competitive strategies. Those strategies are more likely to be executed as unwelcome surprises. Surprise moves (such as unanticipated new product launches) will likely be turned by such a company into a competitive advantage. The objective of denial is to blind competitors’ analysts and, through them, their decision-makers. A blinded analyst will be cautious; he doesn’t want to stumble into inconvenient, unseen truths. Subject to his budget constraints, such an analyst will likely intensify his collection efforts in response. In any case, the analyst’s conclusions will be cautious. The analyst will (or should) be somewhat anxious about having to build a point of view based on too few data points.
DATA CORRECTNESS ISSUES DUE TO INTENTIONAL DECEPTION
A company (read: competitor) that intentionally plays with your perception of data manipulates data correctness. In doing so it applies deception. Such companies aim to deceive their competitors by selective and/or misleading information. Legal limits prevent companies from using the deception tricks that the military can apply in wartime. Deception in business is not so common. At times, selectively chosen data – that as such is truthful is intentionally-passed on to you as an analyst to misdirect your company’s attention. The objective of doing so of course is to gain or strengthen the sender’s competitive advantage. 1
A competitor that operates a deception campaign delivers the ultimate strategic analyst’s test. Seeing through a well-planned and skillfully executed deception is among the most challenging tasks a strategic analyst can face. Several military deceptions over the course of the Twentieth Century have been analysed in detail (Bruce, 2008d). The analysis reveals that 90% of all military deceptions achieved their objective of misleading the adversary into believing a truth different from the actual reality. In some cases this led to serious issues which literally altered the flow of the Second World War. 2 Section 10.3 covers deception in greater detail.
The dark grey zone in diagram 10.2 reflects the degree of deception and denial that the competitor intends. Any analyst will see the amount of data available. At first sight, the position on the vertical axis looks clear. Depending on the skills of the analyst and/or the quality of the analyst’s sources, a deception either works, or it is partially or completely detected. This determines the position on the horizontal axis.
At the beginning of this section, I already pointed out that diagram 10.2 gives a rather simple view of reality. The complicating matter is that the dark grey zone in diagram 10.2 refers to the degree with which the competitor intentionally deceives the analyst. But what if the competitor has no such intention, and the analyst unfortunately deceives himself?
DATA CORRECTNESS AND COMPLETENESS ISSUES DUE TO SELF-DECEPTION AND SELF-DENIAL
Self-deception may happen as a result of an analyst applying the wrong (his own, or ethnocentric) logic to a competitor’s action. Given certain correct and complete facts on the table, the analyst may, for example, incorrectly predict what we (the company that employs the analyst) in this situation would do next, rather than understanding what in this situation they (the competitor) would do next.
Whether a deception was the competitor’s intention or whether it was self-inflicted is not shown in diagram 10.2 because it is irrelevant to the outcome. In both cases, a strategic analysis deliverable based on self-inflicted or intentional deception obviously won’t contribute to the quality of the analyst’s company’s decision-making. The worst reflex any analyst (admittedly, including myself) can have is that ‘self-deception may happen to others, but it cannot or will not happen to me’.
In his biography of master-deceiver Kim Philby, Ben Macintyre shows that Philby’s success in deceiving his English MI6 intelligence friends into believing that he was one of them (even when spying for the Russians) was mostly due to self-deception among the MI6 establishment (Macintyre, 2014). The old boys at MI6 were all genuine masters in the craft of intelligence. They certainly did not lack the skills necessary to smell a rat if there was one. But they couldn’t believe Philby was a traitor because they didn’t want to believe it. If they couldn’t, can we (that is you and I) be open-minded enough not to believe what we so dearly want to believe? In strategic analysis, we’d better not.
What is true for the dimension of deception is also true for the dimension of denial. A competitor may not take extreme care to protect his data (that is, it isn’t purposely denying data to the analyst), but the analyst may out of negligence or lack of experience – or for whatever other reason – simply fail to collect the data that are in fact out there.
Succinctly put: the analyst’s own perception on data completeness matters significantly. When experience tells them that they are missing much-needed data, their perception of data completeness is low. This will most likely make them cautious in their analysis. They will probably express a lower confidence level in describing ‘what it all means’ in their deliverable. When an analyst, however, does not know they are missing critical data, they will not look for it either. They will express high confidence in their assessment, unintentionally misleading themselves and the intended recipients of their deliverable.
In the sections below, both the data correctness and the data completeness dimensions will be covered in more detail. Sections 10.3 to 10.5 describe the data correctness dimension: the methods to assess the quality, expressed as degree of reliability of available individual data prior to accepting them as input for strategic analysis.
|
INDIVIDUAL DATA |
In this section, I will discuss how to execute data quality assessments for individual data points. To return to the glass production metaphor, the quality/purity of the individual raw materials (soda ash, lime, sand) needs to be assured prior to accepting them as input raw materials in the glass oven.
Different reasons may exist why individual data points that arrive at an analyst’s desk may not be fully correct (may not give a truthful picture of reality). Speaking from experience, I confess that working in strategic analysis for a long time may result in developing mild symptoms of paranoia when it comes to data quality. In strategic analysis, this is not a bad thing, provided the paranoia doesn’t spill over to non-business parts of your life. In strategic analysis for business I believe Aeschylus’s 2,500-year-old axiom applies just as well as it does in conflict:
“In war, truth is the first casualty.”
SCEPTICISM AS A DESIRABLE ANALYST ATTITUDE
It is the analyst’s responsibility to search for the full truth and not for (un-) intentionally distorted truths or half-truths. An analyst has useful weapons at her disposal for protecting the integrity of assessments (Davis 1997). It all starts with testing the quality of individual input data, followed by challenging pre-existing beliefs the analyst may have:
• Scepticism about the reliability of all information, whether from human or technical collection.
• Readiness to challenge and test even well-established assumptions about trends, patterns and cause-effect relationships.
Infusing a healthy dose of skepticism into working processes requires the analyst to assess the data itself and how the data points are received, by both the communication channel and the source.
A SCEPTICAL LOOK AT COMMUNICATION CHANNELS
In communication, there is a sender, a channel and a receiver. Inevitably, there is noise as well. In the example below, the sender is assumed to be the competitor. For purposes of discussion, he may just as well be a customer or a supplier. The channel consists of one or more chain links between the sender and the analyst. The analyst is the receiver. You should note that the sender is not necessarily, by definition, the source. The source is here defined as the last link in the chain between the sender and the receiver. Diagram 10.3 gives a schematic representation of sender, channel and receiver in individual data point communication.
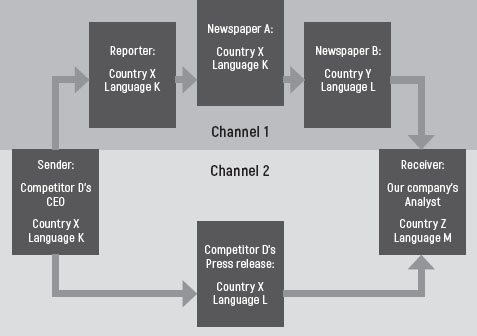
DIAGRAM 10.3 SENDER, CHANNEL AND RECEIVER IN INDIVIDUAL DATA POINT COMMUNICATION
Diagram 10.3 shows two straightforward channels of communication of an individual data point. Channel 1, in the dark grey area, depicts an indirect channel. It is indirect because it covers more than one link in the chain.
In this example, the chain in Channel 1 starts on the day of the release of competitor D’s first-quarter financial results. That day, the CEO of competitor D gives an interview to a journalist. The data point may be the expected profit expressed as earnings before his company’s interest, tax, amortization and depreciation (EBITDA) in the upcoming full financial year. The CEO and the journalist both speak language K. The journalist truthfully notes the expected full-year EBITDA figure the CEO has given him.
The journalist, however, has to work with an editor at his newspaper. The editor has only allocated the journalist a limited number of words for the coverage of this interview. For this reason, the journalist reports the EBITDA figure in his article as gross profit. A second journalist working in another country for newspaper B (which is published in another language than newspaper A) picks up the news item from newspaper A. He decides to briefly cover the news in his paper, correctly referring to newspaper A as his source. For the sake of convenience and brevity he refers to the gross profit reported into profit . By this point, the unintentionally distorted data point in newspaper B reaches the analyst. All other news elements were transferred correctly, but the reasonably well-defined EBITDA figure has been mis-reported as profit. This renders the data point less useless (to say the least) to the analyst.
Fortunately, a second direct channel (Channel 2) existed as well. This channel is considered direct because the analyst uses a source that links directly to the ultimate sender, without intermediate links in the chain. This was the channel through which the press release of competitor D’s quarterly results flowed. This document properly offered both the EBITDA actuals for the first quarter as well as the forecasted figure for the full year.
In the above example, complete and correct data were released by the sender. The data were subsequently unintentionally distorted in communication Channel 1 prior to reaching the receiving analyst. In doing so, the data moved to the left along the horizontal axis of diagram 10.2 , losing part of their correctness… and thus their usefulness.
MAKING SCEPTICISM ACTIONABLE THROUGH ASKING QUESTIONS
Using diagram 10.3 and taking the communication flow as a starting point, the following analysis questions emerge as a first quality assurance check on individual input data points:
• What is the nature of the individual data point?
• Who is the source?
• Through what channel did the data come in?
• Who is the sender?
Each of these four questions, plus the question ‘What is my situation?’ are elaborated upon below. At the individual analyst level, they illustrate four principles that can prove helpful in protecting yourself against deception. Applying these principles should reduce the chances of falsely accepting flawed individual data points as correct or rejecting correct individual data points as flawed. The principles are (Bruce, 2008e):
• Know your competitor (the ultimate sender).
• Know your channel.
• Know your situation.
• Know yourself.
The importance of knowing the competitor (or customer or supplier) and knowing the channel have already been covered in diagram 10.3 as your starting point. Knowing the situation is the final external factor – along with the nature of the data point, the source, the channel and the sender – that the analyst has to include in the assessment. These five external factors in the individual input data quality assessment are covered in this section.
The final principle concerns the analyst, whose mind, whether they like it or not, may be a source of deception. This is an internal factor that may affect the individual input data quality assessment. Section 10.4 will cover the individual analyst’s potential psychological reasons for introducing bias in the assessment of individual input data.
WHAT IS THE NATURE OF THE INDIVIDUAL DATA POINT?
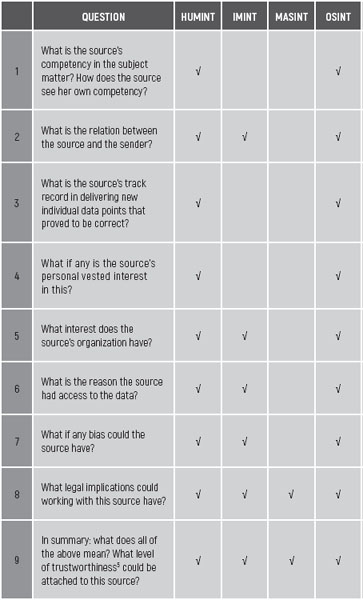
In table 10.1 , a checklist of questions is provided to assess the nature and thus correctness of an individual data point. A tick in the box specifies for which collection method the question is most relevant (using, again, the military intelligence abbreviations for human source, imagery, measurement and signature and open sources).
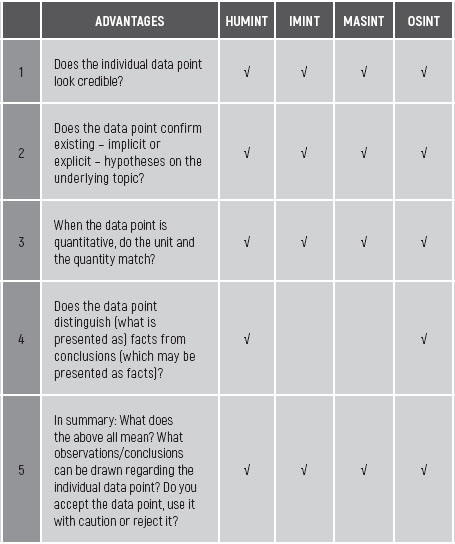
TABLE 10.1 QUESTION CHECKLIST ON THE NATURE OF INDIVIDUAL DATA POINTS
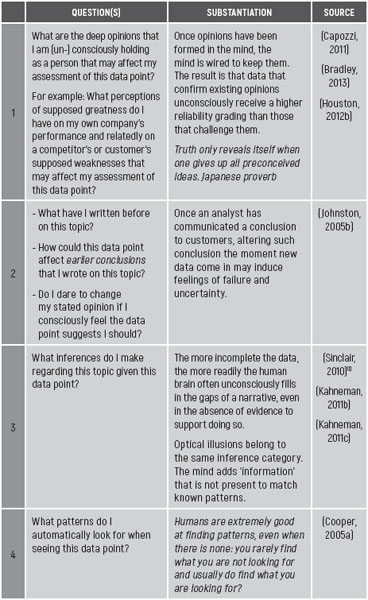
HUMANS LOOK FOR CONFIRMATION, NOT FOR TRUTH
Questions 1, 2 and 3 force the analyst to check the new individual input data point with earlier data points of a similar nature. This may be called a confirmatory check. No matter how objective and principled the analyst is, or at least aims to be, when judging data they will inevitably use their personal frame of reference. Any data received will be compared, with data previously received and/or analysed. So, when a newly received individual data point confirms the analyst’s expectations for this type or class of data, the data point may be considered correct. It does not raise suspicions. Research found that as much as 90% of all data that is searched for has been collected to confirm pre-existing views (Makridakis, 1990).
The confirmatory check can, at times, be a good trait. There is a good reason why, in physics and engineering classes, students are taught to estimate the outcome of a calculation, prior to executing the calculation. This is done only to make an informed guess on the approximate size of the result. When, for example, calculating that the height of a new stack at a large oil refinery needs to be 1,500 metres tall, the student should know immediately that the answer is incorrect. Implicitly, a student with only a bit of common sense knows that a stack at a large oil refinery measures some 150 (+/- 75) meters. The absurd initial height figure strongly suggests something was wrong with either the calculation method or with the inputs used. The same would be true when as result a stack height of 1.5 meters would have been calculated.
The significant benefit of a confirmatory check is that obvious (although perhaps unintentional) distortions in data are filtered out. In the example in the previous section, the analyst would likely have assumed the expected ‘profit’ figure that reached him through Channel 1 to be an EBITDA figure. Compared to last year’s EBITDA figure for company D, the figure cited in the news articles would mean an increase of 6%. That would in fact relate to the historic performance growth of company D over time. Even when the exact figure would not have reached the analyst through Channel 2, at least through Channel 1 the analyst had a data point with a perceived sufficiently high correctness for the expected EBITDA at company D.
Similarly, when we think about the MI5 analysts in the example in section 9.2 , they may have done a confirmatory check on Ivor Montagu by reviewing the membership list of the Communist Party of Great Britain.
Finding Montagu on the list may have added to the credibility or even probability of the fifth columnist data point being correct. It should be emphasized, however, that both data points as such are strictly disconnected.
The membership data point adds nothing to the correctness of the communist party affiliation data point.
This example shows that what was intentionally and deceptively called a confirmatory check for the first three questions in table 10.1 in fact was only a rejection check. New individual input data points are perceived to be correct when the new points confirm the analyst’s existing beliefs or expectations.
CONFIRMATORY CHECKS MAKE ANALYSTS VULNERABLE TO (INTENTIONAL) DECEPTION
This is a good place to share a quote that I really like, which applies to both intentional and inadvertently self-inflicted deception (Johnson, 2009b):
“The basic principle underlying deception is to tell your target what he wants to believe.”
Jan Hatzius, chief economist at investment bank Goldman Sachs, similarly frames the human tendency to confirmatory checking as follows (Silver, 2013a):
“I do think that people have the tendency, which needs to be actively fought, to see the information flow the way they want to see it.”
The implication of this is that when people, including analysts and corporate decision-makers, hear what they want to hear they lower their guard relative to the actual data correctness. The risk of the ‘rejection check’ is that new individual data points that reach an analyst and that are not rejected as unlikely, but rather accepted as credible, are therefore not automatically correct.
To make intentional deceptions succeed, a sender needs to include just enough truth and credibility in the information that is provided to the receiving analyst to catch the analyst off-guard. The bamboozled analyst will not realize that although all the individual data points received are true, together they do not make up the full truth. Doing so exploits in the analyst the all-too-human inclination to – mix up credibility with correctness or completeness. By stressing some truths – and in doing so, muting and thus denying the analyst other important truths, the intentional deception is legal.
An analyst always aims to avoid being deceived. When an analyst has direct interaction with the human source providing the individual input data points, the analyst may, where needed, assess the truthfulness of the source on the spot. There are methods for the analyst to assess whether human sources may be intentionally, or unintentionally, deceiving (Houston, 2012a). The method is more sophisticated than what is suggested by the indicators below. The indicators were selected for their applicability in a strategic analysis context. They may serve as warning signals of deception by a human source, especially when the source answers questions in a less-than-straightforward way. This is not to say that a single indicator signaling an alarm justifies rejection of all that the source says as inaccurate. To justify concerns over data accuracy, multiple indicators should be taken into consideration simultaneously. Table 10.2 focuses on hearing the source, and table 10.3 on seeing the source.
TABLE 10.2 INDICATORS JUSTIFYING ALERTNESS REGARDING HUMAN-SOURCE INPUT DATA ACCURACY
TABLE 10.3 ADDITIONAL INDICATORS JUSTIFYING ALERTNESS REGARDING HUMAN-SOURCE INPUT DATA ACCURACY
Deception becomes illegal when intentionally false statements are published or uttered to misdirect the analyst’s and his company’s attention for a competitive advantage. Illegal acts in this field may fall under the jurisdiction of competition law. The latter are known in many countries for the high fines that can be imposed upon offenders, up to a maximum of 10% of the global net sales of the ultimate mother company. Sentences can include jail terms for individual corporate executives.
A strategic analysis function should at all times steer clear of breaching competition law. Intentional deception is thus at all times off-limits, and it pays to be alert to the possibility of such tactics being used against you as analyst. The intermezzo at the end of this section discusses the phenomenon of intentional deception in business, and thus in strategic analysis in further detail.
DISTINGUISHING BETWEEN FACT AND ANALYSIS AS INCOMING DATA POINTS
Question 4 in table 10.1 centres on the question of whether the new individual input data point presented to the analyst is a (raw) fact or the output of an analysis based on underlying but non-disclosed data points. In that case the new data point is itself the output of a previous analysis, which may be or is being presented as a fact.
There is an important difference between the two. In his biography of former US Federal Reserve President Alan Greenspan, Bob Woodward stresses Greenspan’s obsession with raw data (Woodward, 2001). Greenspan did not want any pre-cooked analyses. He only wanted raw data, and insisted upon doing the modelling and the analysis himself. Doing so, he believed, ensured that no unintentional analytical flaws or biases crept into his view. Regardless of how history rates Greenspan’s presidency, this is in principle a good habit for an analyst. 3
However, there is a catch. For the quality of the ultimate strategic analysis deliverable to be top-notch, the fact remains that the analyst processing the raw data should be less biased than the sources who prepared the assessment of the raw data. This may depend on the degree of access the analyst has to contextual, often qualitative, information that accompanies the raw data point. The question of whether the analyst is better placed than the original source to make sense of what the raw data mean is applicable both in the case of Greenspan, where he could choose between raw data and some pre-cooked analysis, and that of MI5, which had no such choice. In chapter 11 , this topic will be covered in more detail.
Another potential issue is that the analytic conclusion is put forward by the strategic analysis department but the underlying raw data are lacking. This was the example of Aiken Sneath in section 9.2 . He presented no raw data but he did present a conclusion. The underlying evidence was not made available for analysis and possibly even unknown by the source (Macintyre, 2010b). In terms of dynamics, the phenomenon of lacking the raw data but reaching a conclusion is commensurate with having insufficient data to draw conclusions. In section 10.5 I will discuss what to do in such a case.
In conclusion, I would at all times recommend meticulously checking the nature of new individual input data points that are provided to analysts. It is a great way to prevent ‘garbage in, garbage out.’ Using the tables 10.1 to 10.3 may assist you in doing so. Executing these checks is the analyst’s responsibility. The analyst is the ultimate gatekeeper in this process step.
WHO IS THE SOURCE?
In section 9.3 on data and metadata we examined the relevance of the source of a data point (Johnson, 2009a):
“Who said it is often more important than what was being said.”
In this section I will elaborate a bit more on why and how sources matter to data points.
SOURCES MAY HAVE VESTED INTERESTS
The Iraq weapons of mass destruction dossier showed that an individual source (code name ‘Curveball,’ as referenced earlier) can have a vested interest that is so strong that it enables him to deceive even the US government. Making the latter hear what they wanted to hear, the US set significant actions in motion. In strategic analysis, the psychological dynamics of individuals or groups striving to further their goals – or in business all too often, aiming to achieve their personal bonus targets – are identical to those in politics. Sources generously provide data to make their case or shine a spotlight on themselves, whereas they deny access to data that presents the risks of executing their proposed plan or that illustrate their failures. For a strategic analysis department to deliver objective assessments, the relevance of assessing the source and his personal interests is thus at least as important as it is in military intelligence. Strategy development in business often relates to power. Data are a means to influence strategy. So, data may at times be selectively used as a means to acquire or expand power.
IDENTIFYING UNKNOWN SOURCES AND SENDERS
The material above implicitly presupposes that the data or information that reach the analyst’s desk indeed have both the source and the sender as metadata. This, unfortunately, is not always the case. In this section, the first point of attention is therefore to identify a source that is not available. Once the sender and the source have been determined, a checklist of questions is provided to assess the source and/or the sender.
In instances where the channel, the sender and/or source of data or information are unknown, strategies to identify (part of) the channel, the sender and/or the source tend to vary according to collection method. Table 10.4 provides common steps to uncover metadata for data that reaches the analyst’s desk without a proper sender/source signature. Table 10.4 also gives typical strategic analysis examples where metadata may be as relevant as the data itself.
|
METHOD |
STEPS TO TAKE TO IDENTIFY METADATA WITH A DATA POINT |
RELATED EXAMPLES |
|
IMINT |
- Involve a reliable, unbiased subject matter expert; run an internet search on images of the subject matter looking for commonalities/hints; identify parameters within the picture that narrow down the range of possible source/metadata options. 4 |
Picture of an unknown (competitor) product such as one acquired at a trade show. |
|
MASINT |
- Compare the outcome of the ‘unknown source’ sample against known samples, looking for fingerprints |
Unknown product sample from a trade show. |
|
HUMINT |
- Depending on the nature of the relation with the last source in the communication channel, identify human sources to obtain (more) metadata with your data, including original sender and channel - Proactively feed the new data or information to other (HUMINT) sources to elicit validation or at least reactions, or to get (more) metadata indirectly |
Validating data (rumours) on upcoming transactions alluded to by sources who are either secretive and/or may have a bias. |
|
OSINT |
- Check a website’s registration at www.whois.com - Verify the credibility of the web address (URL); does the presented organization match with the address (for example, Governor.BankofTogo@hotmail.com is suspect). - Check the professionalism and writing style of the site with that of the presented organization. - Involve a reliable, unbiased subject matter expert. |
Validating documents and websites that do not have a clear originator/owner or may have a different originator than it is purported to have. In other words, check for fakes/deceptions. |
TABLE 10.4 STEPS TO UNCOVER (DATA-RELATED) METADATA INCLUDING SOURCES AND/OR SENDERS BY COLLECTION METHOD AND RELATED EXAMPLES
HOW TO TREAT A SINGLE RUMOUR AS A SOURCE
It is undoubtedly tempting to base an analysis on a single HUMINT source who passed along a rumour, for which the communication channel from the sender is not clear. This approach is not without risk in OSINT. One newspaper or online article that conveys a rumour data point may easily be perpetuated by another newspaper or online article, even when the second newspaper comes in a different language. The fact is, both are based on a biased or downright wrong root source.
There is a cultural dimension to this. Wina Wiroreno points out that presumably reputable print media in Indonesia, as an example of an emerging economy, may actually be less reliable when it comes to data correctness versus rumors. ‘Print media,’ she once said smiling, ‘can be controlled (i.e. manipulated); rumors cannot,’ (Wiroreno, 2008). Strategic analysts (and journalists) in Western cultures are in general advised to refrain from acting upon single unverified sources until additional corroborating evidence is available from an independent second source. In emerging countries, a case-by-case assessment of a rumor is highly recommended.
ASSESSING THE SOURCE OF AN INDIVIDUAL DATA POINT
Assume for the remainder of this section that the data arriving at the analyst’s desk either have a known source/channel/sender, or at least that some metadata have been obtained using the above approach and/or tools. This still necessitates considering the source’s or sender’s objectives for releasing the data. Table 10.5 provides questions (list not exhaustive) that are useful as a checklist to assess sources and their motives, prior to acting upon the data they provide. The table is based on work by Noble (Noble, 2004).
Question 1 is among the most relevant considerations in table 10.5 . When a source has no competency in the subject matter, chances are that data will unintentionally get distorted, as a result of the source’s ignorance. This is a sad truth but it is an inescapable fact of life for an analyst: treat the data with caution; the source/collector may have missed a point or two.
Counter-intuitively, the opposite case carries just as much distortion risk. When the collector/source is an expert in the subject matter, undesirable expert bias may creep in. What is presented as data may be bias. Thus, the analyst may find it challenging to discriminate facts from opinions or pre-cooked collector/source analysis. Even worse, the analyst may be accused of being dumb and/or stubborn (usually both) when not accepting the expert-provided data as 100% reliable and the best thing since sliced bread.
The analyst is advised to keep calm and professional, treating the expert with the utmost respect. In doing so, the expert may get well-deserved recognition. Once this positive attention has registered in the expert’s mind, she may become increasingly open to accepting the analyst as an expert. Expert meets expert, with each possessing different expertise: analysis versus the subject matter at hand. Experts in the discipline of strategic analysis cannot do without rigorous data validation, no matter how high-grade the new individual data point inputs are. Thanks for understanding, dear fellow expert. In chapter 12 , expert-related biases in strategic analysis will be covered in more detail.
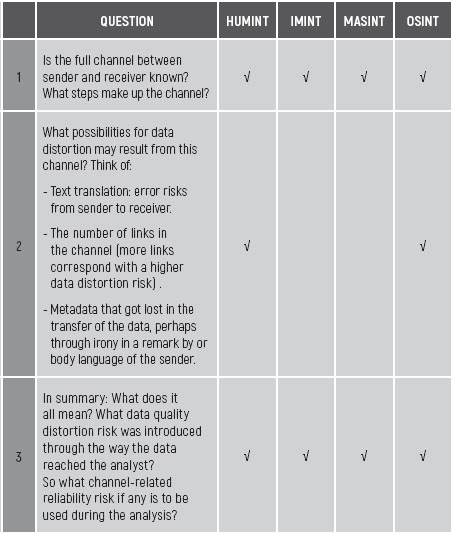
WHAT IS THE CHANNEL?
Diagram 10.3 depicts two channels through which data may travel from sender to receiver. For purposes of this book, the last chain link before the receiver is called the source. Validating the risk of data distortion as a consequence of the channel through which data travelled is a relevant feature of input data quality assurance. Table 10.6 provides a question-based checklist for assessing the risk that individual input data may be distorted specifically due to the data travelling through a specific channel between sender and receiver. Potential input data quality distortions that are attributable to the sender or the source, for example are not covered below but are examined in the respective related sections.
Specifically, for OSINT, it is possibile to trace the route between an individual computer and a website (in a Microsoft environment, at least). This sort of route-tracing may reveal relevant metadata for a sender/source that may assist in assessing individual input data or information quality. Similarly, dedicated web-based software tools are available that facilitate the evaluation of websites, for things like hoax detection. It is outside the scope of this book to discuss route-tracing and hoax detection sites in more detail, as these things are seldom relevant in strategic analysis for business, in contrast to law enforcement or business fraud detection.
Sender and source are not necessarily the same link in the chain from sender to receiver i.e., the analyst. A sender may be a company that is publishing its an annual report. An annual report may generally be viewed as representing the balanced opinion of the management of the company it describes. A sender, however, may also be a representative of the company whose role is to spin a business story in a certain direction. When an individual (who is not the CEO) speaks for an organization, a balanced opinion is no longer guaranteed. When reading an interview with an executive, he will likely highlight his own successes and will be deny or downplay information on parts of the business under his responsibility that have performed poorly.
In companies – in some more than in others – strategy formulation tends to have a political dimension. In a politicized atmosphere, externally accessible media may also be used as a channel to further personal interests. Assuming that the company’s legal and/or communications department have vetted the interview, then all data in it should be true. So, the legitimate question should be whether the data make up the full truth.
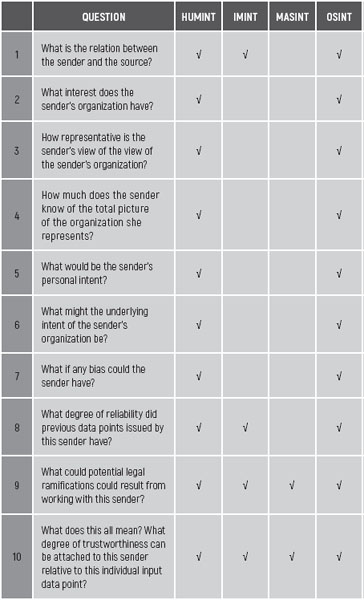
It is also possible that an individual may not even have a representative picture of his current organization. Such an individual might be a representative of a company that is talking to its competitors. In such a case, he will not be able to share representative data, even when he would want to (Friedman, 2010a). The implicit message here is again one of caution. Cherish the virtue of doubt. As an analyst, keep your sceptical attitude towards sources – especially senders, with their vested their interests – prior to accepting their data as the truth, the full truth and nothing but the truth. Table 10.7 provides a checklist of questions to consider when assessing individual input data points in relation to their sender.
Let me suggest a word of caution regarding question 6 in Table 10.7 . When assessing the intent of the sender’s organization the analyst inevitably introduces the risk of ethnocentric bias, as we’ve discussed in previous chapters. Chapter 12 delves into ethnocentric bias in more detail and examines how to avoid delivering flawed analyses because of it. Here’s a sound piece of expert advice (Bruce, 2008e):
“Being able to put yourself in the mind of the adversary (i.e., the competitor and sender) is the counterdeception analyst’s most effective weapon.”
WHAT IS MY SITUATION AS AN ANALYST?
Before touching on internal factors that may prompt the analyst to incorrectly assess individual input data, a final external factor is worth mentioning (Bruce, 2008e). External situational factors may affect an analyst’s judgment when it comes to assessing individual input data quality. These considerations have been translated into questions in table 10.8 . As the questions are truly situational, they apply to all data collection methods.
|
QUESTION |
SUBSTANTIATION |
|
|
1 |
How much has time pressure affected the data quality assurance process? |
Time pressure may, to a certain extent and for some individuals/analysts, positively correlate with concentration and productivity. Overall, time pressure tends to correlate negatively with accuracy. In section 10.6 , handling time pressure is also discussed in more detail. |
|
2 |
How high were the stakes associated with the issue underpinning this strategic analysis work? |
High stakes tend to be proportional to input data quality risk. When the return may be high – in the form of recognition for the analyst’s contribution to a large project – an analyst with a high recognition need may be prone to letting down his guard on data quality, if only to show off with his work. |
|
3 |
What power relationships surrounded the analyst in relation to the individual input data? |
In the case of asymmetric power relations between a junior analyst and a senior company subject matter expert, an analyst doubting the expert or the director is culturally often unheard of. In such case expertise is all too easily mistaken for objectiveness. Chapter 12 covers the relation of analysts working with experts in more detail. Chapter 16 covers the analyst/decision-maker relation in more detail. |
|
4 |
What is the risk profile for assessment mistakes due to the external factors affecting the analyst? |
TABLE 10.8 QUESTION CHECKLIST ON SITUATIONAL RISK FACTORS FOR WRONGLY ASSESSING INPUT DATA
INTERMEZZO: DECEPTION AND STRATEGIC ANALYSIS
Literature on deception in military intelligence may have its relevance for strategic analysis in a business environment. Prior to diving into deception as such, I would first like to share a quote, attributed to J.W. von Goethe, that may puts the notion of deception into perspective (Jervis, 2010d):
“We are never deceived, we deceive ourselves.”
In other words: an adversary may feed us incorrect or intentionally incomplete data, analysts who mislead themselves have only themselves to blame for incorrect conclusions. What I refer to as ‘deception’ is the way in which an adversary feeds the analyst data, prompting the analyst to draw the wrong conclusions from these data.
I came across some insightful material that identifies four principles of deception (Bruce, 2008e). Deception not only relates to espionage and to military ambushes, but it’s also at work when one tries to decipher corporate financial statements. There are so many ways to tell the truth and yet hide what really matters. Without becoming overly paranoid, knowing these principles may be an asset to an analyst:
• Truth – all deception works within the context of what is true.
• Denial – denying the target (for our purposes the analyst) access to selected aspects of the truth is the prerequisite to all deception.
• Deceit – all deception requires and utilizes deceit.
• Misdirection – deception depends on manipulating what the target (the analyst) registers.
Any deception requires the idea of embedded truth to work out well. Truth is critical in confirming the expectations of an analyst one may wish to deceive. In doing so, the deceiver builds up credibility with the analyst.
Denial is the second key element in deception. Denial in combination with sharing only selective truths results in the analyst getting parts of the truth, but not – repeat not – the full truth. Denial is covered in some detail in section 10.6 below.
It is perfectly legal for a company to put selective emphasis on some truths while, through selective denial, withholding others. No company is forced to tell the full truth as long as all that is being communicated is true.
Deceit is the third inevitable element in deception. Deceit might involve the analyst receiving individual data points that the sender intentionally distorted. Intentionally spreading false company data is a criminal offense. Distribution of untruths, even when done through obscure channels, will in the end be traceable and may lead to criminal prosecution. This makes deceit an operation that decent companies rightly shy away from at all times. As a result, deception as it is known from military history is rare in business (Macintyre, 2012), (Macintyre, 2010c).
Imagine two sales representatives Alan and Brian working for competing companies P and Q, respectively. Alan and Brian vaguely know each other from university, so there is some rapport to start with. When Alan and Brian happen to meet each other in the context of an industry association meeting, off the record information may casually be exchanged. Assume that neither Alan nor Brian is operating a voice recorder in their pocket. As a result, both correctly assess that there will be no documented trace of the conversation that is about to start. Lack of traceability is no guarantee that their subsequent conversation will not result in issues related to competition law issues later. In competition law, absence of evidence does not equate to evidence of absence.
Fortunately, P and Q are both decent companies. Therefore, Alan and Brian have been properly trained – and trained again – in compliance with applicable competition laws. Alan and Brian will therefore be unlikely to discuss prices, individual customers or other topics that are explicitly forbidden under competition law. So far, so good.
During occasions like this, Alan may in spite of his training say to Brian, “we are going to launch product XYZ in Canada next year.” Let’s assume product XYZ competes with a product line that company Q sells in Canada.
Technically, Alan’s statement may be a breach of competition law, which in most countries would apply when a statement has not yet been made public in a press release or similar publication by company P. The moment Alan says this to Brian, the legal damage is done. In an attempt to control the damage, Brian’s training led him to reply that he doesn’t wish to discuss commercially sensitive issues with Alan. Once Brian has said this, company Q’s legal counsel Simone should have a reasonable expectation that Brian will immediately terminate the conversation.
The statement, however, is still on Brian’s mind when he returns to his office. Upon his return, Brian first goes to see Simone in the legal department to report the incident. Subsequently, he also goes to see company Q’s strategic analyst Karl-Heinz, who works on the same floor, to share the news. As you would expect, Karl-Heinz also completed the compliance training.
Karl-Heinz cannot resist the temptation to show off with this competitively-significant news. He therefore wrongly believes * that he only needs to disguise the source to be legally sound. Naively, Karl-Heinz thus reports in writing in his next strategic analysis newsletter to top management that, “rumor has it that company P intends to launch product XYZ in Canada next year.”
This anecdote shouldn’t sound familiar in most companies, but unfortunately it probably does. That is why competition law training is a critical element in strategic analysis (and beyond).
In response to this rare early warning, company Q now prepares plans to avoid losing customers to company P’s product launch in Canada. The strategic analysis department will be told to be on full alert for corroborating evidence of company P’s preparations for the launch. The local sales office is directed to secure long-term sales commitments for product XYZ as quickly as possible. The sales staff, aiming for volume rather than value share, start to offer their best customers attractive discounts in exchange for long-term contracts. Their priority is to try to retain sales, ahead of news reaching the market of company Q starting sales operations in Canada, or even worse, of company Q actually approaching potential customers.
While company Q’s defensive preparations in Canada proceed diligently and even run ahead of plan, company P’s CEO is featured in a press release announcing that a new sales office has been opened in Mexico and that sales will commence there within the next few weeks.
This is what in deception is called ‘deceit’ and ‘misdirection’. Sales representative Alan most likely provided sales representative Brian deliberately with false information, to compel company Q to focus on Canada. Whilst focusing on Canada, company Q’s sales team in Mexico was not on top alert allowing company P to (more) quietly prepare its launch there.
Sales representative Alan certainly lost sales representative Brian’s trust. The next time they met at the trade association, Brian grumpily approached Alan and expressed his dislike of having been steered in the wrong direction. Alan replied with a simple, “A few weeks after we met our Board changed the plans…” leaving Brian puzzled over whether Alan’s deception was intentional or not. This proves that (Moore, 2007a):
“It is easier to lead a target astray than to change his mind.”
|
WHO AM I AS |
In section 9.1 I already emphasized that in analysis the human mind matters most. Yet, regardless of the extraordinary capabilities of the mind, it is essential to remain critical of its outputs. What the mind observes via the senses is determined by the observer, almost as much as it is determined by an objective truth. In analysis, the lovely feline creature we met in chapter 9 is virtually omnipresent. Schrödinger’s cat showed that some experiments theoretically can’t be done because the measurement tools required for doing them would fundamentally affect the outcome of the experiments. In strategic analysis, a key measurement tool is the analyst herself. The need for individual analysts to recognize themselves as critical analysis tool is essential. How can you as an analyst attempt to understand the behaviour of others when you do not understand yourself (Heuer, 1999a)?
By now it has been scientifically accepted that internal biases do unconsciously affect human assessments of data or situations. Biases thus also apply to an analyst making assessments regarding individual input data correctness. Biases are systematic errors (Kahneman, 2011a). This in a way is good news, as systematic errors are predictable and by implication may even be preventable.
The root causes of an individual analyst’s biases may be (Bruce, 2008e):
• Personal
• Cultural
Below I will briefly look into both of these influences. It is up to you as analyst to determine to what degree you can relate to this.
PERSONAL BIASES HAVE THEIR ROOTS IN INDIVIDUAL EXPERIENCES AND NEEDS
Personal biases relate to personal experiences, needs and beliefs formed by the individual. These biases may relate to experience-based unique knowledge possibly gained over decades of working on strategic analysis projects. The latter knowledge is often of a tacit nature. Patterns of phenomena that in the analyst’s personal experience have always been influential are among the hardest for the analyst to unlearn. In other words (Jervis, 2010e):
“It is perhaps the most confirmed proposition in cognitive psychology that once a belief or image is established, new material will become assimilated to it, with discrepant and ambiguous information being ignored or fitting into the established views.”
An experienced analyst is thus exceptionally valuable because in their memory they have built up multiple patterns that allow for fast and often correct processing of seemingly unrelated data. Over the course of the evolution of mankind, premature closure of one’s mind proved an energy- and time-saver when facing previously experienced problems (see also in chapter 12 ). Analysts, however, by implication are also remarkably vulnerable when situations in the external environment change in such a way that previously built-up patterns no longer apply. These patterns may be referred to as mindsets. Mindsets have a role in allowing the human mind to treat multiple independent data points efficiently by clustering them. But it’s important to recognize that human mindsets, no matter how valuable, are not free of bias (Heuer, 1999a):
“(Mindsets) tend to be quick to form but resistant to change.”
Moreover, mindsets that have been formed in human memories are normally not retroactively reorganized in response to new information (Heuer, 1999c). Once a mindset is part of one’s memory, it values data that support the mindset higher than data that do not do so. As a consequence, data that do not fit the original mindset do not become more memorable when the mindset changes in response to new data. Once rejected, data will always remain hard-to-find or even get lost in the human memory.
Table 10.9 presents a checklist focusing on personal biases. The list may not be exhaustive due to my own potential unconscious biases. The questions in table 10.9 are also not 100% mutually exclusive from the questions mentioned in table 10.8 . The situation analysts find themselves in may determine who the analyst is or dares to be. Any overlap between questions in these tables hopefully only reinforces the relevance of identifying and countering the potential biases described.
CULTURAL BIASES ORIGINATE FROM AN ANALYST’S SOCIAL ENVIRONMENT
In addition, cultural biases may affect an analyst. An analyst acquires cultural biases as an inhabitant of a specific social environment. Culture may both mean the organizational culture the analyst has to operate in, or the broader cultural norms of the society in which the organization at large operates. The culture of a society at large also determines methods of problem solving that may be applied by analysts. In an Asian context, group-based methods of problem solving may, for culture reasons, be preferred over individual methods.
The opposite may be the case in Western cultures, which are more individualistic, where and individuals generally preferring to take all the credit for an analysis – and indeed assuming all the risk when such analysis proves flawed. Six common factors tend to contribute to cultural biases (Bruce, 2008e):
• Knowledge
• Morals
• Beliefs
• Customs
• Cognitive styles
• Habits
As culture hides itself best from its own participants, at times it is hard to see where seemingly objective knowledge has been culturally determined. Being aware that culture matters is is indeed valuable, but that recognition is unfortunately no guarantee against making culturally biased assessments.
KNOWING AND RECOGNIZING BIASES DOES NOT PROTECT AGAINST HAVING BIASES
Being aware of biases does unfortunately not protect against being seduced by biased thinking (Kahneman, 2011d):
“Teaching psychology is mostly a waste of time.”
Kahneman seems to me to suggest that increasing the awareness of an individual’s potential failures in their assessments doesn’t mean that such awareness helps these individuals subsequently minimize their own biased thinking.
No matter how sober this conclusion seems to be, I do not believe that the above observation justifies ignoring biases. On the contrary, I am definitely positive on the value of doing so. Even when little can be done against internal biases, it remains remarkable how well awareness of biases can help the analyst recognize the biases of others (Kahneman, 2011e). This recognition, when looking at the business environment of a company, will always be a core task for a strategic analyst. Recognizing the flawed logic of a competitor’s strategy undoubtedly is a great analyst asset.
AN ORGANIZATION’S CULTURE MAY LEAD TO BIASED ASSESSMENTS
Cultural biases indirectly relate to individual data point correctness assessments. Rather than looking at the data point as such, an analyst may wonder about the impact in the organizational culture of accepting the new data point as reliable. When reliable, analyst should ask herself:
• How could this new data point affect earlier conclusions that I wrote on this topic?
• How does doing so resonate with my customer?
• How does doing so make me look among my peers?
• How would the strategic analysis function head react to my conviction that this new data point is reliable?
Once an analyst has communicated a conclusion to customers, altering such a conclusion the moment new and presumably more reliable data become available may for organizational reasons be challenging. The easy way out for the analyst – depending on the culture of the organization – is simply to question the reliability of the new data, and after doing so to ignore the new data point. A strategic analysis function and a company at large that has developed this behaviour may very well be able to significantly reduce its strategic analysis expenditures.
In such an organization, intelligence will only be used when it confirms existing views. Analysis will never dare to challenge… and that is not a healthy situation. An analyst should feel safe when expressing a contrary view based on new data. Whether the new data require the company to revisit decisions is another thing, but at least that option should never be ruled out in advance.
|
10.5 |
SYNTHESIS ON |
In section 10.3 we described quality assurance checks related to external risk factors and individual input data. Section 10.4 concentrated on questions that the strategic analyst should ask himself relating to an internal origin of individual input data quality issues. In the daily practice of strategic analysis, a pragmatic balance is needed between following procedure and (sufficiently fast) progress. It obviously doesn’t make sense to ask all of the questions in the above sections for each and every data point. Rather, the questions on internal and external origins of individual input data quality issues are provided as checklists. An experienced strategic analyst is likely to have embedded the above questions in their analytic mindset. They may even have thought of some other questions that are relevant to a particular case. The objective of the above sections is to inspire the analyst to internalize an analytical mindset. Thinking of these questions should become automatic – the analyst should trust neither individual input data nor her own perception of individual input data at face value.
Diagram 10.4 summarizes the result of the individual input data correctness assessment. The diagram depicts four situations: two where the analyst correctly assessed the quality of the input data and two where the analyst did not do so.
When the analyst has meticulously applied the questions from the lists provided in the above sub-sections, individual input data of poor quality should have been rejected (bottom left in the matrix) and, high-grade data should have been accepted (top right in the matrix).
FALSE NEGATIVES: IGNORING A CORRECT SIGNAL
In strategic analysis a false negative is defined as a conclusion that input data are false and can thus be rejected, when in reality they are actually correct. Rejecting high quality input data is a serious but not uncommon failure in strategic analysis work (bottom right in the matrix). In military intelligence examples, the rejection of high grade intelligence has been documented and analysed. 6 With the outbreak of both the First and Second World Wars, high-grade intelligence had been ignored, with dire consequences.
The risk of false negatives thus makes it imperative that the analyst uncover the root causes and ascertain how these flaws crept into the process. Additionally the analyst needs to explore how to prevent them from happening in the first place.
When rejecting high-grade intelligence as too good to be true, the receiving side might:
• Underestimate the quality of its own collection organization and efforts.
• Overestimate the professionalism of the data protection in place at the competitor or military adversary.
• Overestimate the intentional deception initiatives in place at the competitor or military adversary.
• Overrate its own (often ethnocentric) view of what the competitor will do next.
In strategic analysis for business, the fear of deception is generally less prevalent than in the military, given that intentional competitor deception in business is less common. As a result, the rejection of high-grade data introduces the risk of leaving one’s own company exposed to or unprepared for a change in its business environment. A false negative rejection (rare as it may be) of a strategic analysis warning on a competitor’s move inevitably leads to undesirable exposure to surprises.
FALSE POSITIVES: PERCEIVING EITHER NOISE OR ABSENCE OF NOISE TO BE A SIGNAL
False positives in strategic analysis are more common (top left in the matrix). Overestimating the value of a data point is not uncommon in our line of work. False positives come in two flavours:
• Mistaking noise for a signal.
• Mistaking the absence of noise for a signal of absence.
MISTAKING NOISE FOR A SIGNAL
The most common occurance of false positives when a source believes that something is about to happen when in fact it isn’t. Sounding a warning about such false positives is known in the trade as ‘crying wolf’. In this case, the strategic analysis department that was misled by the source may send out a warning signal to management about something that’s never really going to happen. Crying wolf can:
• Waste the analyst’s company’s preparation time and efforts for the wolf (that never came).
• Reduce the analyst’s or the strategic analysis function’s credibility with management.
• Lead management to ignore the analyst’s next, possibly correct, warning.
The potential consequences of false-positive fatigue can be seen in the US military’s complete and utter surprise at Pearl Harbor in 1941 (Wohlstetter, 1965a):
“Admiral Kimmel 7 and his staff were tired 8 of checking out Japanese submarine reports in the vicinity of Pearl Harbor. In the week preceding the attack they had checked out seven, all of which were false.”
MISTAKING THE ABSENCE OF NOISE FOR THE SIGNAL OF ABSENCE
The opposite is also a logical possibility but is less common: that a source has it that something will not happen and it happens nonetheless. This misinterpretation can also have a negative impact on your company: you can find yourself unprepared for something that is going to happen.
The relevance of individual input data quality assessment becomes apparent when you realize that false negatives by definition lead to surprises for which your company is not prepared. False positives can produce their own unpleasant surprises, when the incorrect input data have it that nothing much is going to happen. A false positive, however, may also lead to an organization being over-prepared for a wolf that never shows up. This is obviously also undesirable. As trust comes on foot but goes on horseback, the strategic analysis function cannot afford too many false negatives or false positives as compared to its number of correct assessments.
The best way to avoid either false positives or false negatives is to make ‘foxy’ predictions, which I will discuss in chapter 12 . Ideally, data of perceived doubtful quality are neither over-valued, leading to false positives, nor rejected altogether, leading to false negatives. This is a fine balance that each analyst will have to find – preferably in an open discussion with the decision-maker (see chapter 16 ).
|
DATA SET |
A complete data set without known unknowns – and especially without the even uglier unknown unknowns – is a dream scenario in strategic analysis that rarely comes true. It may well be impossible to do strategic analysis work without the peril of unknown unknowns. Regardless, it is imperative in strategic analysis to minimize unknowns.
THREE ATTRIBUTES OF STRATEGIC ANALYSIS WORK GUIDE DATA-COMPLETENESS EFFORTS
An analyst may at a particular moment in time be pressured to deliver a view on a topic. In such cases it is necessary to balance the desire for data completeness, for timeliness and for high analytic quality. From a quality-assurance standpoint, data completeness is often but not always a boundary condition. In strategic analysis, the function head assigning projects for execution (and providing the necessary funding) should stress the importance of three non-content project attributes:
|
• cost |
(read: cheap) |
|
• speed |
(read: fast) |
|
• quality |
(read: top-quality) |
An experienced function head may emphasize combination of two of these three attributes, but should in that case de-emphasize the third attribute.
A project can be done quickly and cheaply, but in that case with that slap-dash approach, quality-control will inevitably suffer. It can be done quickly and be of top-quality, but this will have interesting cost implications. Finally, it can be done cheaply and be of top-quality (and be based on an almost complete data set), but in that case it may take unreasonably long to complete. The latter compromises or completely eradicates the usefulness of the project deliverable. In summary, the logical assumption is that upon heavily emphasizing two attributes, the third by definition cannot be obtained.
The function head must require a workable compromise between these three attributes. For every project a match is needed between the specific project’s demands regarding delivery time requirements (when management must reach a decision) and budget constraints, whilst at least allowing for minimum strategic analysis quality standards. The latter almost by definition relates to a minimum degree of data set completeness.
The three attributes – time, quality and cost each matter – but time generally matters most (Kirkland, 2010); (Bryan, 2009). This is true even when a possible data set is not yet complete. The importance of an analysis deliverable’s timing is illustrated in the quote below (McLaughlin, 2008b):
“Because analysts are almost always dealing with incomplete information, there is a natural tendency and desire to wait for the latest data. An assessment that is correct and complete in every way but arrives too late to affect the policymakers’ decision is one of the most regrettable outcomes in the analytic profession.”
There are times when being able to rapidly make decisions is more important than delivering analytically solid and balanced reports. In such cases the analyst would be well advised to deliver a ‘situation report’ in a timely manner than a thoroughly thought-through analysis that is delivered too late. In the analyst reporting’… (McLaughlin, 2008b):
“…it is (in the meaning of: remains) critical for the analyst to distinguish between what he or she knows and does not know and then to spell out what he or she thinks in the light of that”
In short, meeting project deadlines is of utmost importance. The need for timeliness overrides other demands. The overriding objective – with delivery timing being a given – is to optimize budget and quality. Normally the budget for an individual strategic analysis project tends to be proportional to the value upside of the business issue at stake. This boundary condition further narrows down the freedom to specify quality standards, as now a timing deadline and an upper limit for the budget are clearly laid out.
The strategic analysis function therefore has to adjust cost and efforts for data collection, analysis and reporting to meet both a project’s budget and time requirements. This is to be done whilst maximizing data set completeness, as the latter tends to be linearly proportional with the deliverable quality.
THE MERIT OF DATA-COMPLETENESS MAY DIFFER IN DIFFERENT PROJECTS
A complicating factor is that incomplete data and/or lack of tangible complete evidence does not always have to be an analytical problem. Good old Mr Sneath (introduced in section 9.3 ) made a judgment regarding Ivor Montagu, in the absence of complete evidence. In other words, his was an analysis based on an incomplete data set. Recall that Sneath was ultimately proven right, even though his accusations weren’t validated until two decades later. The data, even when incomplete, happened to be solid enough to act upon. The missing substantiating data – the hard, cold evidence – was apparently not critical.
In contrast, the ‘solid evidence’ that the US government presented on Iraq’s WMD program prior to the invasion of Iraq in 2003 proved incorrect (Pillar, 2012). Critical data points were missing. This led to Rumsfeld’s proverbial ‘unknown unknowns’. These examples only serve to show that there is no silver bullet regarding what to do in the case of incomplete data. Rather, the question becomes how to minimize critical input data set incompleteness. If the latter is inevitable because of time and/or budget constraints the analyst must figure out how to manage a critically incomplete input data set. This is a data processing topic which I will discuss in chapter 11 .
Let’s now look at intentional and unintentional (competitor) denial of data leading to data set incompleteness. A synthesis on data set completeness will be presented in section 10.7 .
INTENTIONAL DATA DENIAL
There are countless opportunities for competitors to engage in intentional data denial. A company, any company really, permanently faces a dilemma. On the one hand, stakeholders 9 call for the company to become increasingly open and transparent. On the other hand, the company knows that the more information it releases, the more easily its competitors will predict its next moves, knowing its competences and intent through the highly detailed public documents and records that it needs to publish. Openness generally erodes a company’s competitive edge and ability to surprise. Especially for listed companies, or for companies aiming to issue bonds on public markets, strict transparency is mandatory… so there is not really a choice. Privately-owned and/or family-owned companies and companies below a certain net sales size have lower requirements regarding the release of data into the public domain.
Smaller companies often only publish a balance sheet, but no profit and loss accounting, in their chamber of commerce records. In such cases, even company data providers like Dun & Bradstreet cannot offer detailed records, as they depend heavily on publicly released information. A general rule is that small and private companies have more options for denial, making strategic analysis of them tougher. This is for them a competitive edge.
There is a catch, though, even when data looks complete in company-published records. For highly transparent, listed companies, this relative openness should not be confused with objectivity. A competitor’s company, especially in its communications to shareholders, will always emphasize its successes and strengths and understandably much less so its failures and weaknesses. A presentation to the financial analyst community by a public company will only contain truths, loads of them, but will rarely present the full truth. Caveat emptor (let the buyer beware). The upbeat propaganda of corporate statements may convince investors but also intimidate competitors. Propaganda may be true; it is usually not the full truth.
UNINTENTIONAL DATA DENIAL
Unintentional data denial has two common origins: one is rather straightforward while the other is more understated.
In the straightforward version, the origin is that the competitor or any other sender provides the data in the public domain but the analyst or his collector is for some reason or another unable to find the data. This should not happen, but it does. Despite time pressure, at least the critical issues should be surfaced. Data collection should subsequently be focused on finding those data that are key to resolving the critical issues.
In the subtler version unintentional data denial is referred to as selection bias. In statistical language, selection bias could be defined as basing conclusions on characteristics of a group of data generated by a non-representative sample of that group of data. Put simply: when you want to understand what motivates a group of people, you get a selection bias when you only interview males. No matter how diverse the group of males that you interview, you will by definition overlook what motivates females. This is a simple example. In reality, a selection bias is a trap that is difficult to avoid (Denrell, 2005).
Selection bias typically occurs in management books that compare sets of companies; think of In Search of Excellence so to speak. As poorly performing firms have failed and disappeared, such publications tend to be biased in their reviewing of companies. The companies that are reviewed are more successful than average, thanks to their very existence, as those that failed no longer feature in the data set.
Reviewing the attractiveness of an industry, any industry, by looking at its current set of players and their (financial) performance thus almost by definition yields an overestimation.
This is perhaps the most striking difference between business strategic analysis on the one hand and military intelligence on the other. Failures in military intelligence, like 9/11 and Pearl Harbor, are well documented. Successes, however, are kept confidential to prevent the methodologies or sources that underpinned them to become known and thus useless. Uninformed observers (most of us), may end up with the impression that such services are delivering dismal performance, based on intentionally denied data on successes. In business, the exact opposite seems to be the case. Common failures in business, except for the spectacular ones like Enron, are not widely publicized. Failed run-of-the-mill businesses have neither news value nor aspirational attractiveness to anyone but those most closely involved.
This results in the question: how to value an industry where eight out of ten companies make decent returns and two fail, either through going out of business or by being acquired for a song? There is no magic formula for correcting the missing data due to selection bias. When estimating the relevance of the missing data becomes challenging, the analyst can do nothing much more than add a firm disclaimer, however unsatisfactory that solution may be.
|
YNTHESIS OF DATA |
Similar to the synthesis in section 10.5 on data correctness, this section will provide a synthesis of data completeness factors. Diagram 10.5 summarizes the meta-result of the data set completeness assessment. The diagram depicts four situations: two where the analyst correctly assessed the completeness of the input data set and two where the analyst did not do so.
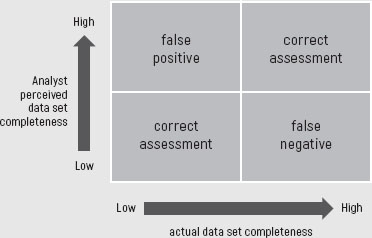
DIAGRAM 10.5 DATA SET COMPLETENESS ASSESSMENT
False positive outcomes are generated when either collection efforts were flawed or the analyst failed to properly brief the designated collector (or both). False positive outcomes may point at overconfidence by the analyst (Silver, 2013b). The analyst may think he has a complete data set when it in fact simply his perception of what the solution of the puzzle should look like. Such perceptions are based on patterns.
Human craving for recognizable patterns in their environment goes back to the Stone Age (Silver, 2013c). In the absence of natural defenses, human survival depended on outsmarting natural predators. Timeliness of the results of life-and-death threat analysis in the Stone Age determined survival, as facing a predator may not have allowed for the luxury of a lengthy analysis. In the evolutionary survival-of-the-fittest sub-species of the human race, the dimension of analytical speed may have mattered: the faster the analysis, the higher the chance of survival.
To me the commonality of this phenomenon with strategic analysis work is striking: timeliness trumps perfection (Kirkland, 2010). The human ability to recognize a pattern in a threat and immediately act as per the mental recipe stored in the corresponding mental threat folder may in today’s information age introduce flaws. Wired for speedy analysis, human brains may see patterns in noise or at least incomplete data sets where there are none. In that case, we create a false positive. Once a false positive has been created, the reflex is not to continue searching. As a result, the analyst almost unconsciously misses critical data. Critical data may be defined as data which would have changed the analyst’s conclusions (Frank, 2011a). Critical data are diagnostic – they are the data points that make or break an analytic conclusion. When an analyst knows critical data are missing, extra caution is needed when drawing conclusions.
In the next chapter I will address the topic of managing known missing data in more detail. Even when an analyst knows he is missing data, he may mentally still make up for them by applying a model that he feels comfortable with. The mind is more of a machine made for jumping to conclusions than for balanced considerations. Thus, the analyst’s model may barely fit the scarce data that are available, but it does fit them enough for the analyst to see what he wants to see. Again, the delusion of recognizing a false positive pattern plays a part. Confidence comes with positive experiences: being right builds confidence. That is why experts are a special risk category in this context. Experts have so often been right in the past that it turned them into experts in the first place. Being right many times over may have contributed to their overconfidence. How to work with experts as sources in strategic analysis is covered separately, in chapter 12 .
FALSE NEGATIVES
At the other end of the spectrum is the false negative. This phenomenon arises when the analyst has the critical data in his set but possibly being afraid of unknown unknowns, fails to reach actionable conclusions. Forecasters (including strategic analysts within a firm) may well be compared with chess players. Research points out that (Silver, 2013d):
“Amateur chess players, when presented with a chess problem, often frustrated themselves by looking for the perfect move, rendering themselves incapable of making any move at all. Chess masters, by contrast, are looking for a good move – and certainly if at all possible the best move in a given position – but they are more forecasting how the move might favorably dispose their position than trying to enumerate every possibility.”
Assessing data set completeness thus requires striking a balance between the unjustified fear of not making the perfect analysis and the overconfidence of unjustified déjà vu , whilst actually looking at something new.
The chess masters teach a lesson to strategic analysts here. Rather than wait for the final piece of data to come in and for it to be too late for your deliverable, use techniques developed in and for forecasting to manage the uncertainties – and report in a timely manner.
With this conclusion, I close this chapter on input data quality assurance. The next chapter focuses on what to do when data are lacking or when different data sources deliver input data that happen to contradict each other.
* In fact, Karl-Heinz shouldn’t have reported anything at all. Reporting non-public statements of adversaries on future plans that may affect markets may under some conditions be liable to scrutiny by anti-trust authorities. There are exceptions to this rule. Exceptions include cases where information on future investment plans may be shared between competitors. Such cases require the information to be shared under explicit non-disclosure agreements between companies for the exclusive purpose of assessing, for example, an M&A transaction. Caution is your mantra here. Involve legal counsel rather than act naively or overconfidently. Do not underestimate the impact that sentences in competition law cases may have on companies and even on individual company executives.