CHAPTER 12
Graphing Equations
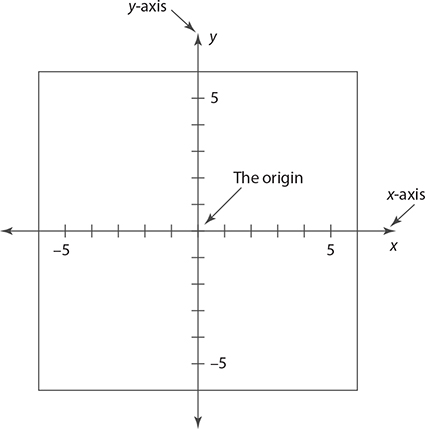
Equations involving two variables or unknowns can be represented visually with graphs. These graphs allow you to better understand how the variables move together and understand different properties of the equation. In algebra, equations are usually graphed in the x-y coordinate plane (sometimes just called the coordinate plane).
Plotting Points
Graphs of equations are made up of many individual points. To know how to graph a line or other equation, you must be comfortable graphing these points.

Points in the coordinate plane are called ordered pairs. As you can see above, ordered pairs always have an x value first and a y value second. These values tell you where the point is located in the coordinate plane. Plotting these points is really just about “reading” this ordered pair correctly. Starting from the origin [the point (0, 0)], the x-coordinate gives the distance left to right (negative means left) and the y-coordinate gives the distance up or down (negative means down).
EXAMPLE 1
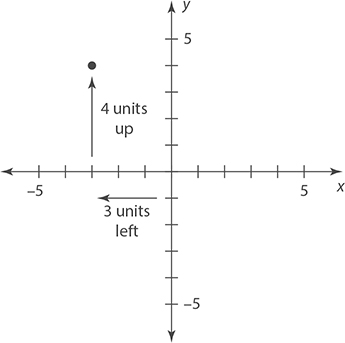
Plot the point (−3, 4) in the coordinate plane.
The x-coordinate is −3 and the y-coordinate is 4.
EXAMPLE 2
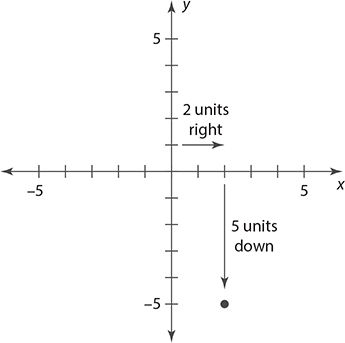
Plot the point (2, −5) in the coordinate plane.
The x-coordinate is 2 and the y-coordinate is −5.
EXERCISE 1
Plotting Points
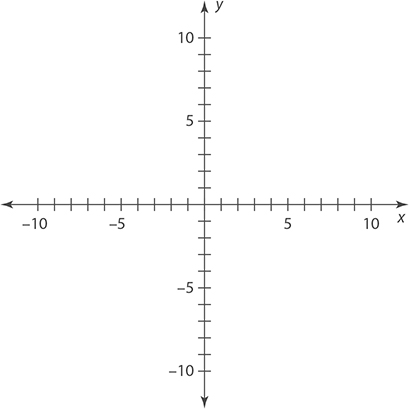
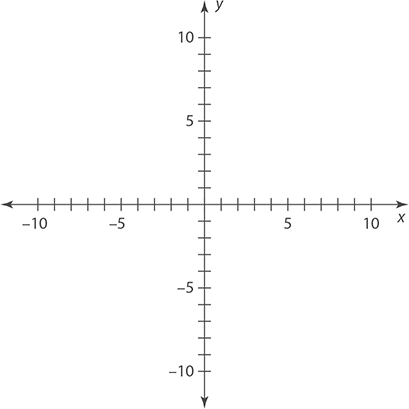
Directions: Plot each of the following points on the x-y coordinate plane below. Label your points with the appropriate letter.
1. A (−2, 6)
2. B (4, 4)
3. C (8, −5)
4. D (−3, −9)
5. E (0, 5)
Answers are on page 523.
Graphing Lines
In general, the graph of any equation represents the plot of all points that make the equation true. If you were to plot these points for the equations y = 2x + 5,  , and y = −x + 1, the resulting graphs would all be lines. This would be true of any equation where the x term has an exponent of 1.
To graph these types of equations (called linear equations), you only need to find two points on the line. Once you find them, you can connect them to make the full graph. To do this, you can pick any two values of x, and then see what the resulting values of y would be for that equation.
EXAMPLE 3
Graph the line represented by the equation y = 3 x + 1.
It does not matter what values of x you choose, so choose something easy to work with. Let’s use x = 0 and x = 1.
If x = 0, then y = 3(0) + 1 = 1. This means that the point (0, 1) is on the line.
If x = 1, then y = 3(1) + 1 = 3 + 1 = 4. This means that the point (1, 4) is on the line.
Now plot these points and sketch the line connecting them. This will be the graph of the equation.
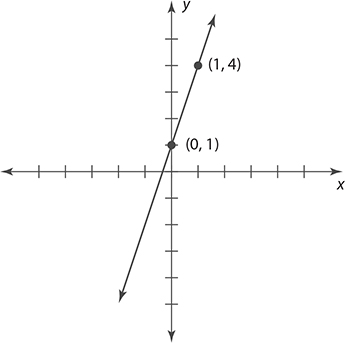
The points that you used when graphing the line do not have to be labeled. They are shown here just to make it easier to understand how the line was created.
EXAMPLE 4
Graph the line represented by the equation y = − 2 x + 4.
If x = 0, then y = −2(0) + 4 = 4.
If x = 1 then y = −2(1) + 4 = −2 + 4 = 2.
Points: (0, 4) and (1, 2)
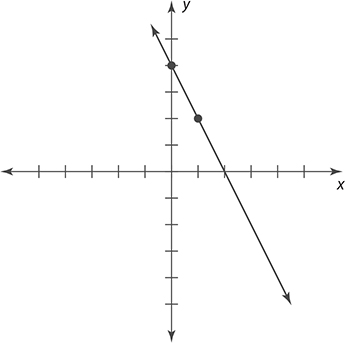
When you pick which x-values to plot, remember to save yourself work. If the number multiplying x is a fraction, pick a number that will be easy to multiply. For example, if you are graphing the equation  , using x values of 0 and 3 would be easy because 0 cancels out the x and 3 is easy to multiply by
  .
.
EXERCISE 2
Graphing Lines
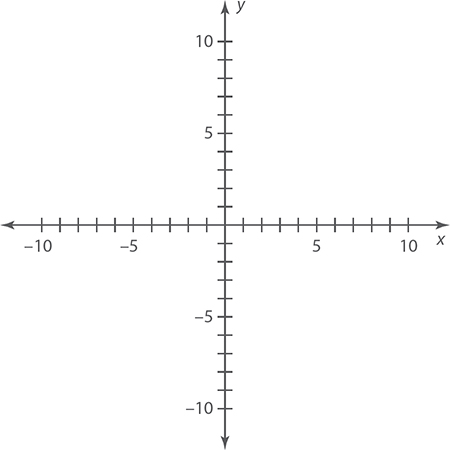
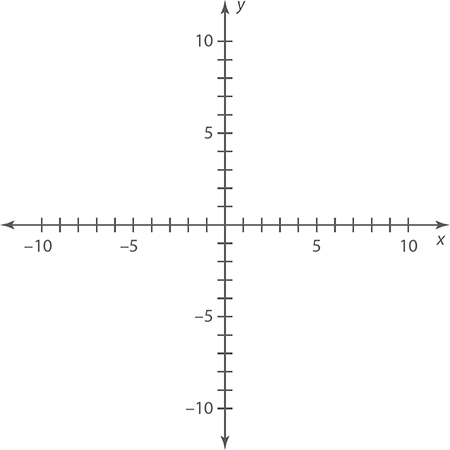
Directions: Graph the following lines on the x-y coordinate plane.
1. y = −5x − 10
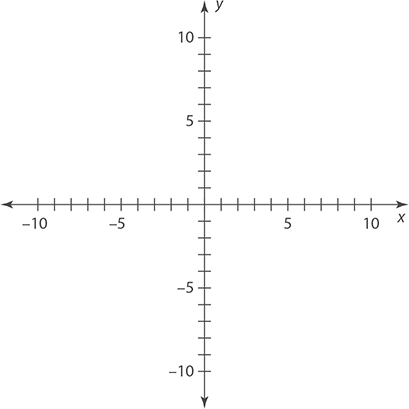
2. y = −x + 1
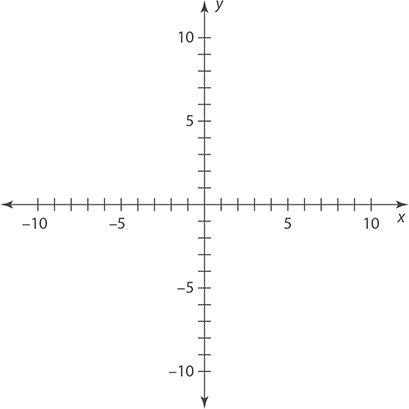
3. 
4. y = 4 x − 9
5. y = x + 7
Intercepts
The intercepts of any graph are the points where it crosses the x and the y axes. For an x intercept, there is no height to the point, so the y-coordinate is zero. For a y intercept, the point is not moved left or right from the origin, so the x-coordinate is zero.
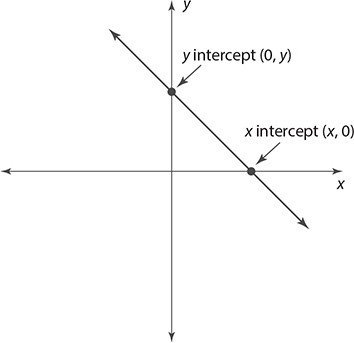
If you do not have the graph, the x and y intercepts can be found using the following steps.
• To find the x intercept: Let y = 0 and solve for x.
• To find the y intercept: Let x = 0 and solve for y.
EXAMPLE 5
Find the x and y intercepts of the line y = −4 x + 6.
Find the x intercept: Let y = 0 and solve for x.
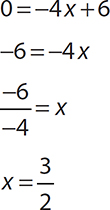
The x intercept is 
Find the y intercept: Let x = 0 and solve for y.
y = −4(0) + 6
y = 6
The y intercept is (0, 6)
You may have noticed that the y intercept was much quicker to find. What you are noticing is that when the equation is written in the form y = mx + b where m and b are numbers, b represents the y intercept. For example, the y intercept of the line 
EXERCISE 3
Intercepts
Directions: Find the x and y intercepts of the following lines.
1. 
2. y = x + 5
3. y = 8 x − 10
4. y = 3 x − 15
5. y = − x + 2
Answers are on page 524.
Slope
Slope is a way of measuring the steepness of a line. Ignoring the sign, a very steep line will have a very large slope and a very flat line will have a very small slope. The sign of the slope also tells you about the direction of the line. Lines with positive slopes rise from left to right. Lines with negative slopes fall from left to right.
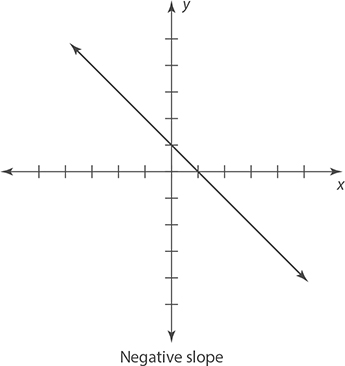
There are two special cases in regard to slope.
• The slope of any horizontal line is zero.
• The slope of any vertical line is undefined.
Calculating the Slope
The slope of a line passing through two points can be found using the slope formula (this formula is given on the GED® test formula sheet):

In this formula, m represents the slope and the points are represented by (x1, y1) and (x2, y2). Another way to define slope is as the change in y over the change in x. For this reason, slope is almost always represented as either a whole number or a reduced fraction.
EXAMPLE 6
Find the slope of a line passing through the points (1, 4) and (2, 7).
Given these two points, (x1, y1) = (1, 4) and (x2, y2) = (2, 7), and plugging these into the formula
 ,
,
the slope of the line is 3.
EXAMPLE 7
Find the slope of the line graphed in the x-y coordinate plane shown.
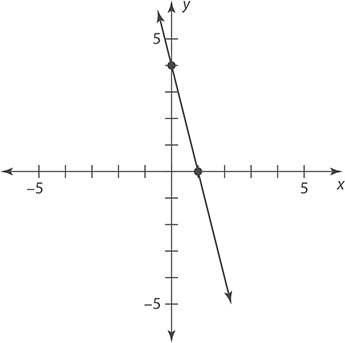
Based on the graph, the line passes through the points (0, 4) and (1, 0). Letting (x1, y1) = (0, 4) and (x2, y2) = (1, 0), the slope is

In the last section, you saw that when a line is in the form y = mx + b, the b value is the y intercept. It is also true that when a line is in this form, m is the slope. For example, the slope of the line  is
is  . For this reason, this form is called the slope-intercept form of an equation.
EXAMPLE 8
What is the slope of the line 4 x − 3 y =10?
If you solve this equation for y and put it in slope-intercept form, you will be able to “read” the slope from the equation. Solving for y:
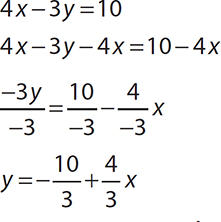
The coefficient of x is  , therefore the slope is m =
  .
.
Parallel and Perpendicular Lines
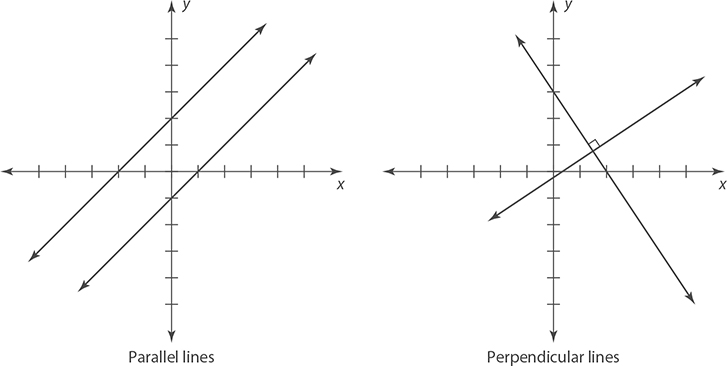
Two lines that pass through different points but have the same slope are called parallel lines. Two lines that cross at a single point forming right angles are called perpendicular lines. Perpendicular lines always have negative reciprocal slopes.
EXAMPLE 9
Line n passes through the points (−2, 5) and (8, 1). What is the slope of a line parallel to line n?
Parallel lines always have the same slope, so if you find the slope of line n, that will be the same as the slope of any line parallel to n.
Slope of line n: 
Line n and any line parallel to n have a slope of  .
.
EXAMPLE 10
What is the slope of a line perpendicular to the line 
This line is in slope-intercept form, so you know the slope is  . Any line perpendicular to this line will have the negative reciprocal slope. To get the negative reciprocal, flip the fraction and change its sign.

The slope of any line perpendicular to the given line is −4.
Interpreting Slope
In general, the slope of a line can be thought of as a rate of change. In
applications, the formula  can be adjusted to whatever x and y represent. If the denominator is 1, then the slope represents the change in y for every one unit of change in x. A rate in this form is called a unit rate. Many common ways of measuring speed are unit rates. Some examples include miles per hour when driving and words per minute when typing.
EXAMPLE 11
The price of a certain item P in dollars changes with its age A in years according to the formula P = −1.3 A + 10. In terms of dollars per year, at what rate is its price declining?
In this formula, P is taking the usual place of y and A is taking the usual place of x. The slope represents the change in P (price) over the change in A (age). Because the slope is written as a decimal or whole number, it represents a unit rate. In other words, the price is decreasing by $1.30 for each year.
EXAMPLE 12
The following figure represents the additional distance covered by a student on her second day of a weeklong bike tour. Given this graph, what was the student’s rate of speed on the second day, in miles per hour?
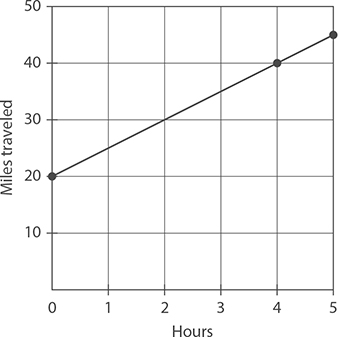
In this example, x represents hours (because it is the horizontal axis) and y represents miles (because it is the vertical axis). Therefore, the slope is

If this is simplified so that the denominator is 1, then it will give the change in miles for every 1 hour. In other words, it will be the speed in miles per hour.
To calculate the slope, you need two points. Looking at the graph, the line passes through the points (0, 20) and (5, 45). Therefore the slope is:

She was traveling at a rate of 5 miles per hour.
EXERCISE 4
Slope
Directions: For questions 1 through 4, find the slope of the line that passes through the given points.
1. (0, −8) and (2, 6)
2. (−4, 2) and (1, 6)
3. (1, 4) and (0, 7)
4. (10, 6) and (−5, −2)
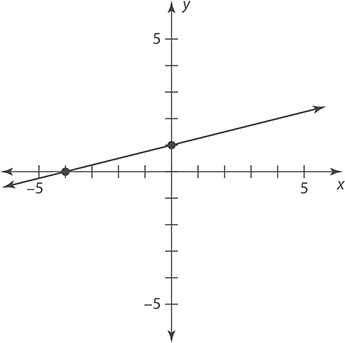
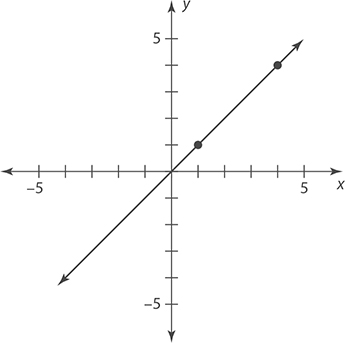
For questions 5 and 6, find the slope of the line graphed in the given figure.
5.
6.
7. What is the slope of any line parallel to the line −2x + y = 2?
8. What is the slope of any line perpendicular to the line 
The graph shown represents the number of items produced at Smith Manufacturing during the first five hours of the day.
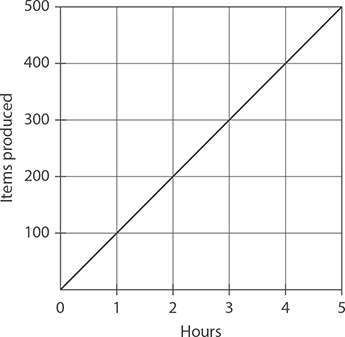
9. How many items did Smith Manufacturing produce each hour?
10. If Jackson Manufacturing produces items according to the formula N = 150T, where N is the number of items produced in T hours, then which factory produces items faster?
Answers are on page 524.
Finding the Equation of a Line
Given two points, or even just the slope and a single point, you can find the equation of any line. To do this, use the point-slope formula y – y1 = m(x – x1). In this formula, m is the slope, and (x1, y1) is a point that the line passes through.
To use this formula, follow these steps.
Step 1: Find the slope if it is not given.
Step 2: Plug in the coordinates from the first point.
Step 3: Simplify the equation.
(Usually you will write the equation in y = mx + b form.)
EXAMPLE 13
Find the equation of a line with slope −2 that passes through the point (−1, 6).
Step 1: The slope is given. It is m = −2.
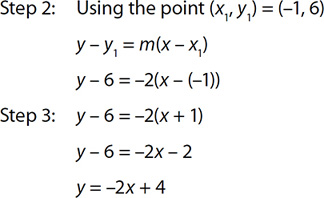
The equation of this line is y = –2x + 4.
EXAMPLE 14
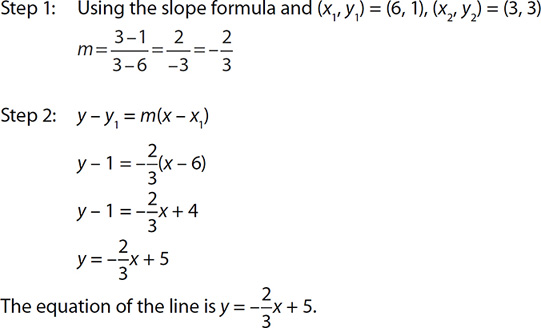
Find the equation of a line that passes through the points (6, 1) and (3, 3).
EXERCISE 5
Finding the Equation of a Line
Directions: For questions 1 and 2, find the equation of the line given the indicated slope and point.
1. m= −5, point: (1, 3)
2. 
For questions 3 and 4, find the equation of the line that passes through the two points.
3. (1, −4) and (2, −2)
4. (2, 5) and (5, 14)
5. Let n be a line with slope 4.
(a) Find the equation of a line parallel to line n that passes through the point (0, 2).
(b) Find the equation of a line perpendicular to line n that passes through the point (−3, 1).
Answers are on page 524.
Graphs and Systems of Equations
One surprising application of the graphs of equations is with systems of equations. With any system of equations, it is possible to sketch the graphs of both and use them to find the solution to the system.
EXAMPLE 15
In the figure are the graphs of two equations from a system of two equations involving the variables x and y. Based on this figure, what is the solution to this system of equations?
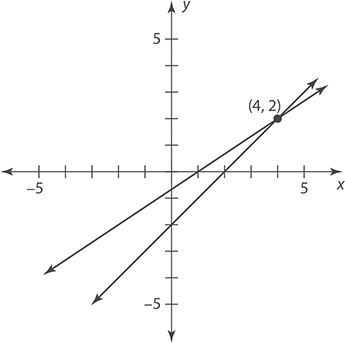
The two lines intersect, or cross, at the point (4, 2). In this situation, the x coordinate represents the value of x that makes both equations true and the y coordinate represents the value of y that makes both equations true. Therefore, the solution to the system is x = 4 and y = 2.