CHAPTER 13
Functions
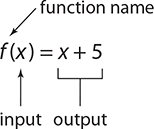
A function is a mathematical rule that relates an input to exactly one output. As an example, “add five” is a function because it takes any input number (the domain) and gives one output (the number plus 5). In algebra, functions are given names, and the most common are f, g, and h. If the rule that relates the output and input is given, it is shown using function symbols. The function “add five” is shown as follows using function notation. The symbol f (x) is read as “f of x.”
Evaluating Functions
In any function rule, the x or other variable acts as a placeholder for the domain of that function. To evaluate a function means to substitute a number for this variable. For example, f(−1)(read “f of negative 1”) means you should replace each x in the rule with −1.
EXAMPLE 1
If f (x) = x 2 + 1, find the value of f (3) .
f (3) = 3 2 + 1 = 10
EXAMPLE 2
If g(a) = a 2 − 2a + 5, find the value of g(−2).
g(−2) = (−2) 2 − 2(−2) + 5 = 4 + 4 + 5 = 13
EXAMPLE 3
What is the value of h(n) = n + 1 if n = 10?
h(10) = 10 + 1 = 11
EXERCISE 1
Evaluating Functions
Directions: Evaluate each function as indicated.
For questions 1 and 2, let f(x) = 5x + 2 and find the given value.
1. f(4)
2. f(−6)
For questions 3 to 5, let g(x) = 2x2 − x + 3 and find the given value.
3. g(0)
4. g(–1)
5. g(2)
Answers are on page 525.
Recognizing Functions
In general, any type of mathematical rule can be represented by a table or graph. How can you tell if the rule is a function? Look at a table showing the output y for each input x. With functions, for each input there is only one output by definition. If that rule holds in the table, you can say that the rule is a function.
EXAMPLE 4
In the table, y is the value after a rule f is applied to x. Based on this, is f a function of x?

There is one input that appears twice: x = −1. That is acceptable as long as the value of the output y is the same for both. However, in one case when x = −1, y = 0 and in the other, y = 2. Because there are two possible outputs for one input of x, f is not a function of x.
EXAMPLE 5
Does the table represent y as a function of x for the given values of x?

Here, y is a function of x for these values. Each input has only one possible output.
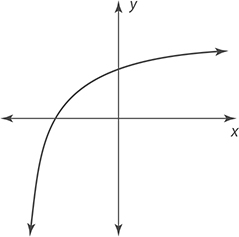
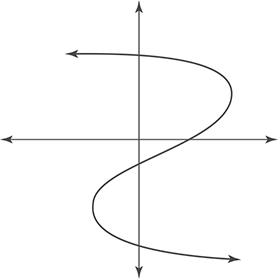
As you can see in examples 4 and 5, when checking a table, the key is to see if an input does not result in more than one output. When checking a graph, this idea remains the same. However, there is a shortcut that you can use called the vertical line test. This rule says that given any graph, if there is anyplace where a vertical line would touch the graph more than once, then the graph does not represent a function. Let’s see how this works.
EXAMPLE 6
Determine if the graph represents y as a function of x.

This graph looks like a function until you approach x = 3. After that, there are two y outputs for each x input. You can see this by using the vertical line test.
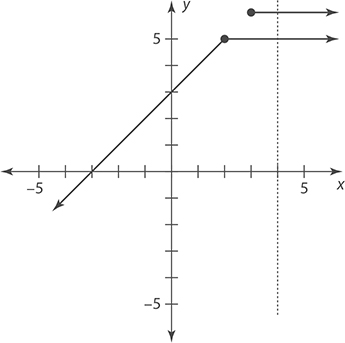
Because the line intersects with two separate lines at the same position, this graph does not show y as a function of x.
Remember that when using the vertical line test, you only need to find one place where the line touches two points on the graph. The following graph also does not show y as a function of x, because there is one place where a vertical line passes through two points on the graph. This graph shows two possible outputs for x = −2.

Also, be careful with the symbols used. An open circle means that the function is not defined at that point. Just changing the preceding graph a little bit will make it a function.
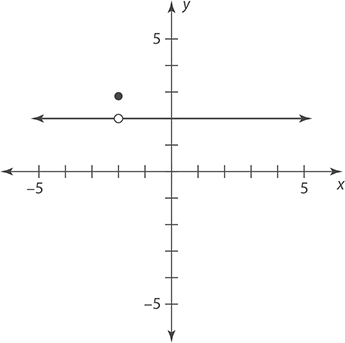
Now that the circle is open, there is only one output for x = −2. This is now a graph of a function.
Finally, here are two more examples so you can see that graphs can come in all types. The first graph does show a function because no vertical line could pass through two points. However, the second graph does not show a function. As you can see, it is possible to find places where a vertical line could touch more than one point on the graph.

EXERCISE 2
Recognizing Functions
Directions: In problems 1 and 2, determine whether the table represents y as a function of x for the given values.
1. 
2. 
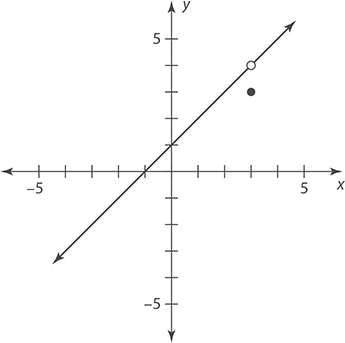
In problems 3 to 5, determine whether the given graph represents y as a function of x.
3.
4.
5.
Answers are on page 525.
Properties of Functions
Whether represented by a table, graph, or rule, many functions share similar properties. Because they are so common, it is important to be able to identify and compare these properties given a table or graph.
Recall that for any graph, the y intercept is the point where the graph crosses the y-axis and the x intercept is the point where the graph crosses the x-axis. For a function, there can be either zero or one y intercept and zero or many x intercepts.
EXAMPLE 7
Identify any x intercepts in the graph of a function f(x).
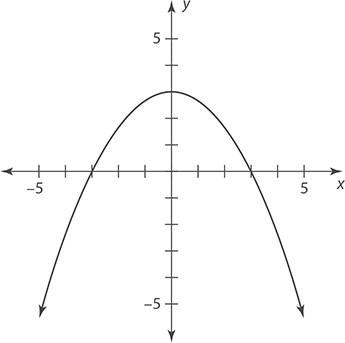
The graph passes through the x axis at x = −3 and x = 3. Therefore, its x intercepts are (−3, 0) and (3, 0).
EXAMPLE 8
Following is a table of values for a function f and a graph for another function g. Based on this information, which function crosses the y-axis at the highest point?
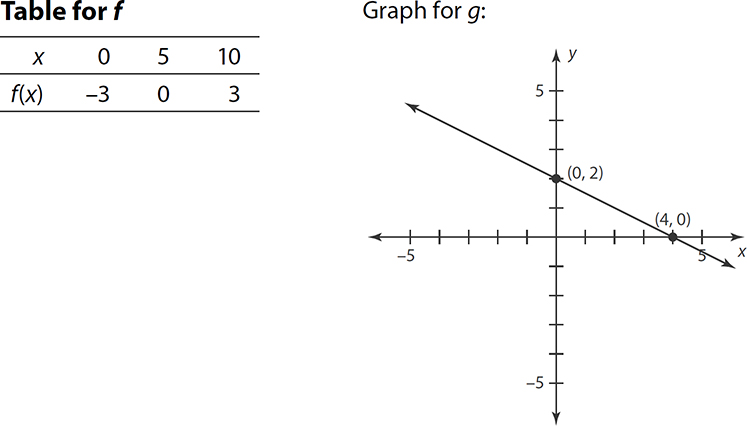
Looking at the graph for g, you can quickly see that the graph crosses the y-axis at (0, 2). Using a table, the point where the graph crosses the y-axis (the y intercept) is the y value when x = 0. From the table, when x = 0, f(x) is −3. That means if you were to graph f(x), it would cross the y axis at y = −3. Therefore, g crosses the axis at a higher point.
EXERCISE 3
Intercepts
Directions: Find the x and y intercepts as indicated.
For questions 1 to 3, use the tables to find the x and y intercepts of the given function.
1. 
2. 
3. 
4.
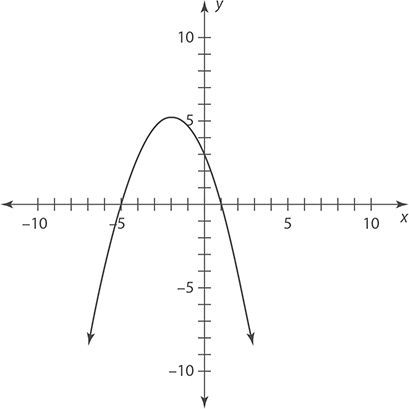
5.

Answers are on page 525.
Key Features of Function Graphs
Increasing and Decreasing Functions
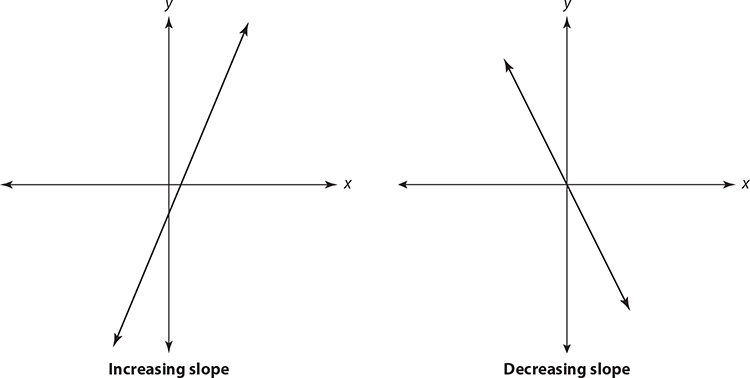
When working with lines, you saw that a line with a positive slope rises from left to right and a line with a negative slope falls from left to right.
If a function rises from left to right for a range of x values, it is said to be increasing over that interval. If the function falls from left to right for a range of x values, it is said to be decreasing over that interval.
Relative Maximums and Minimums
When a function changes from increasing to decreasing, there is often a small peak or valley in the graph. These small peaks and valleys represent relative minima and relative maxima.

EXAMPLE 9
Using the preceding graph, determine over what values of x the function is increasing or decreasing. Also determine at what x values the function reaches any relative minima or maxima.
In the preceding graph, the function is increasing for all x values up to −3. Then at x = −3, it has a relative maximum. After this, the function is decreasing until it reaches x = 4. There it has a relative minimum. After this, it increases for all x values greater than 4.
To state the final answer more formally:
The function is increasing for x values less than −3 or greater than 4.
The function is decreasing for x values between −3 and 4.
The function reaches a relative maximum at x = −3.
The function reaches a relative minimum at x = 4.
As you can see, relative maxima are points where the graph is higher than nearby points, while relative minima are points where the graph is lower than nearby points. Some graphs may not have any relative maxima or minima. For example, the graph of a line does not have either, because it is always increasing or always decreasing.
Positive and Negative Values
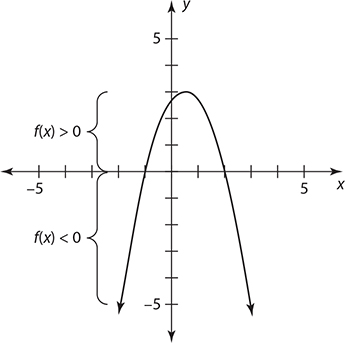
Using a graph, it is possible to determine when a function is positive (f (x) > 0) or negative (f (x) < 0) by paying close attention to the x-axis. Whenever a graph is above the x-axis, it is said to be positive, and whenever it is below the x-axis it is said to be negative.
EXAMPLE 10
Determine what values of x make the function above positive and negative.
The function is above the x-axis between x = −1 and x = 2. Therefore, you can say that the function is positive whenever x is between −1 and 2. Because before x = −1 the graph is below the x-axis, you can say that for values smaller than x = −1 the function is negative. The same is true for values greater than (to the right of) x = 2.
End Behavior and Periodic Functions
Whether a function rises or falls at the far end of a graph is called its end behavior. This corresponds to what happens as x gets very negative (left-hand side of the graph) or what happens as x gets very large (right-hand side of the graph).

EXAMPLE 11
Based on the graph of f (x), describe what happens to the value of f (x) as x gets very large or very negative.

Because the function is falling on the left and rising on the right, you can say: As x gets very large, the value of f (x) also gets large. As x gets very negative, the value of f (x) gets very negative.
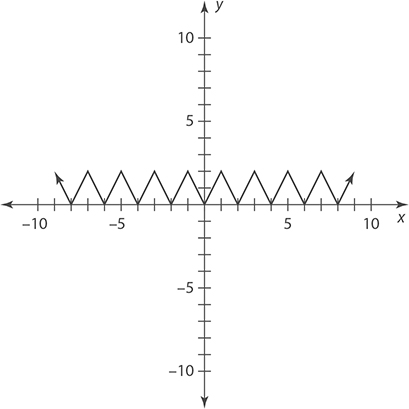
Instead of rising or falling on the ends, some functions have a pattern that repeats over a given range. These functions are called periodic functions. How often the pattern repeats is called the function’s period. For example, the function shown in the following graph is periodic with a period of 2 because its pattern repeats every 2 units.
EXAMPLE 12
If the function g(x) is periodic, what is the function’s period?

Because the pattern repeats every 4 units, the period of the function is 4.
EXERCISE 4
Other Properties of Functions
Directions: For questions 1 to 8, use the following graph of a function f(x).

1. For what values of x is the function positive?
2. For what values of x is the function negative?
3. For what value or values of x does the function reach a relative minimum?
4. For what value or values of x does the function reach a relative maximum?
5. For what values of x is the function increasing?
6. For what values of x is the function decreasing?
7. Describe what happens to the value of f(x) as x gets very large.
8. Describe what happens to the value of f(x) as x gets very negative.
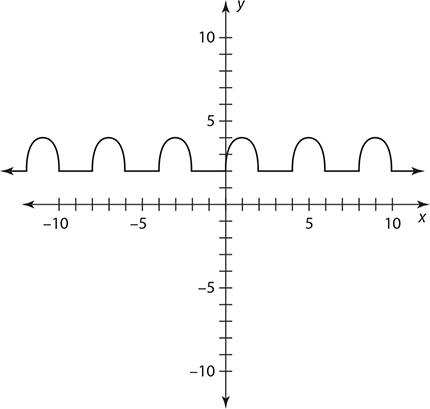
9. The given graph shows periodic functions. Determine the period of the function from the graph.
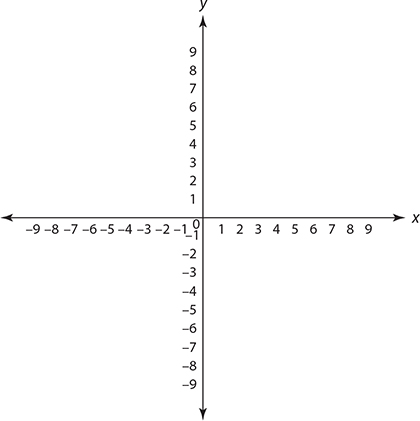
10. Sketch the graph of a function that is increasing between points (0, 0) and (3, 8) and decreasing between points (3, 8) and (9, –3).
Answers are on page 525.