CHAPTER 5
Ecosystems
Energy in Ecosystems
Energy is constantly cycling through ecosystems. In most ecosystems, there are four important feeding levels that determine the direction of energy flow. Energy is moved from one level to another as organisms are consumed.
• Producers are organisms (usually plants) that convert some of the sun’s energy into stored chemical energy.
• Primary consumers are herbivores. They obtain energy by consuming producers.
• Secondary consumers are carnivores that consume primary consumers for energy.
• Decomposers are organisms that obtain energy by breaking down dead organisms from the three other levels.
Flow of Energy
Models, such as the following energy pyramid, allow us to visualize the feeding relationship between organisms at different levels. They show the energy gained and lost over time. Producers form the base of the pyramid. The size of each block is proportional to the amount of available energy.

Conservation of Energy
Only a small percentage of a feeding level’s energy is passed up to the next level. Examine the following leaf diagram.
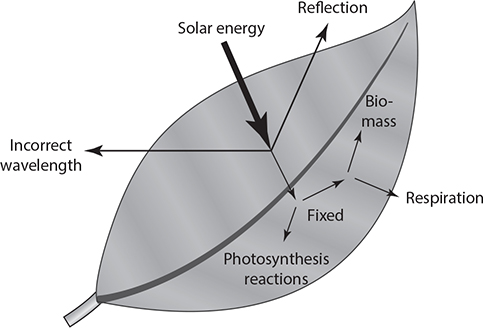
In a plant, not all of the available solar (light) energy actually makes it into the leaf. The energy that does make it into the leaf is made usable by photosynthesis. That energy may then be used during respiration. The energy that remains can be lost in several ways, one of which is heat. Finally, whatever energy is left in the leaf becomes available to the next feeding level when the plant is eaten.
EXERCISE 1
Energy in Ecosystems
Directions: Choose the best answer for each of the following items.
Questions 1 and 2 refer to the following drawing and information.
Arrows indicate the direction of energy flowing in and out of the cow.
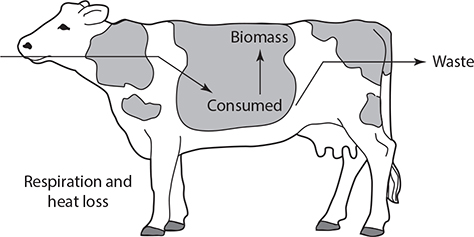
1. The arrow between “consumed” and “respiration and heat loss” is missing. Mark an arrow on the diagram to indicate the direction of energy flow.
2. The cow would best fit which of the following roles?
A. producer
B. decomposer
C. primary consumer
D. secondary consumer
Answers are on page 660.
Matter in Ecosystems
Food Chains
One way to represent feeding relationships is with a food chain. This model uses arrows to show the direction in which matter and energy are transferred between organisms.
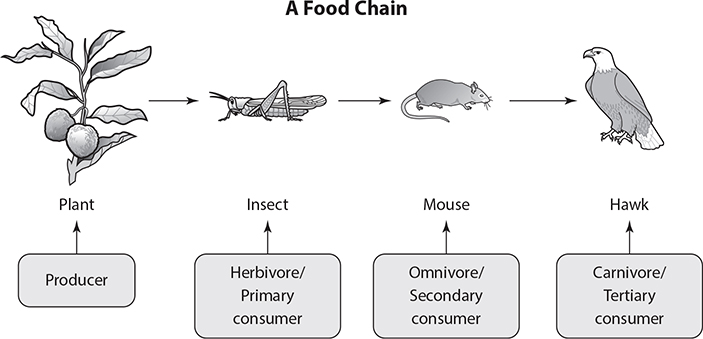
As you can see, each organism in the food chain represents a feeding (trophic) level in the passage of materials and energy. A food chain typically has no more than five links, because the amount of energy left by the fifth link is only a tiny portion of what was available at the first link.
Food Webs
Most ecosystems are complicated. They cannot be modeled by a single, unbranched food chain, because most organisms depend on more than one other species for food. The best way to model these feeding relationships is with elaborate food webs.

Food webs are a more natural model than a food chain because they show all possible feeding relationships at each feeding level. Some consumers feed at several different levels. The duck in this food web may eat snails (primary consumers) and big fish (higher-level consumers). Omnivores, including humans, eat producers as well as consumers from different levels.
Food webs also help identify limitations in communities. Consider what might happen to the frog population if pollution led to the destruction of aquatic plants. The organisms in the next feeding level would lose an important food source. The entire food web would be negatively impacted.
EXERCISE 2
Matter in Ecosystems
Directions: Choose the best answer for each of the following items.
1. Complete the statement with a term from the section.
The arrow in a food chain shows the direction in which ____________________ and ____________________ are moving through the food chain.
2. The best model of organisms’ complex feeding relationships is a(n)
A. food web.
B. food chain.
C. energy link.
D. energy pyramid.
Answers are on page 660.
Capacity for Change
A population is a group of organisms of the same species living in an area. The carrying capacity of a population is the maximum number of organisms that a particular environment can support over time. For example, when populations are less than the carrying capacity of a particular environment, births will exceed deaths until the carrying capacity is reached.
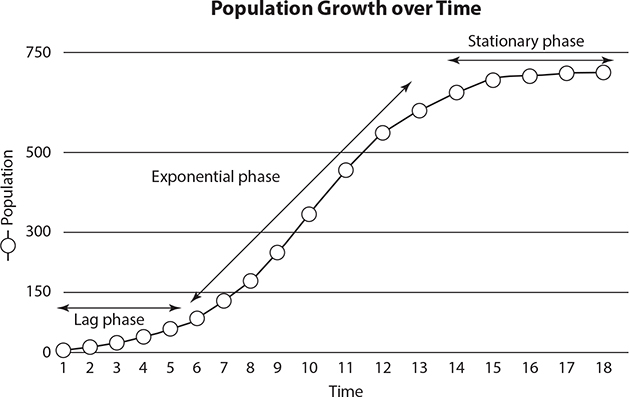
The following graph illustrates a population with a constant, but limited, food supply. During the lag phase the population size grows very slowly, and organisms mature and adapt to their environment. When food is plentiful, the population grows quickly (exponential growth phase). When the population size outgrows the amount of available food, growth begins to plateau (stationary phase, in which the carrying capacity of the population is reached).
Limiting Factors
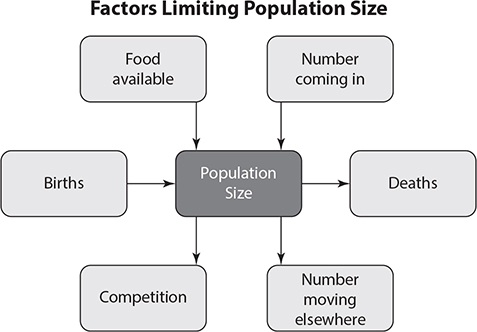
The following diagram shows six factors that can limit population size. For example, if competition between members of a species, or individuals of different species, for food or space increases, the population size will decrease. Other limiting factors can include the effects of a disease, changes in the amount of available space or light, and other environmental effects.
EXERCISE 3
Capacity for Change
Directions: Choose the best answer for each of the following items.
Question 1 is based on the following diagram.

1. Place an X on the diagram to indicate the correct location of the slow growth phase.
2. When populations increase and use up the available resources, the result can be
A. disease.
B. competition.
C. exponential growth.
D. more available food.
Answers are on page 660.
Relationships in Ecosystems
Predator-Prey
Predator-prey relationships are those in which one organism (the predator) feeds on another (the prey). These relationships help ecosystems function properly. Remember that energy is moved through an ecosystem by way of food webs or food chains. Predation ensures that the flow of energy continues, but it can also be a limiting factor on population size.
In the following graph, the prey population declines sharply several times. Each decline is followed by a crash in the predator population because of the reduced source of food. As a result of the reduced predator population, the prey population is able to rebound. This is followed by a rise in the predator numbers. Predator-prey relationships are important for the health of natural populations. Usually it is the young, old, or injured members of a population that are caught by predators. Predation restricts the size of the prey population within the limits of the resources that are available.

Symbiosis
Another type of relationship that impacts many species’ survival is symbiosis. This relationship occurs when there is a close and long-term association between members of different species. There are several different types of symbiosis. Examine the following chart to compare and contrast the different types of symbiotic relationships.

EXERCISE 4
Relationships in Ecosystems
Directions: Choose the best answer for each of the following items.
Questions 1 and 2 are based on the following passage.
A goby fish sometimes lives together with a shrimp. The shrimp digs and cleans up a burrow in the sand, and both the fish and shrimp live in the burrow. The shrimp is almost blind and at risk of being eaten when above ground. The goby fish will touch the shrimp with its tail to warn it of danger, and then both will retreat into the burrow.
1. Complete the statement with a term from the section.
When the shrimp is above ground, it takes on the role of ____________________ in the predator-prey relationship.
2. What type of relationship exists between the goby fish and the shrimp?
A. parasitism
B. mutualism
C. predator-prey
D. commensalism
Answers are on page 660.
Disruption of Ecosystems
Conditions in ecosystems are always changing. Sometimes they change quickly and dramatically, due to floods or fire. Sometimes they change slowly as new species are introduced and begin to take over an area. Available food, water, and fluctuating temperatures also play a role in the balance, or equilibrium, of an ecosystem.
In the following chart, four common disturbances in ecosystems are identified and described.

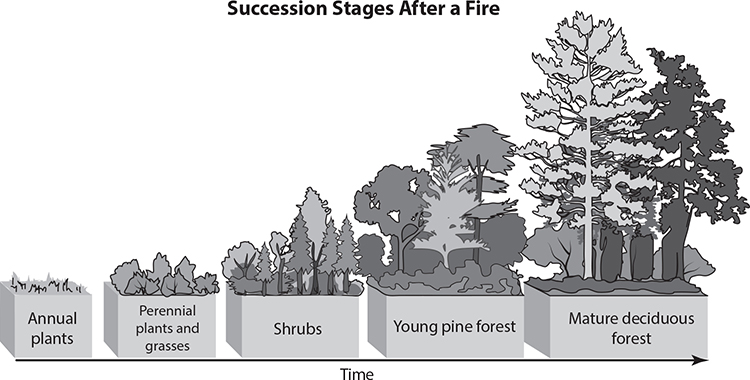
These disturbances lead to changes. Take, for example, a forest fire in a national park. Thousands of acres of trees, shrubs, and grasses are destroyed. However, over time, plants begin to grow in the scorched soil. The following diagram illustrates the succession that follows the disruption of a forest ecosystem.
Extinction
Sometimes an ecosystem is so completely changed that it can no longer support certain species. Extinction is the disappearance of a species when the last of its members dies. Although extinction can happen as a result of natural processes, human activities including hunting, urbanization, and the destruction of forests to create farmland are primarily responsible for the habitat destruction that eventually leads to extinctions.
EXERCISE 5
Disruption of Ecosystems
Directions: Choose the best answer for each of the following items.
1. Indicate your answer choice by connecting the events to the correct examples.

2. Complete the sentence with a term from the section.
Human activities have increased the rate of habitat destruction and caused the ____________________ of many species of wildlife.
Answers are on page 661.