CHAPTER 4
Outward Patterns, Inner Workings
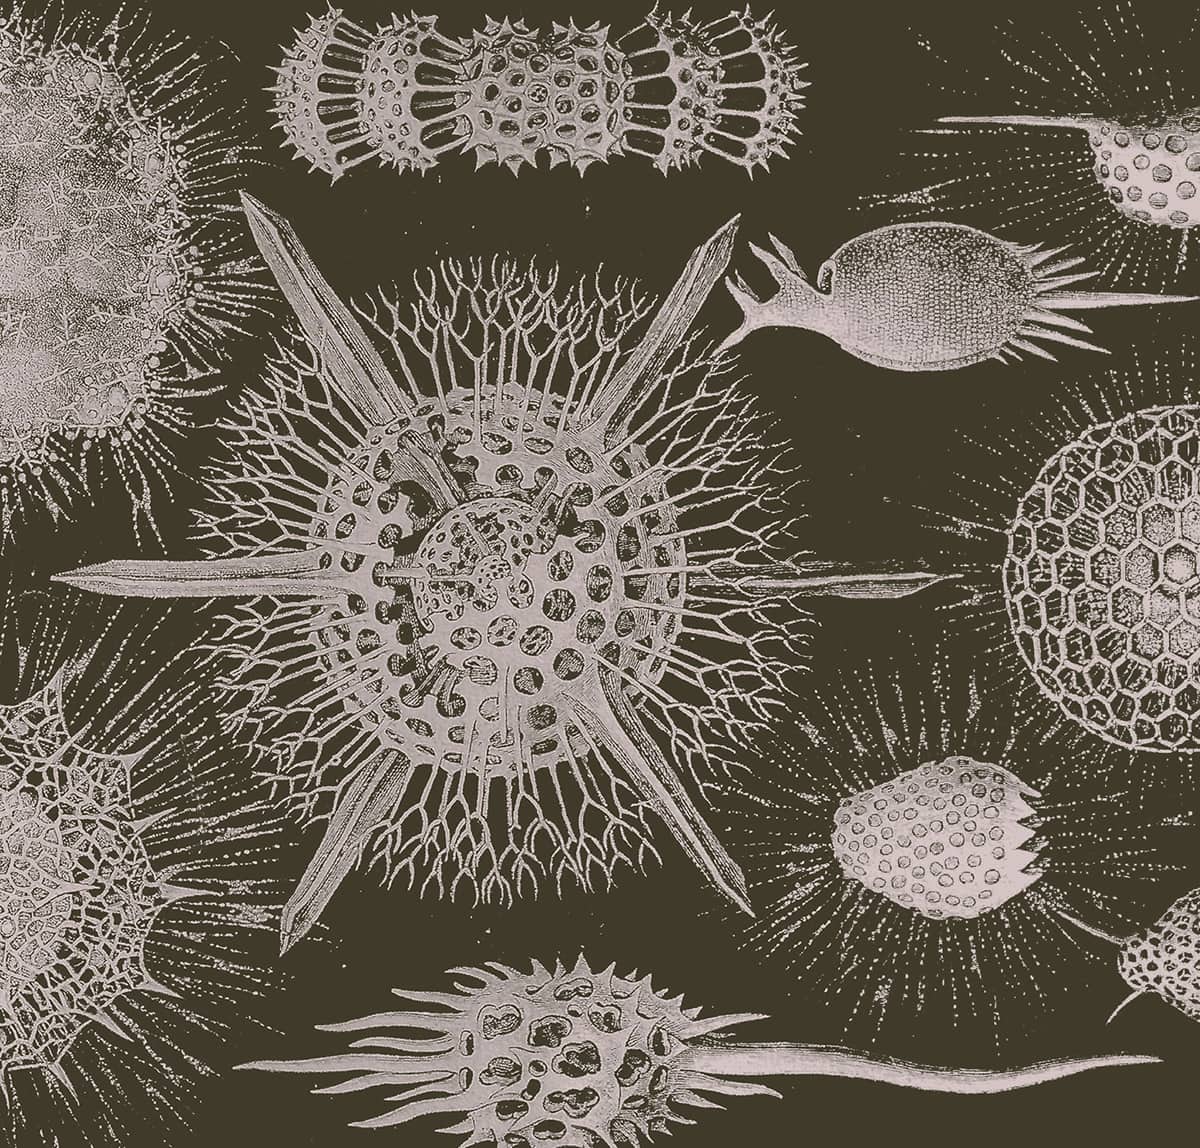
Ernst Haeckel (1834–1919), Kristallseelen, 1917; Kristallinische Arbeiten der Radiolarien-Seele.
The Modern World
(1900–Present)
Zoological classification has changed dramatically since 1900. There is now more information available to classify organisms. There are also more types of information and more ways to analyze it than ever before.
Because of this we must develop ever more inventive ways to graphically represent all that information. Now, not only do species change and diversify over time, but so do genes, chromosomes and genomes – twenty-four hours’ sequencing of an individual creature’s DNA produces far more information than can be depicted comprehensively within a single image. Also, organizing animals is no longer just about evolutionary relatedness; it also encompasses ecology, biogeography, plate tectonics, biophysics, conservation biology and many other measures by which creatures may be described, catalogued and given visual expression.
It is the field of genetics that has most changed zoology – genes, chromosomes and DNA. We are in the midst of a great upheaval in zoological classification that started with Gregor Mendel (see here) in the mid-nineteenth century, although his influence took many frustrating decades before it was felt. As mentioned in the previous chapter, his seminal work on the mechanisms of inheritance appeared in print just a few years after Darwin’s Origin of Species, yet his choice to publish in the Proceedings of the Natural History Society of Brno meant his theories were little read until they were ‘rediscovered’ in the early twentieth century. Even then, it was not until the structure of DNA had been elucidated, the genetic code deciphered and DNA sequencing methods developed in the 1950s, ’60s and ’70s, that genes could provide the information that eager zoologists wanted to use. In the 1990s came the sequencing of single animals’ entire genomes, and now we can sequence the genetic material of many individuals within a population.
It took decades to recognize the importance of Mendel’s work, to discover how genetic information is inherited in the form of the DNA molecule, and to find how that information creates and controls bodies – so in the meantime, twentieth-century biologists’ organizing instincts followed two different paths. Some focused on working out those genetic details, while others continued their animal-organizing without the assistance of genes or DNA.
Henry Fairfield Osborn (1857–1935), The Age of Mammals in Europe, Asia and North America, 1921; Section through the Eocene and Oligocene formations north of lake Qûrun, Faiyum, Egypt. Arrows indicate levels richest in remains of mammals.
As early as the 1920s suspicions were growing that animal diversity was not as simple as the titans of nineteenth-century biology had believed. Surveys of embryonic sea creatures revealed that the bombastic theories of evolutionary progress put forward by Ernst Haeckel (see here) did not stand up to scrutiny, and analysis of rock strata showed that different parts of different animals fossilize in unexpected and capricious ways. Scientists even interrogated Darwin and Wallace’s theory of natural selection: How fast does natural selection occur? Does it proceed gradually, or in fits and starts? Is the story of evolution written by rare, grotesque mutants? Is tree-like branching the only way animals diversify? Gradually the old, staunchly rooted evolutionary trees started to look distinctly precarious.
Indeed, mid-twentieth-century evolutionary trees are very different from their gnarled, knotty predecessors. Their gently curving branches of diversification and elegant spindles of population have a neat, Art Deco flavour, and often hardly look like real trees at all. Gone is the faux-antique lettering indicating evolutionary antiquity, replaced by the sharp, clear lines of 1950’s sans-serif typography. The new trees, clean and crisp, speak of careful, objective enquiry – a desire to organize the animal kingdom according to the dictates of hard-nosed twentieth-century science.
Yet all this time, the actual characteristics biologists used to classify animals remained the same as those used by their Victorian forerunners. For example, the abundant dinosaur fossils excavated from the great North American fossil beds were classified according to the twists and tuberosities of their bones. ‘Palaeontology’ means the ‘study of ancient forms’, and animal structure remained the key to phylogeny until surprisingly recently. For example, the long evolutionary road to the mammals was mapped largely by the examination of teeth and the tiny bones of the middle ear. Even extant species were still classified almost exclusively by their morphological characteristics. Well into the latter half of the twentieth century, anatomy – not genetics – was still king.
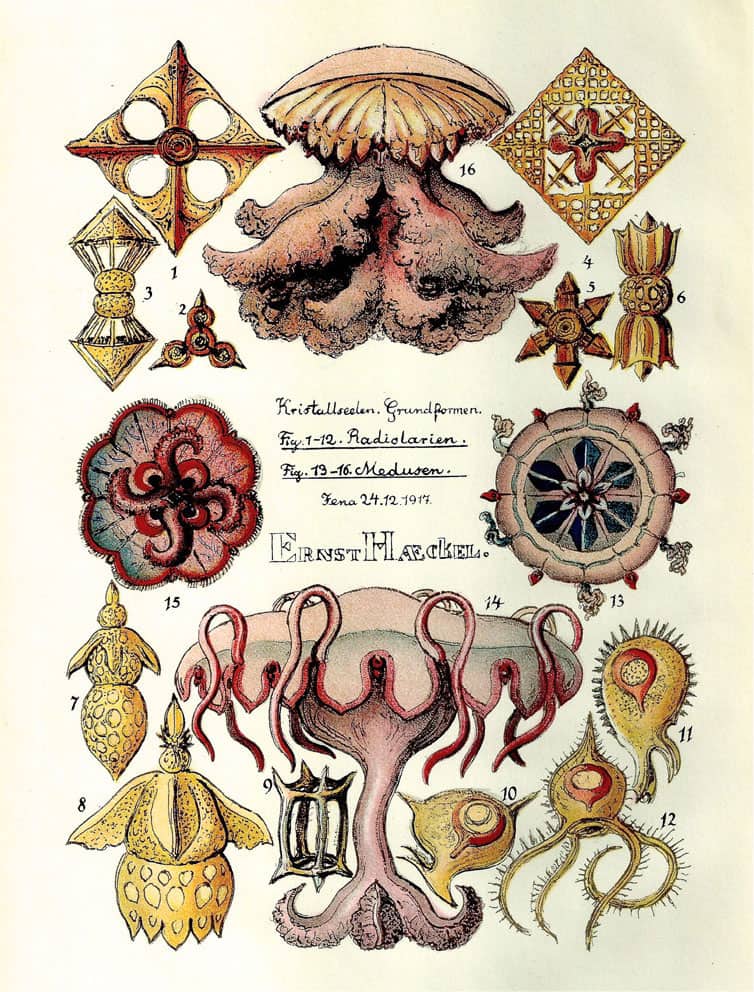
Ernst Haeckel (1834–1919), Kristallseelen, 1917; Frontispiece.
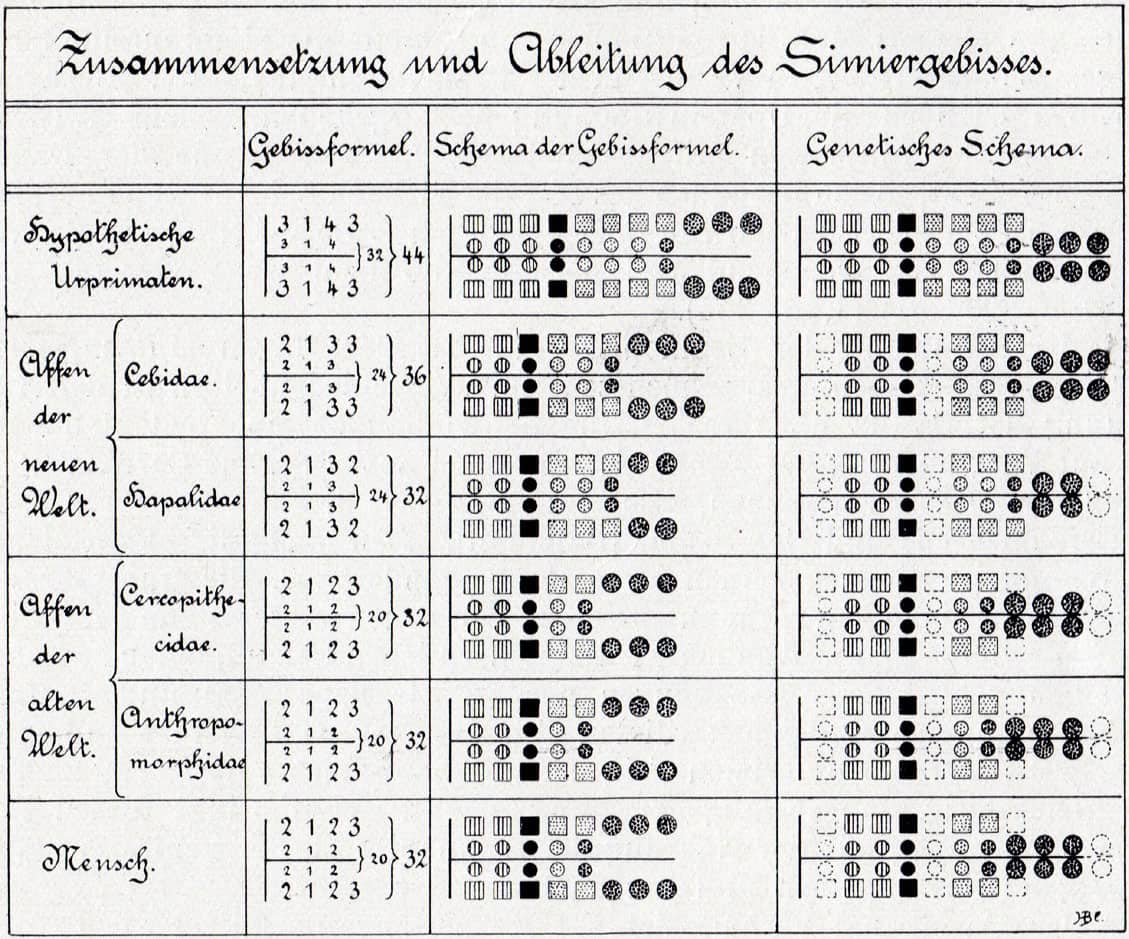
Max Weber (1852–1937), Die Säugetiere, 1927; Composition and derivation of simian dentition.
Soon the curvaceous clarity of the mid-century evolutionary trees was itself superseded by a new, more angular system of classification. Cladistics (from the Greek word for ‘branch’) is a logically simple attempt to classify species according to an algorithm-like system of simple rules, and the diagrams it yields are appropriately minimalist.
With the coming of cladistics, almost all of Linnaeus’s old taxonomic gradations were discarded – the kingdom, the genus, the phylum all gone, with only the species surviving. All were replaced with a single classificatory unit: the clade. A clade of organisms is defined as containing all the species descended from a single ancestor, and which have inherited some distinctive identifying shared characteristic that evolved in that ancestor. Mammals, for example, are thought to be a clade, because they are all descended from a single ancestral species that began to suckle its young. One advantage of cladistics is that it does not matter what data are used, and recently DNA sequences have proved just as useful as bony bumps to work out the genealogies of species.

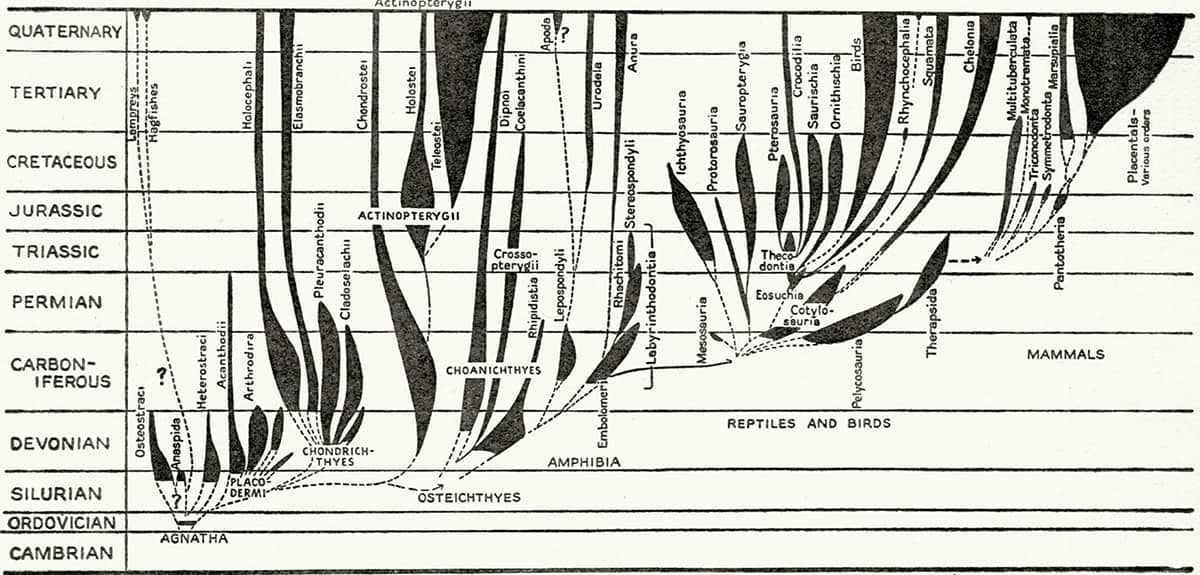
John Zachary Young (1907–1997), The Life of Vertebrates, 1950; Forms of fishes.
It really is that simple. Even though there are clades-within-clades and continuing arguments about how clades should be identified, the same simple idea governs them all. And the visual product of all this is ascetically simple trees of bifurcating straight lines, with living species at the tips of the branches, and unknown but hypothesized grand ancestors at the root. A cladogram is as simple as a drawing of a tree can be; not unlike the single figure in On the Origin of Species, in fact (see here). It is the sort of tree Piet Mondrian might have sketched if time were short.
Cladistics removed many assumptions from zoological classification. Evolution occurs in a branching tree pattern, but there is little sense of when or where or how the branchings took place. Also, there is absolutely no sense of progress towards perfection – on a cladogram, one animal is never superior to any other; it is simply another datum in the set. Some species might retain more ancestral characteristics, while others have inherited more new ones, but every outcome is value-neutral. There is no sense of evolutionary ascent in a cladogram – just time, increasing diversity, and the uncaring hand of natural selection. And every cladistic tree represents just a transient hypothesis that fits the available data for a while, until new data appear to dismantle and replace it.
Pierre-Paul Grassé (1895–1985), Traité de Zoologie, Tome XIII: Agnathes et Poissons, 1958; Simopteraspis primaeva.
The conceptual purity of the cladogram gives it a stark, angular beauty that appeals to the modern eye. Its simplicity gives it flexibility of form and arrangement, as in Carol Ballenger’s Tree of Life: Homage to Darwin shown here. Cladograms do not carry the visual gravitas of the evolutionary trees of the nineteenth century, but today’s zoologist cannot help feeling that their lightness signifies genuine scientific clarity.
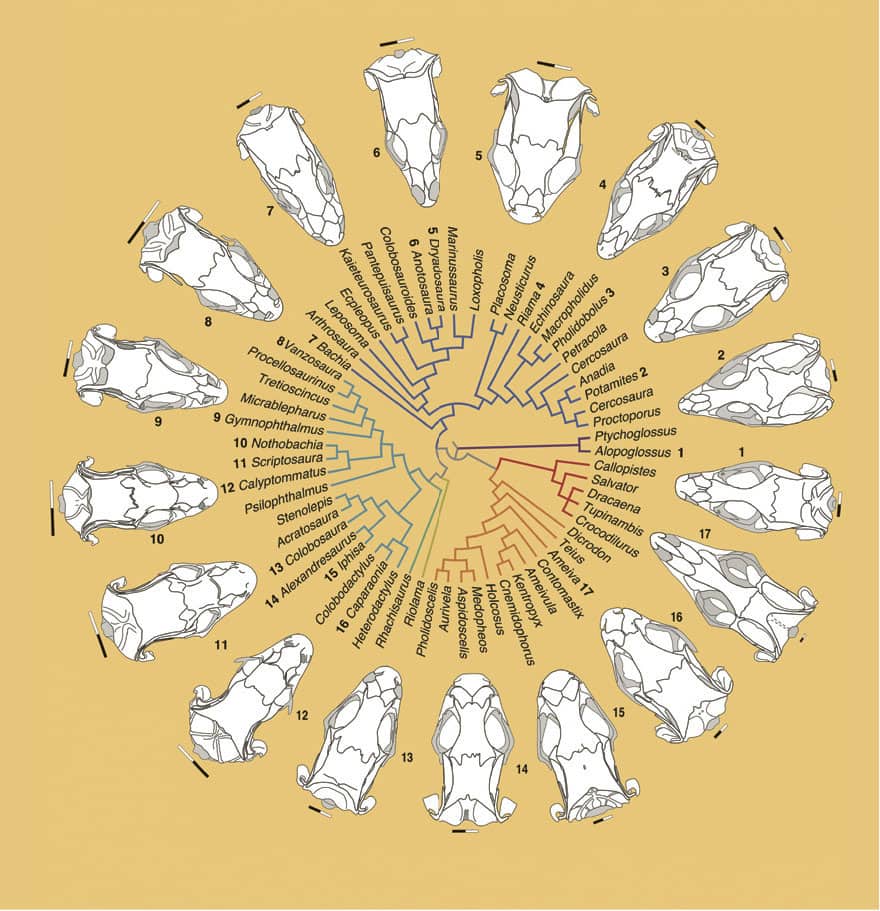
Cristian Hernandez Morales and others, Phylogenetic wheel showing variation of skull morphology among the Gymphothalmoideagenera (squamates), 2019, Anatomical Record vol. 302; Front cover.
In a further shrugging-off of biological assumptions, many contemporary evolutionary trees are not actually tree-shaped at all. Going one step beyond cladistics, ‘phenetics’ does not claim to establish evolutionary links between animals at all. Instead, it seeks merely to quantify similarity between species, often by a computer-enacted mathematical process. In an echo of the early-nineteenth-century zoologists who described patterns of deliberately vague ‘affinity’ between creatures rather than relatedness, the new forms of animal classification seem to convey only a tacit hope that similarity may one day turn out to be a sign of evolutionary relatedness.
Instead of a neatly rooted tree, recent modes of animal classification are often used to produce a network of lines, whose lengths represent the calculated dissimilarities between the species connected by those lines. The result is an irregular, rootless branching form with individual species jutting from its periphery. However, these apparently chaotic explosions of species interrelations seem to make zoologists want to think big, and many have tried to create radiating constructions connecting all known life on Earth. These giant new trees are usually based on genetic information, as DNA is one of the few things that all living organisms share. And in some of these trees there is a diminutive sprig in one corner with three tiny buds – Homo, Saccharomyces and Zea. Finally, we proud humans have been put in our place, relegated to a minuscule outpost on a sprawling web of organisms, along with our close cousins: yeast and sweetcorn.

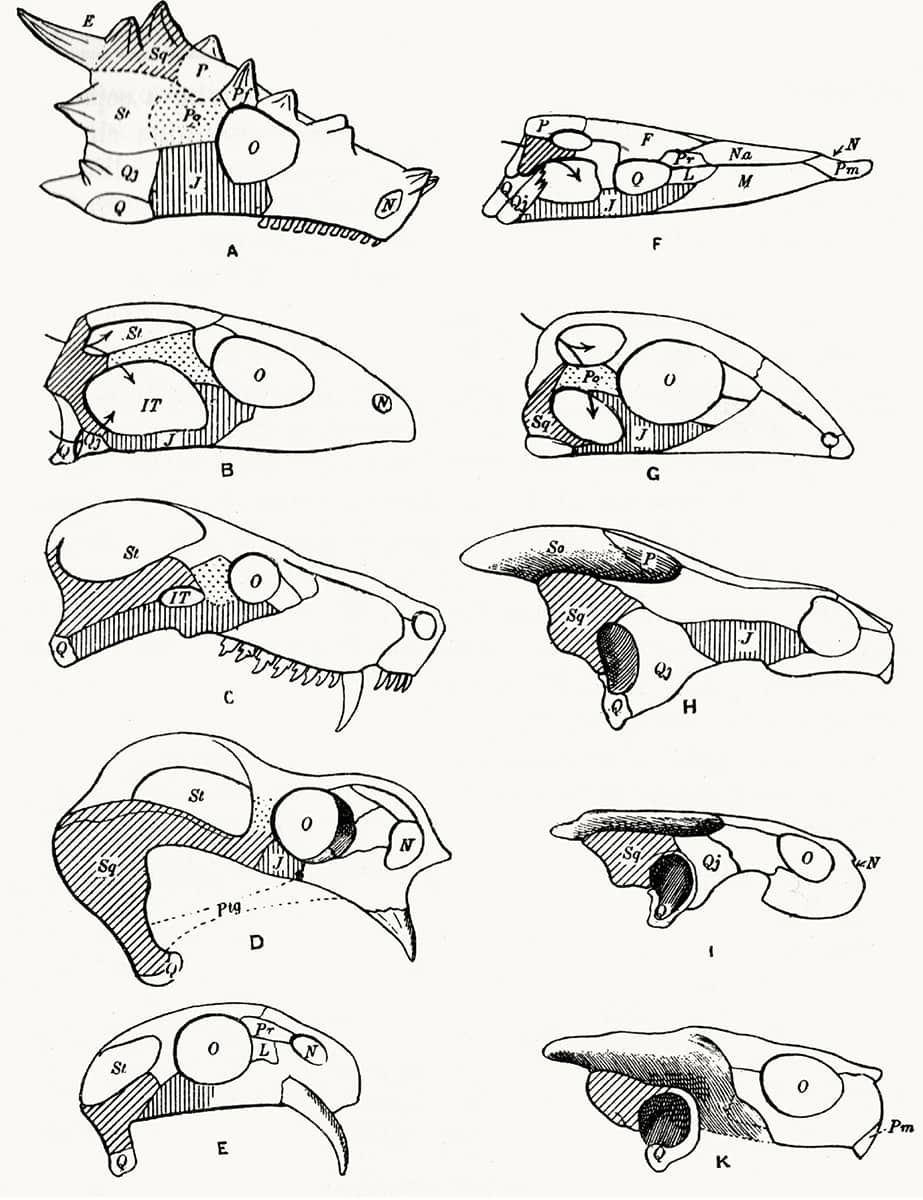
Hans Friedrich Gadow (1855–1928), Amphibia and Reptiles, 1901; Physical features of the world affecting the geographical distribution of amphibia and reptiles (above); Skulls showing especially the composition of the bony arches of the orbito-temporal region (below).
Originally from Pomerania, and working mainly in Cambridge, Gadow’s zoological interests were wide, but his survey of amphibians and reptiles is one of his most widely read works. The map above shows the global distribution of the two groups – more restricted than that of mammals and birds, due to their greater dependence on environmental heat energy, and also moisture in the case of amphibians. The image opposite demonstrates the importance of windows in the side of the skull – known as ‘fenestrae’ – in classical taxonomy of land vertebrates.
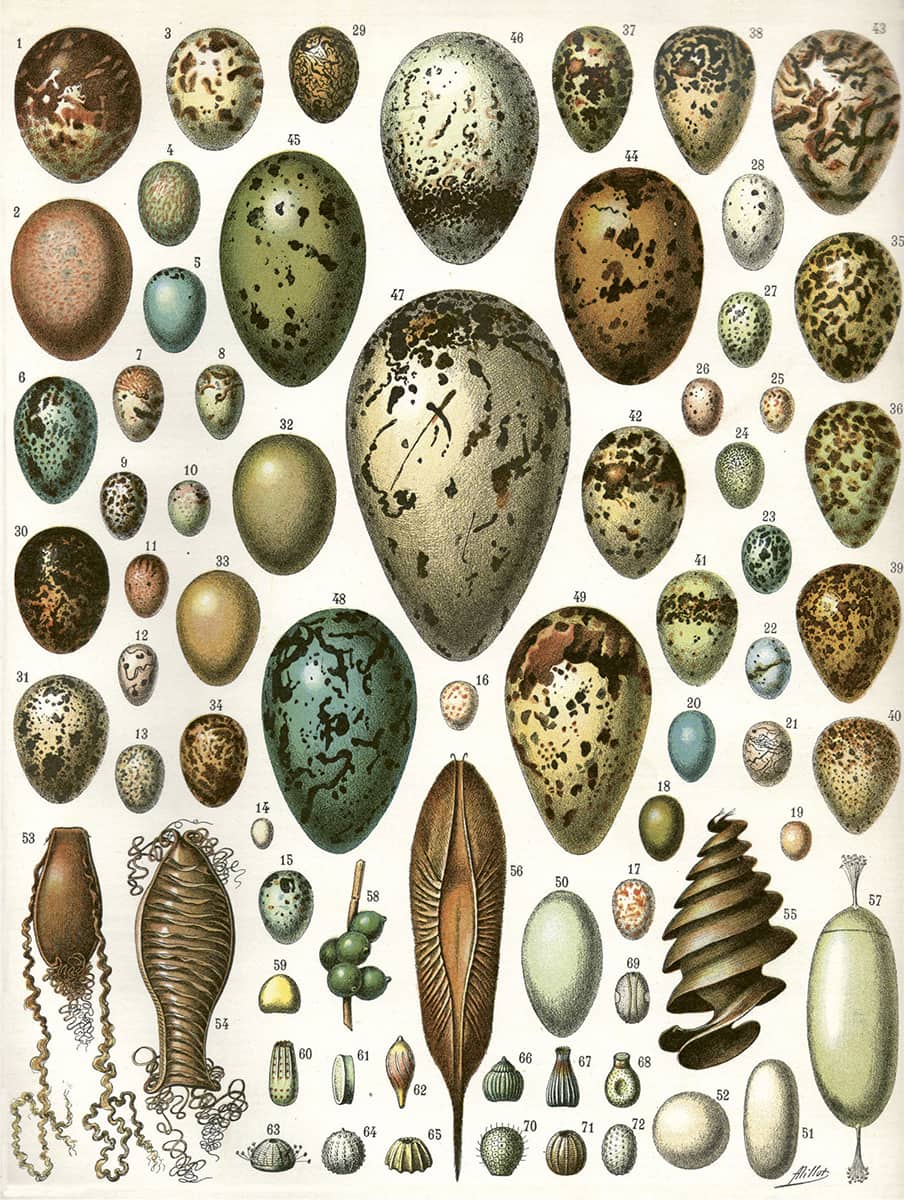
Adolphe Millot (1857–1921); Le Nouveau Larousse Illustré, 1897–1904; Oeufs.
The egg has been a biological, and indeed philosophical, conundrum since antiquity – yet often a beautiful one, as here. Unlike the microscopic oocytes of mammals, most organisms produce large eggs, which contain the nutrients required to give offspring a good start in life. Even the ova of flowering plants are now known to be the direct equivalent of the animal egg.
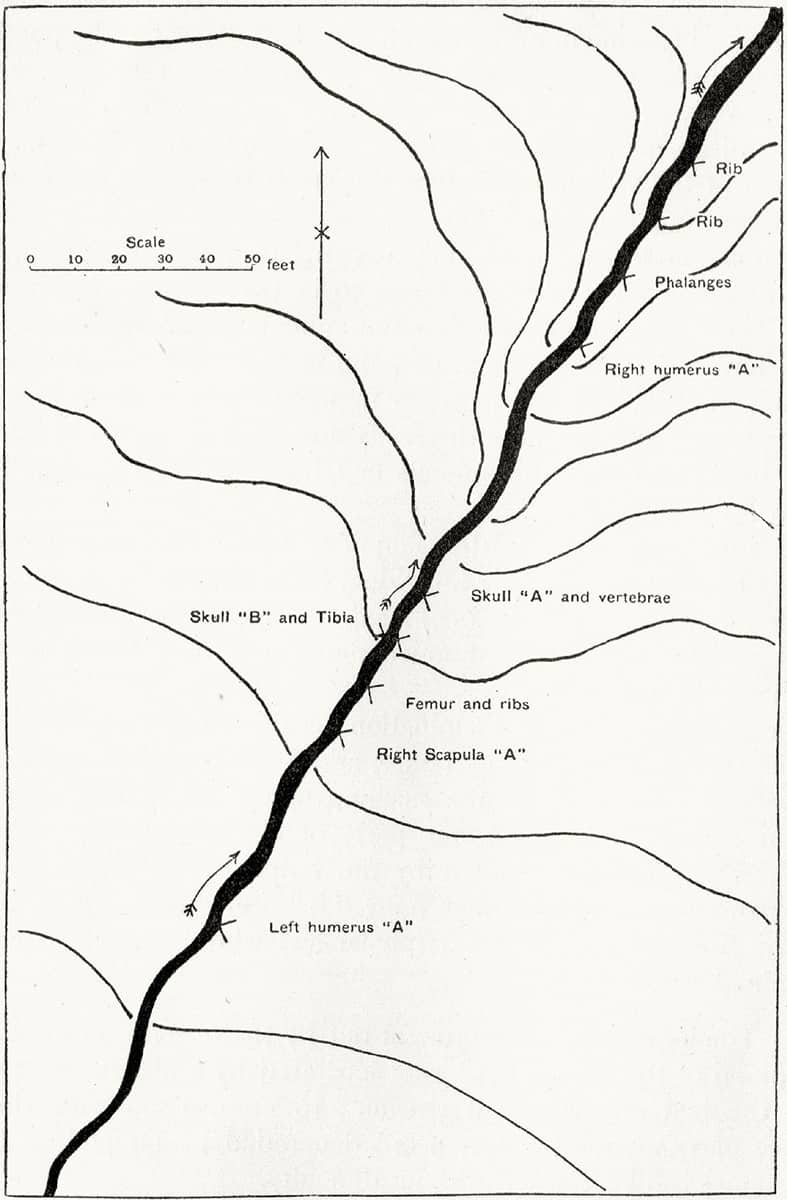
Wynfrid Duckworth (1870–1956), Studies from the Anthropological Laboratory, The Anatomy School, Cambridge, 1904; The dispersive power of running water on skeletons.
Fossilization is a selective process. Only a tiny fraction of animal remains becomes fossilized, and fossils’ locations depend on environmental conditions. This image is a schematic map of a river – surface water is one of the main factors controlling the pre-fossilization transport of bones, and remarkable concentrations of a single bone type from a single species may accumulate at particular locations in a river’s flow.
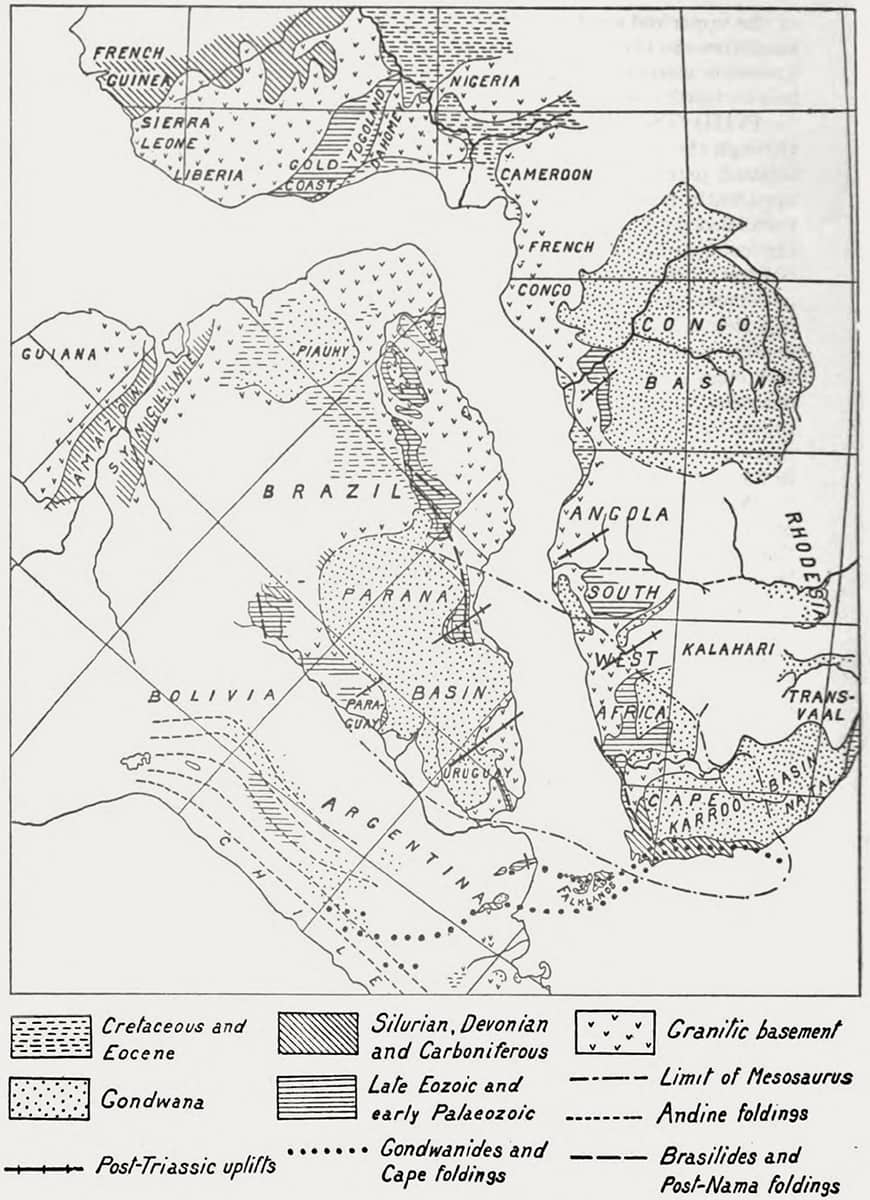
Alexander Logie du Toit (1878–1948), A Geological Comparison of South America with South Africa, 1927; Suggested continental restoration under the displacement hypothesis.
In the twentieth century, biology was once again united with geology, with the realization that continental drift is a major external influence affecting animal evolution and fossil preservation. Previous thinkers had noted the strange complementarity between some continental coasts that face each other across the width of an ocean, but in 1912 it was the German geophysicist Alfred Wegener who published the first coherent description of continental drift. Over subsequent decades the gradual realization that the Earth’s crust consists of many plates in a state of continual movement, separation and collision was as radical to geologists as the realization of animal evolution must have been for biologists a century earlier.
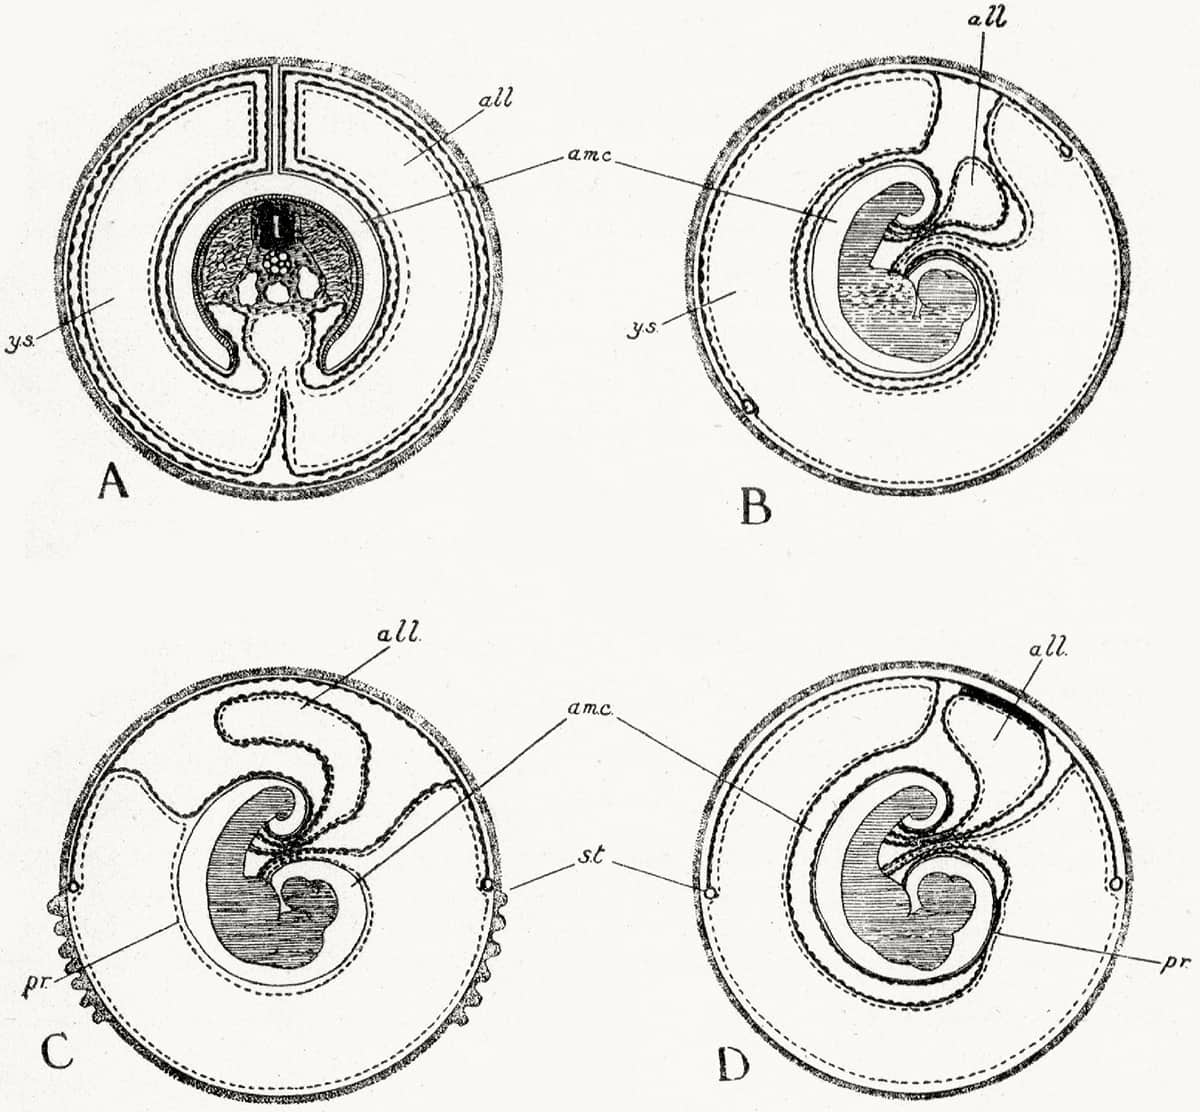
John Jenkinson (1871–1915), Vertebrate Embryology, 1913; Foetal membranes of monotremes (A) and three marsupials (B–D).
Vertebrates are classifiable according to their foetal membranes – the cellular linings that surround the developing embryo in the egg or in utero. Reptiles, birds and mammals, for example, differ from amphibians and fish in having four membranes. These membranes were also important in supporting the transition from egg-laying to live birth during the evolution of mammals – hence the analysis of monotremes and marsupials here.
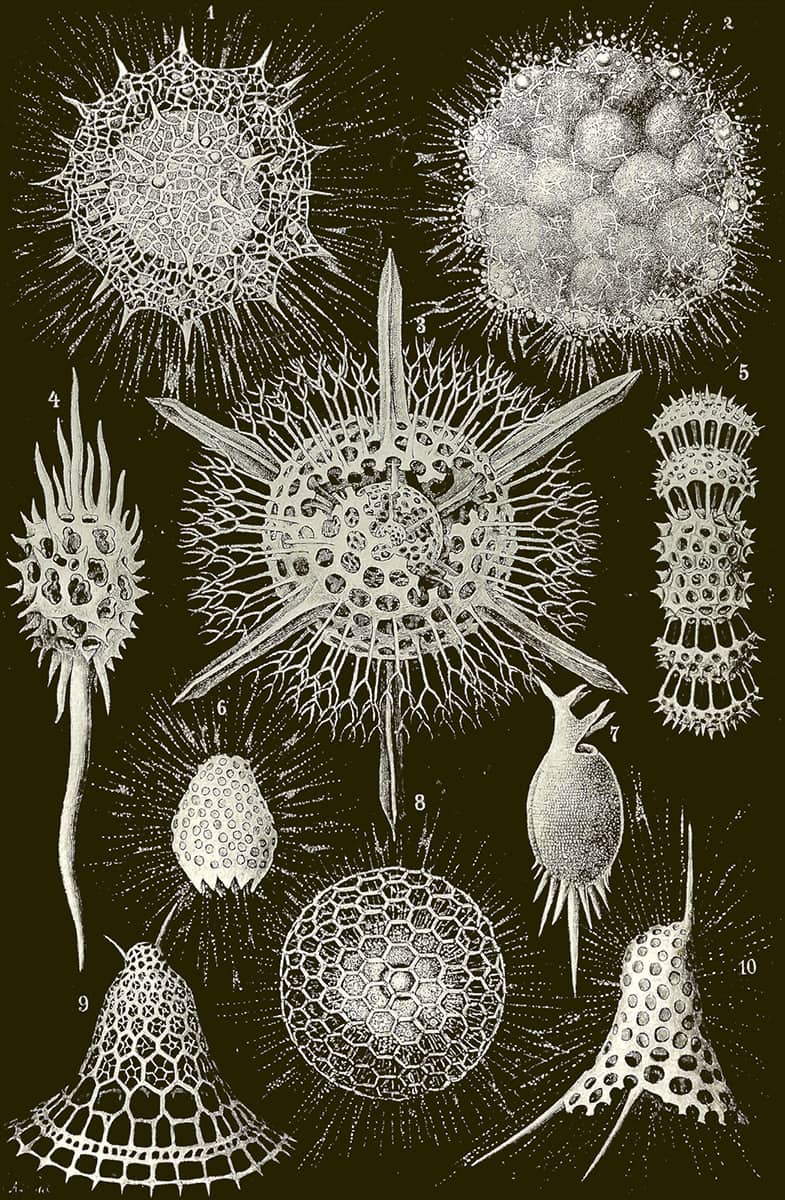
Ernst Haeckel (1834–1919), Kristallseelen, 1917; Kristallinische Arbeiten der Radiolarien-Seele.
Haeckel continued to publish actively well into the twentieth century, although his writing became more obscure and esoteric – he even proposed his own new religion. Whatever one thinks of the written content of ‘Crystal Souls: Studies of Inorganic Life’, its images of the crystalline skeletons of single-celled sea creatures are as beautiful as anything in Haeckel’s earlier works.
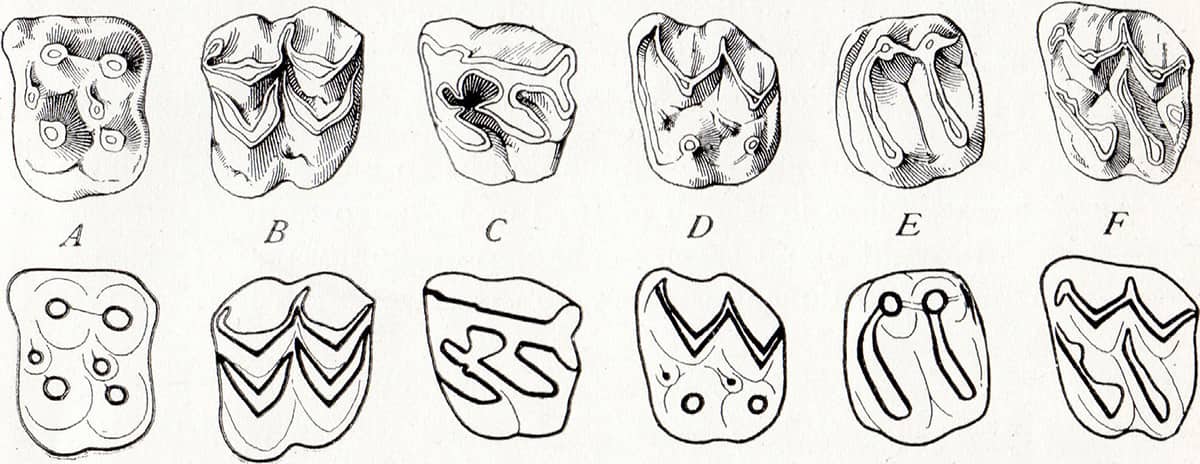
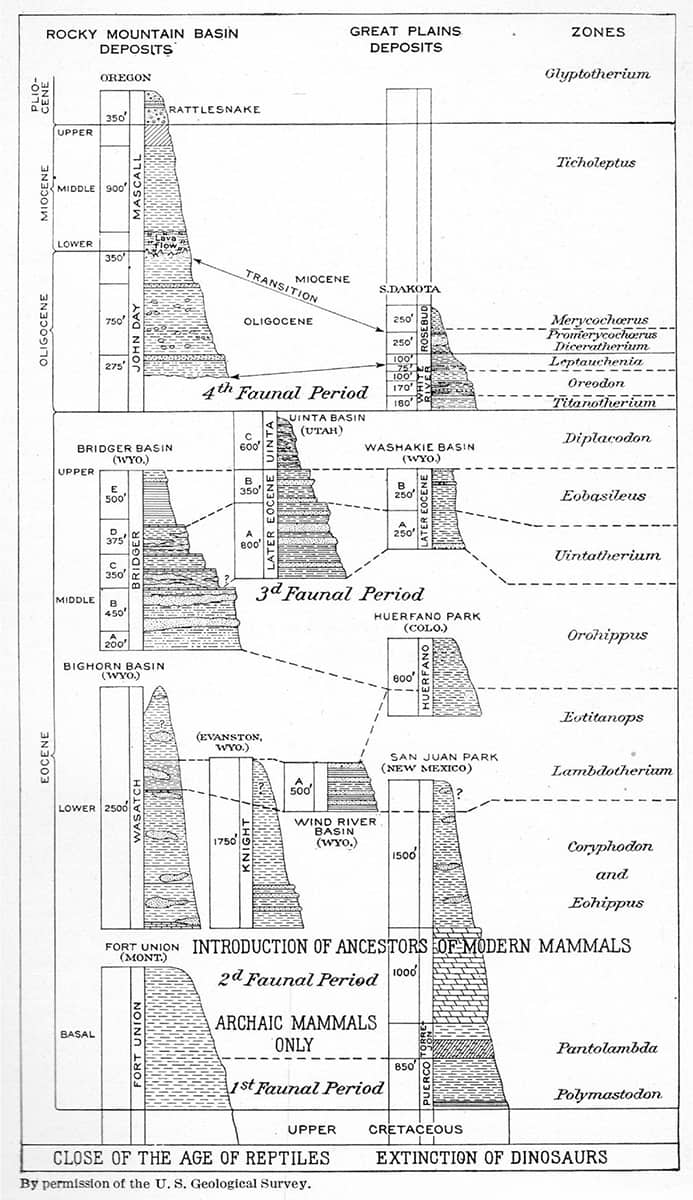
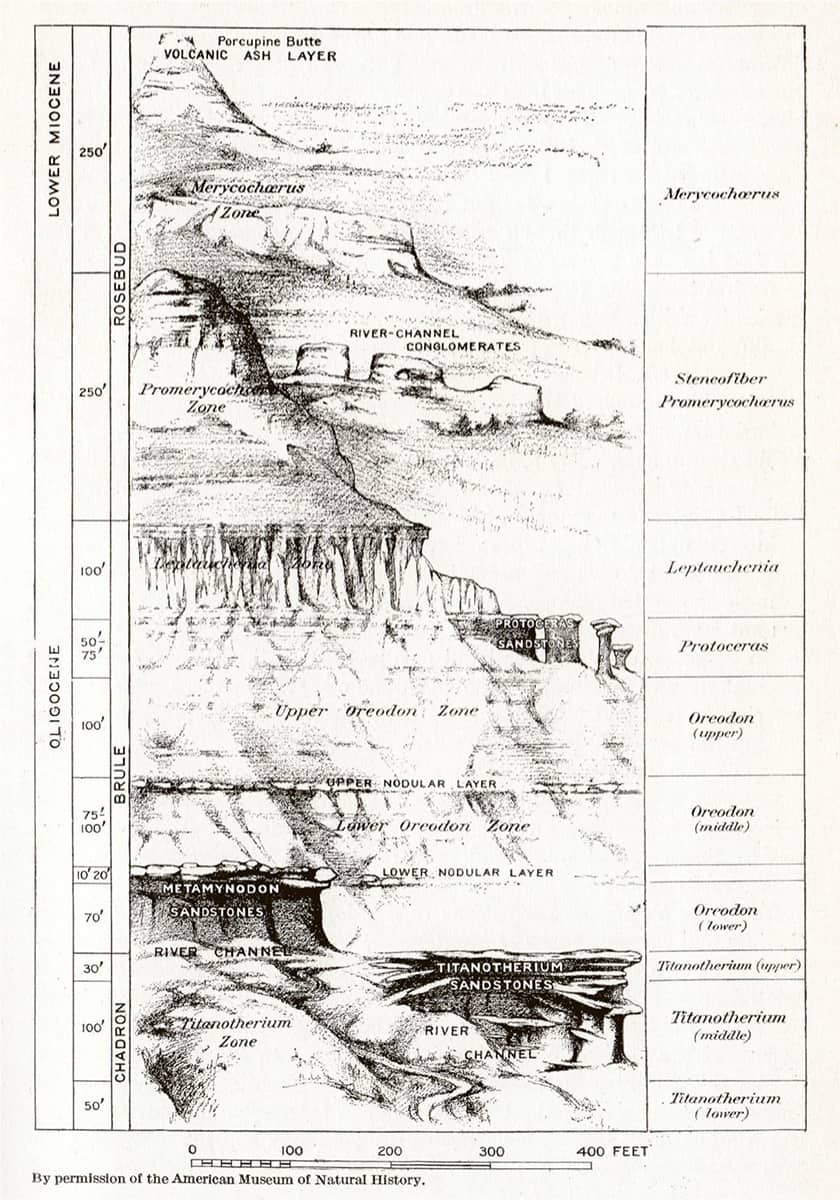
Henry Fairfield Osborn (1857–1935), The Age of Mammals in Europe, Asia and North America, 1921; Types of molar or grinding teeth (above); Panoramic view of the Oligocene and Miocene exposure on the south side of the White River, South Dakota (below).
A long-serving president of the American Museum of Natural History, Osborn participated in several stratigraphical and fossil surveys of the American West – a region that, as a result, has one of the best characterized faunal timelines in the world.
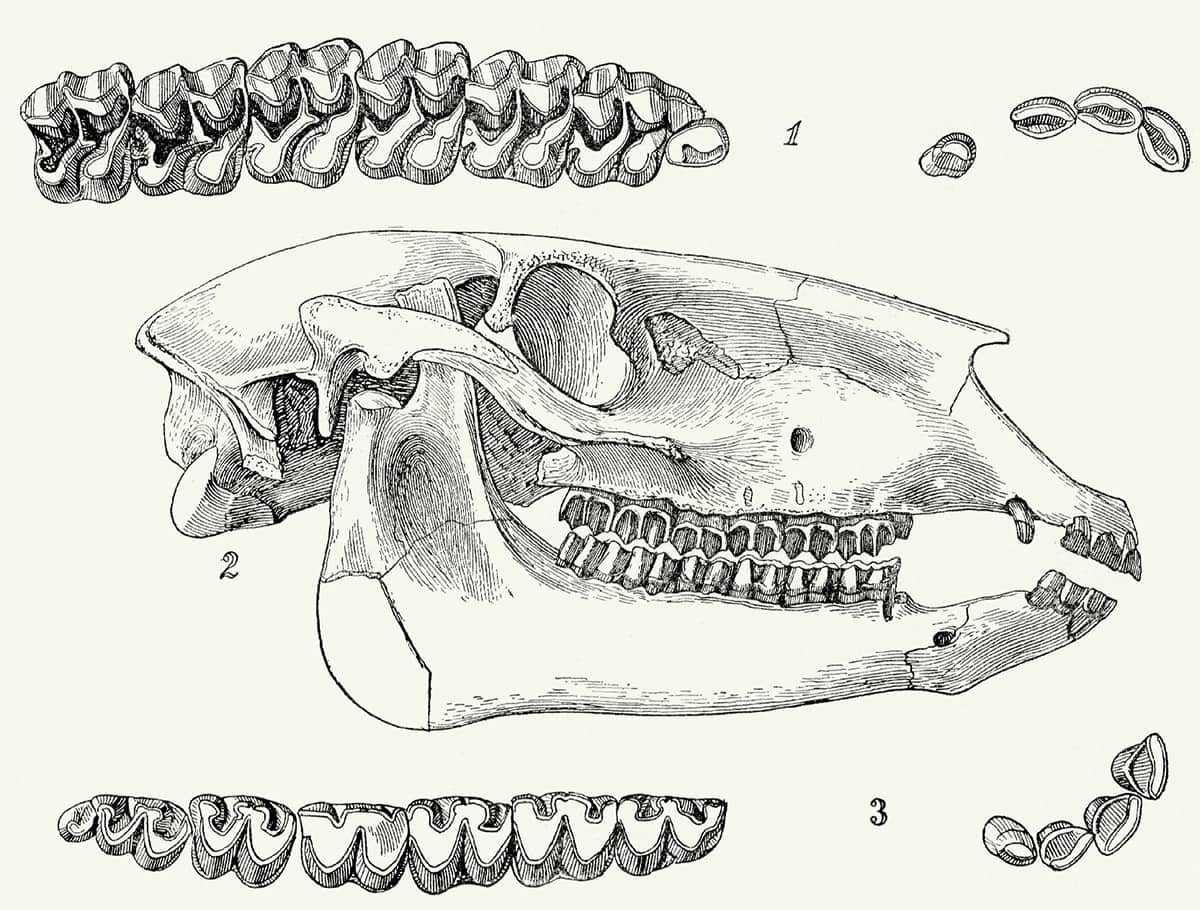
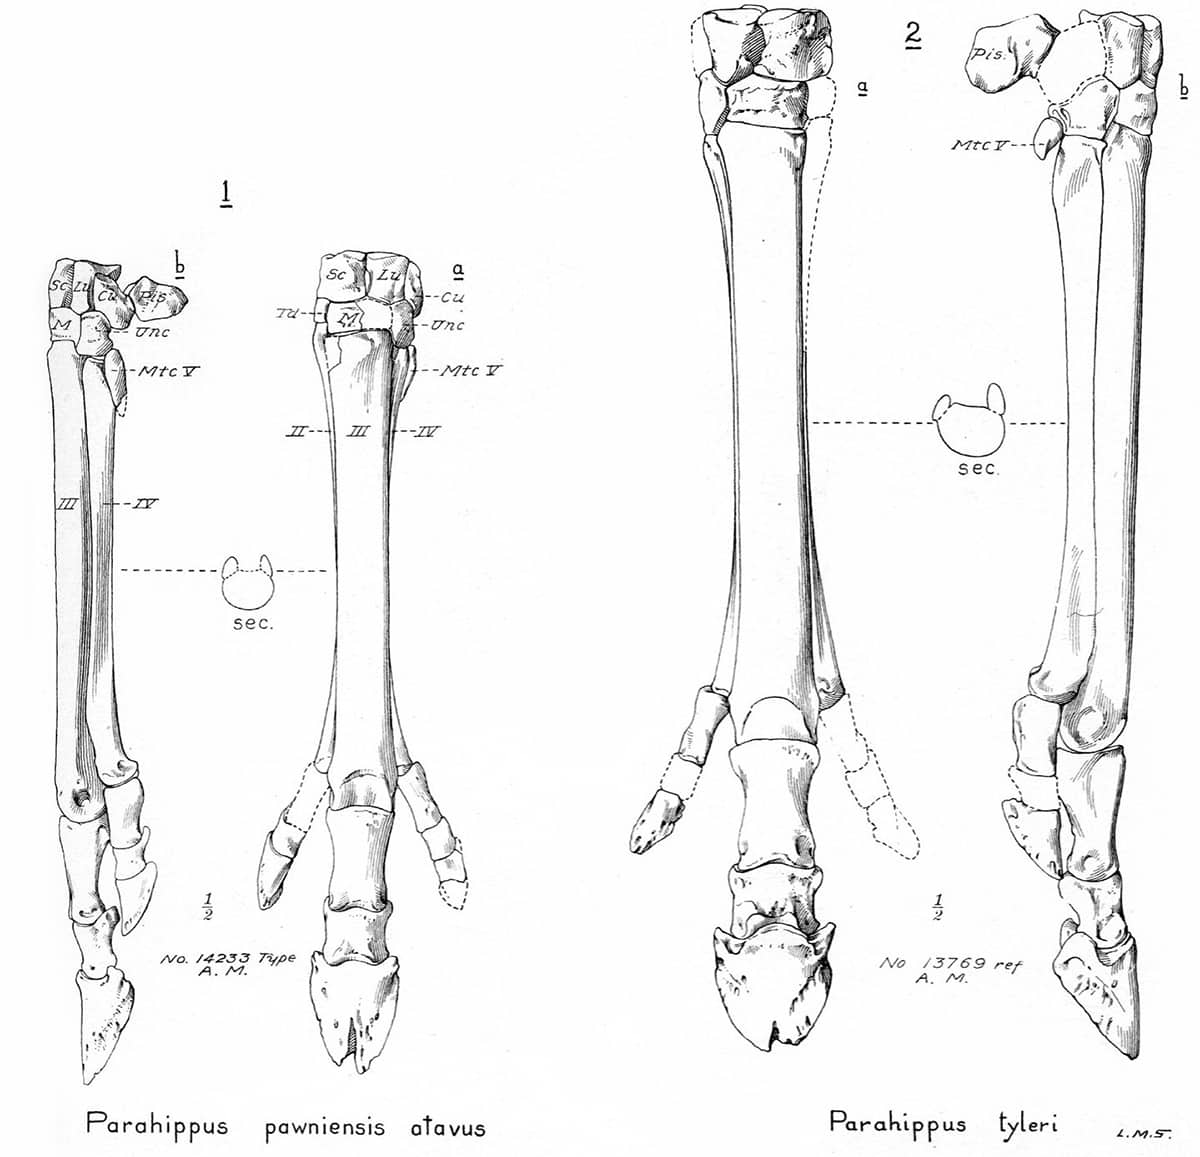
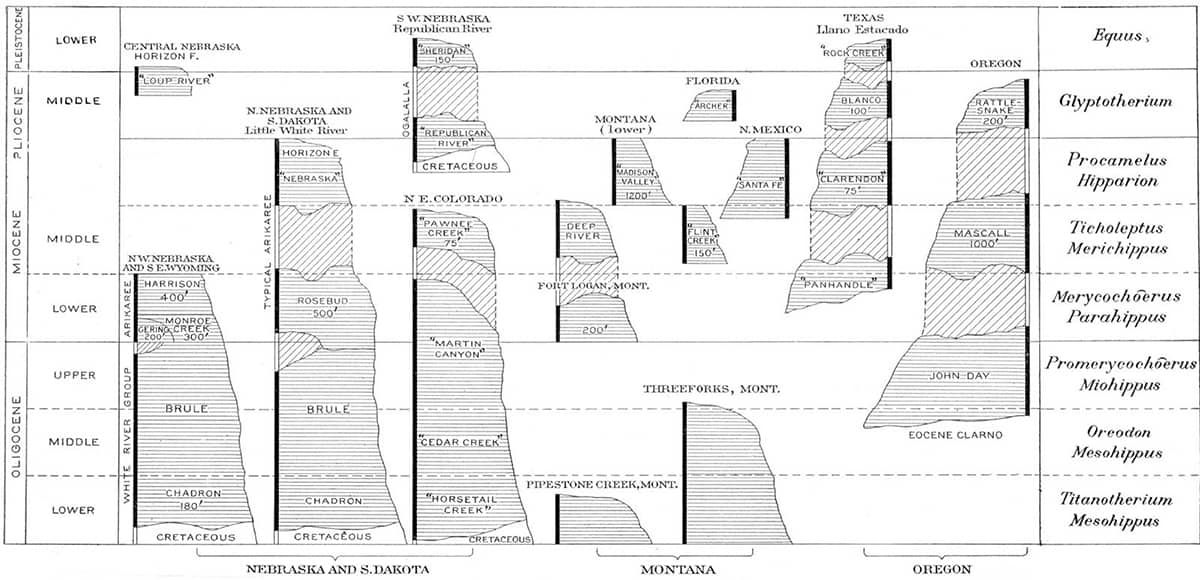
Henry Fairfield Osborn (1857–1935), Equidae of the Oligocene, Miocene and Pliocene of North America, 1918; Skull and dentition of type of Parahippus nebrascensis (above); The forefoot of Parahippus (below); General correlation of the fossil-bearing horizons of the western plains district and of Oregon (bottom).
Horses have provided perhaps the most complete fossil record of any animal lineage, and palaeontologists have been able to trace not only their transition from small, dentally unspecialized, multi-toed forms to the modern Equus, but also the appearance, migration and demise of now-extinct branches of the equine evolutionary tree.

Lothrop Stoddard (1883–1950), The Rising Tide of Color Against White World-Supremacy, 1920; Categories of white world-supremacy.
Although humans are subject to natural selective forces, the science of evolutionary biology has often been applied incautiously to our own species. Stoddard was an American academic whose influential ideas fed into prevailing attitudes to racial purity, and eventually Nazi concepts of the Untermenschen. This map, for example, looks superficially similar to Alfred Russel Wallace’s biogeographical maps (see here and here), but the key includes categories such as ‘areas of white political control over colored populations’. The regions of ‘colored populations independent of white political control’, mainly China and Japan, are coloured yellow.
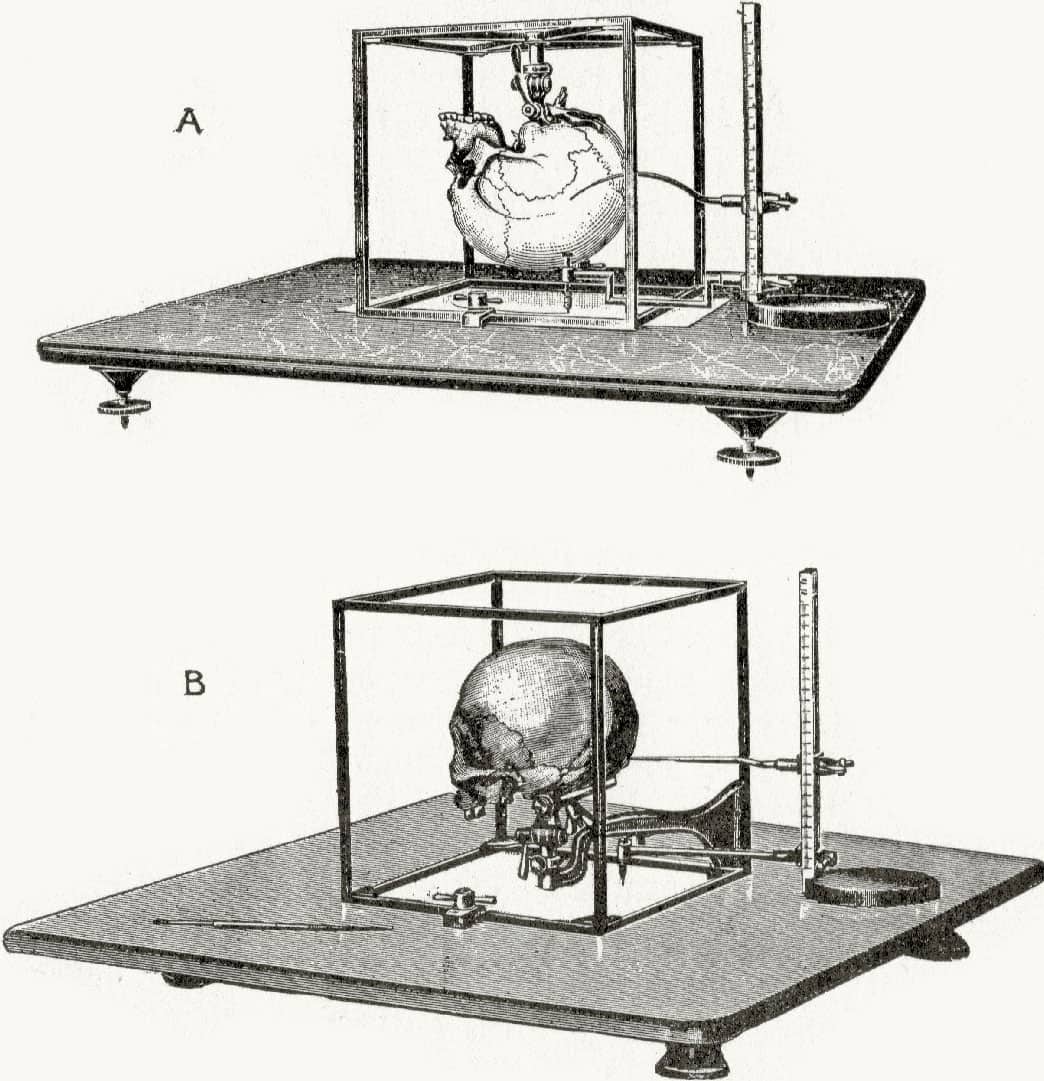
Harris Hawthorne Wilder (1864–1928), A Laboratory Manual of Anthropometry, 1921; Cubic craniophore.
Anthropometry, ‘measuring man’, may seem an innocuous discipline, but it was often conducted with dark intentions. As would be expected for a species with such a large geographical range, humans are divided into a number of local populations, each with its own biological adaptations to its local environment. Some of these adaptations are anatomical, such as variations in skull morphology, but for many decades these differences were viewed as evidence of the superiority and inferiority of populations derived from certain parts of the world.
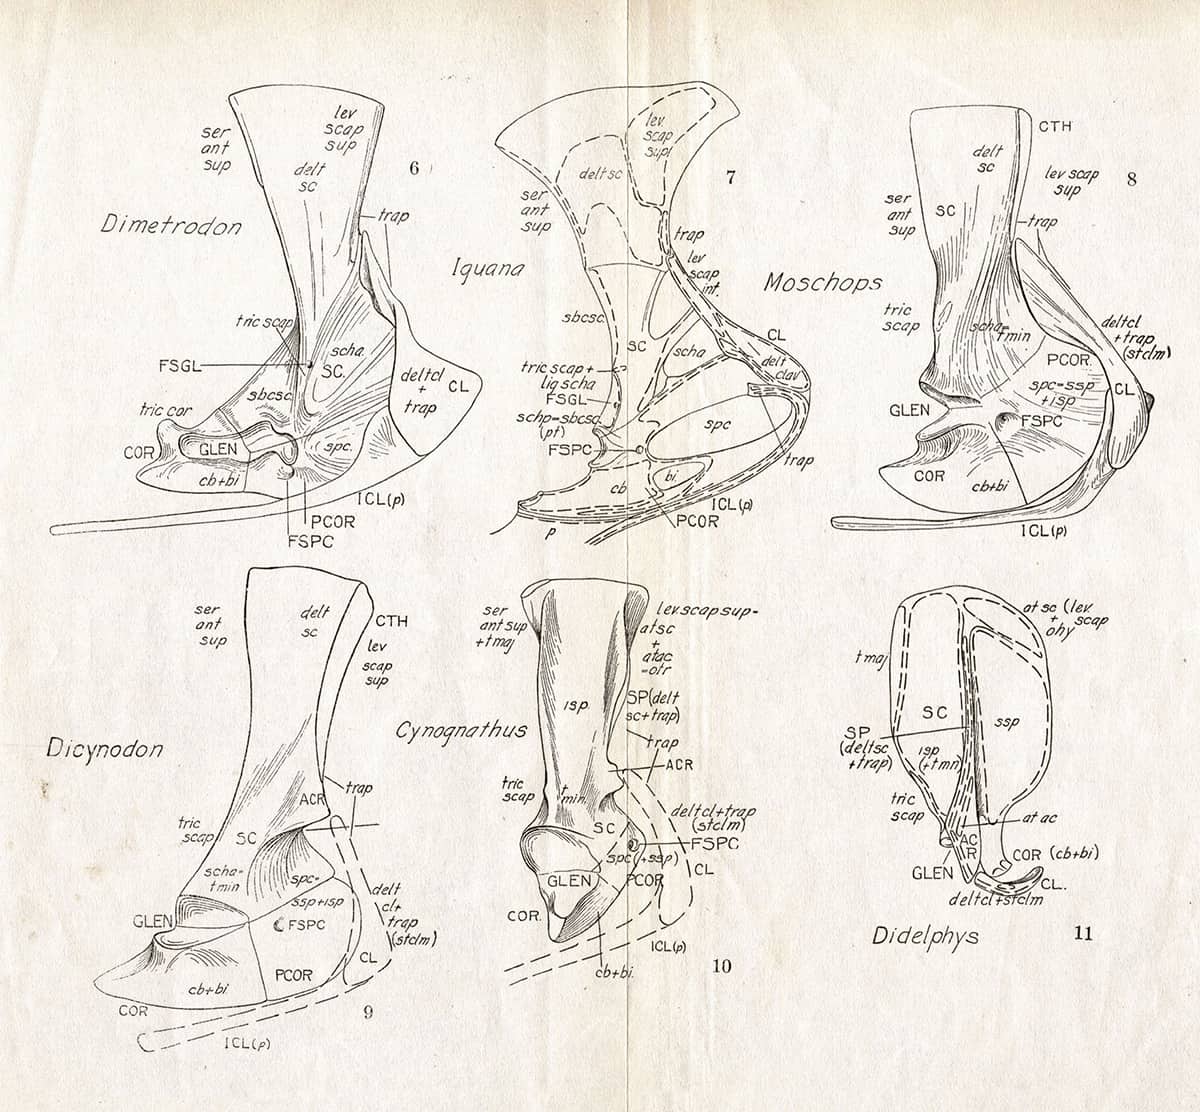
Alfred Sherwood Romer (1894–1973), The Locomotor Apparatus of Certain Primitive and Mammal-Like Reptiles, 1922; Forelimb girdles.
Considerable rearrangement of the locomotor system took place in the evolutionary lineage leading to mammals. In this series, the forelimb girdle (shoulder blade, collarbone and associated structures) is compared in Iguana, the modern opossum Didelphys, and four extinct species thought to be close to the lineage leading to modern mammals. The girdle bones are seen becoming more gracile, and the attachment of muscles shifts upwards.
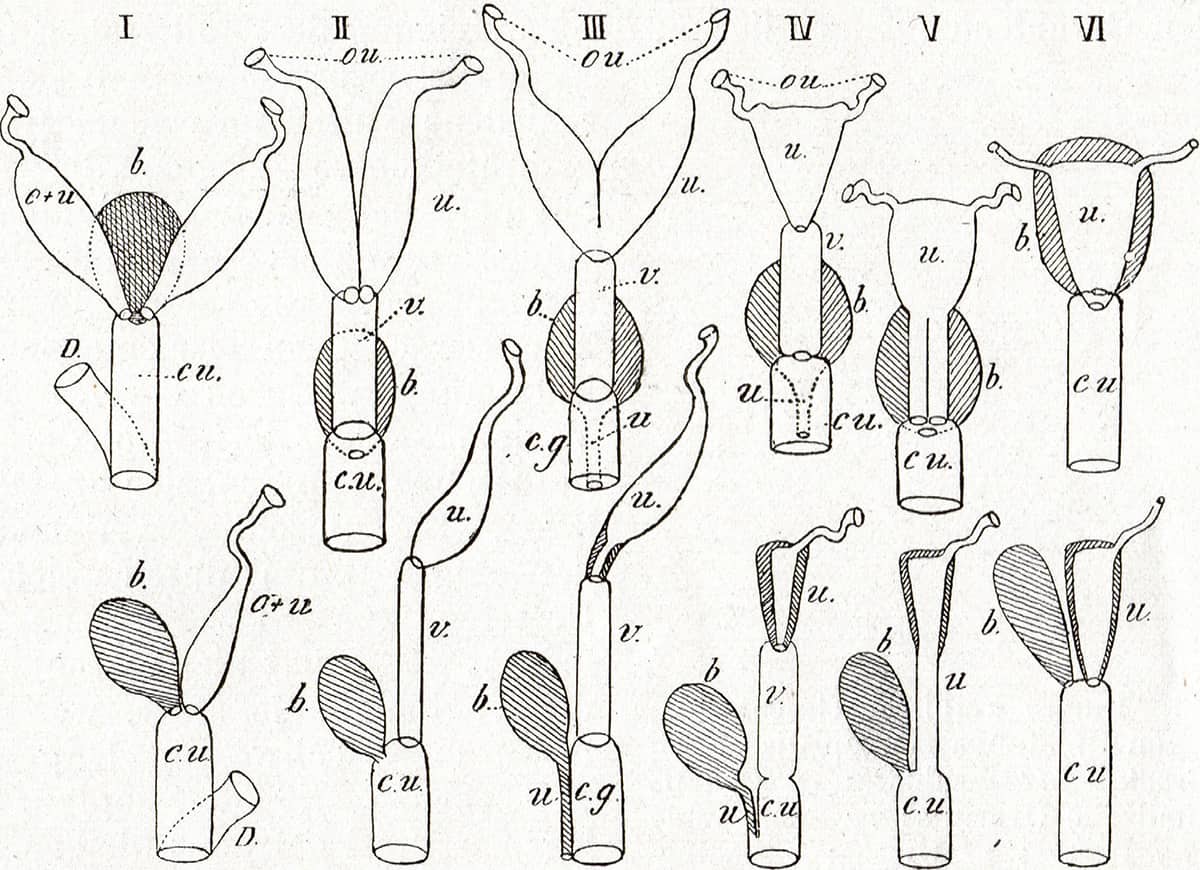
Max Weber (1852–1937), Die Säugetiere, 1927; Scheme of the arrangement of the uterus.
The reproductive system exhibits dramatic variations between species, and nowhere is this more true than in marsupials. Although some species possess single uteri and cervices as humans do (IV upper row), others have uteri which are partially (III) or fully (I, II) divided into two, or have dual cervices (V). In addition, in all permutations, one fallopian tube may be absent (lower row).
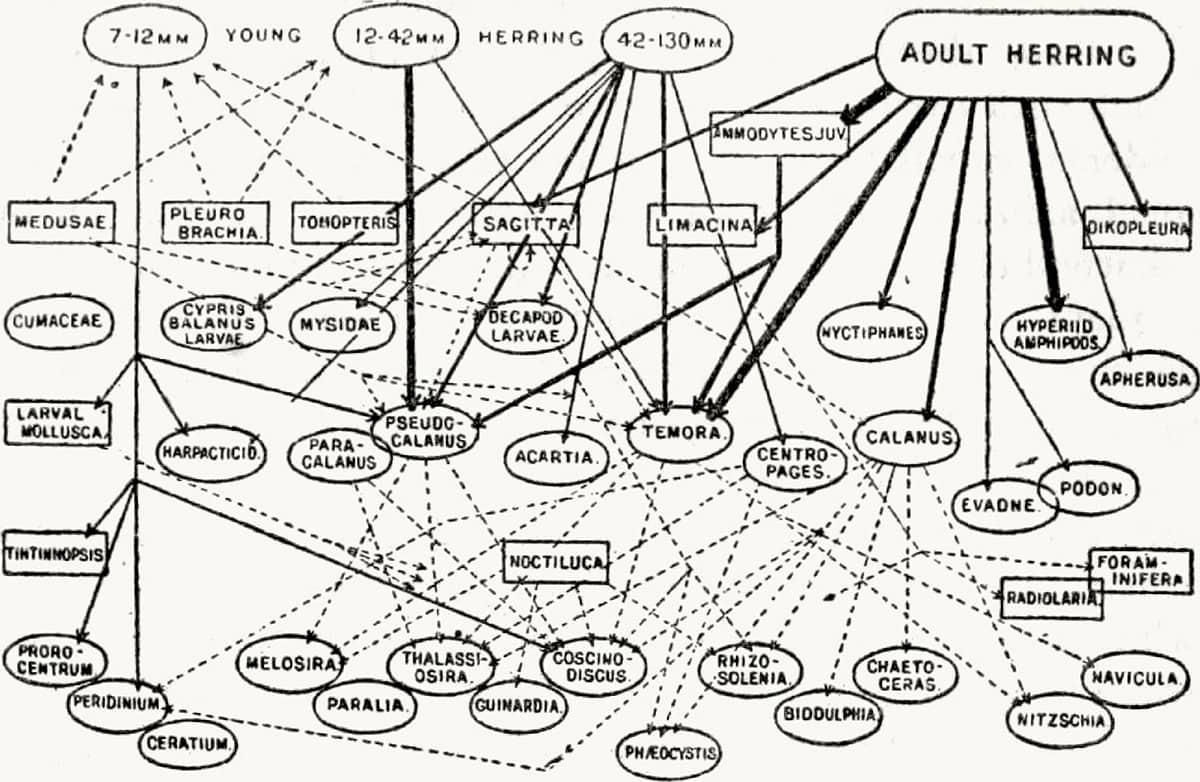
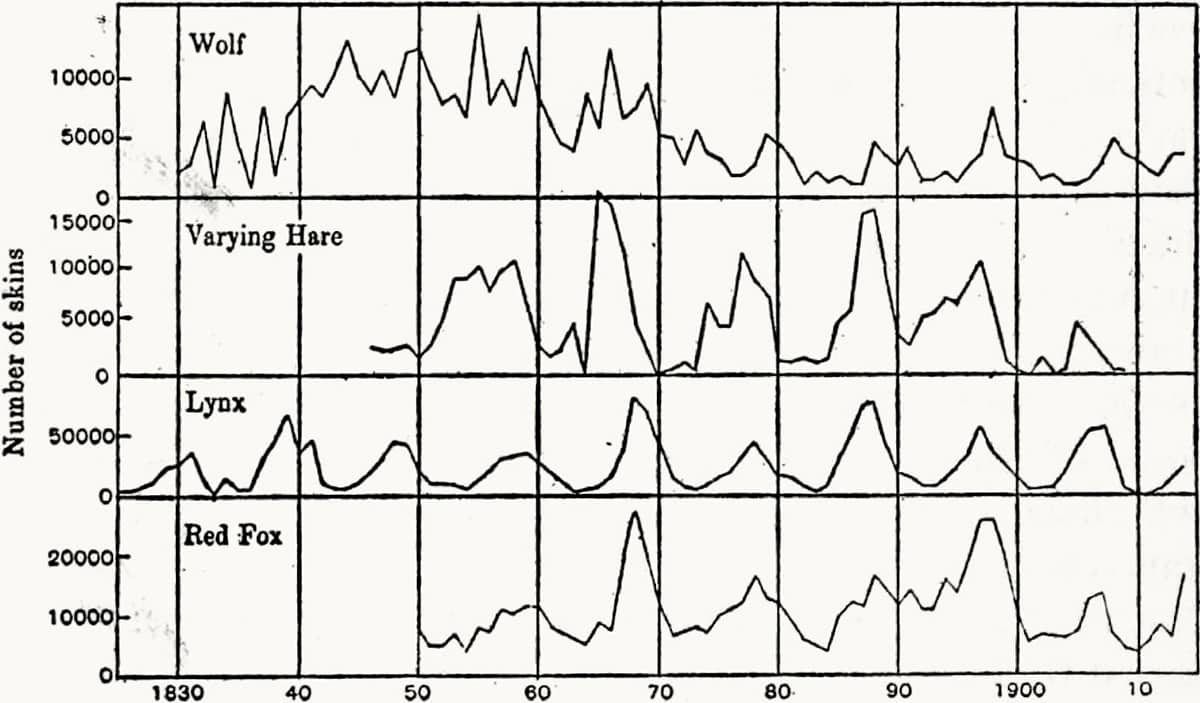
Charles Elton (1900–1991), Animal Ecology, 1927; The general food relations of the herring to other members of the North Sea plankton community (above); Fluctuations in the numbers of Canadian mammals (below); Part of an animal community in Canada (bottom).
‘Ecology’, a word coined by Ernst Haeckel (see here), is the study of animals’ interactions with each other and their environment, and was a new form of zoological study largely developed in the twentieth century. The English ecologist Charles Elton focused particularly on the flow of nutrients through environments, and developed the modern concepts of food-chains and food-pyramids.

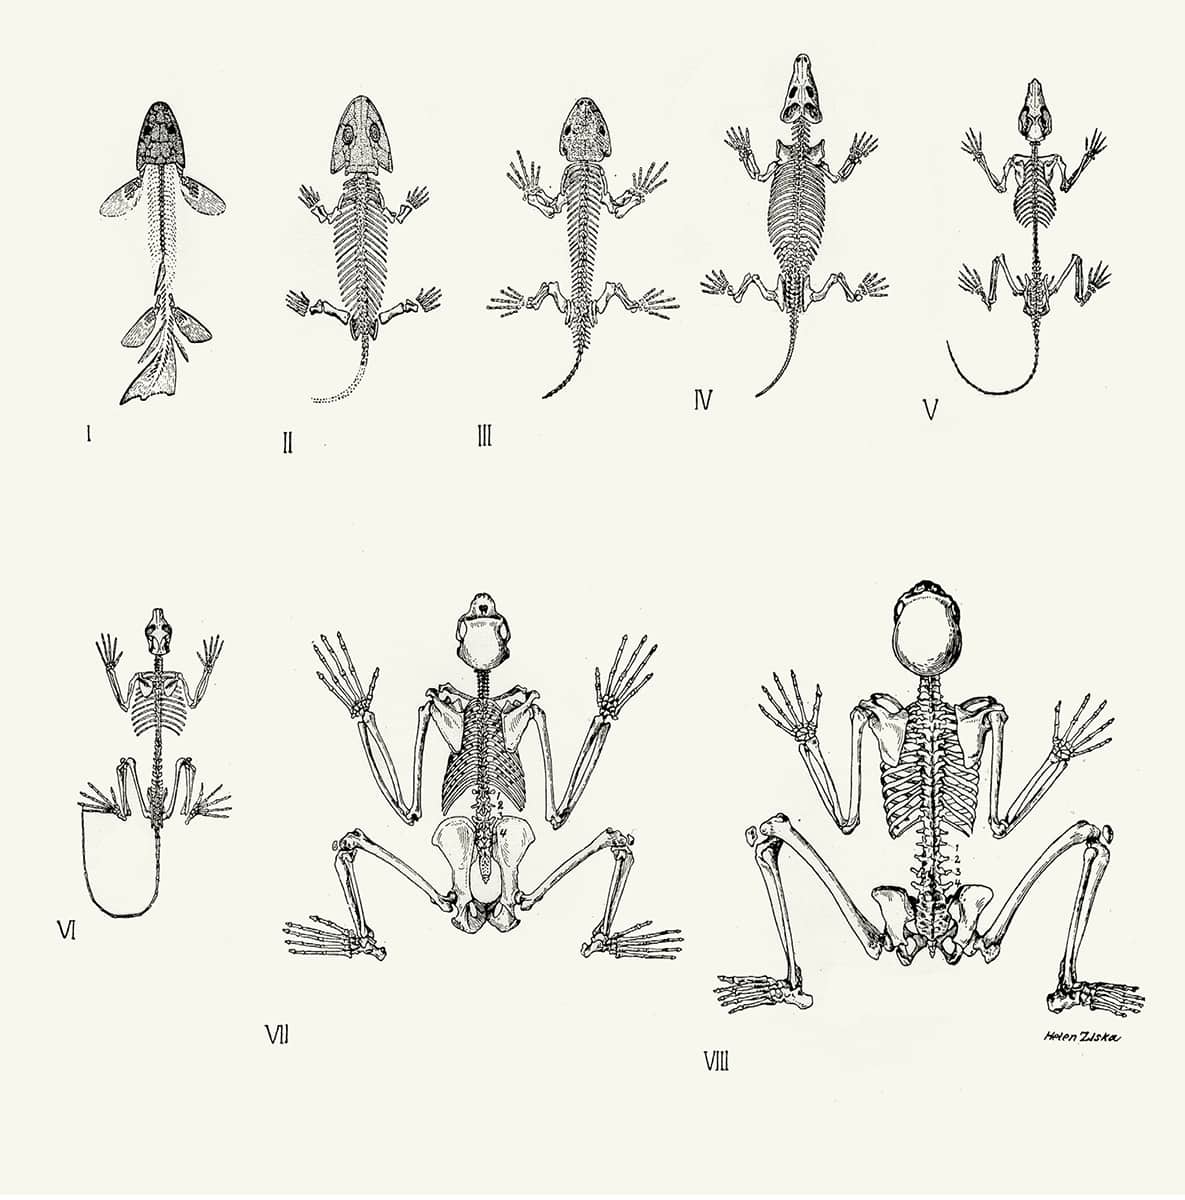
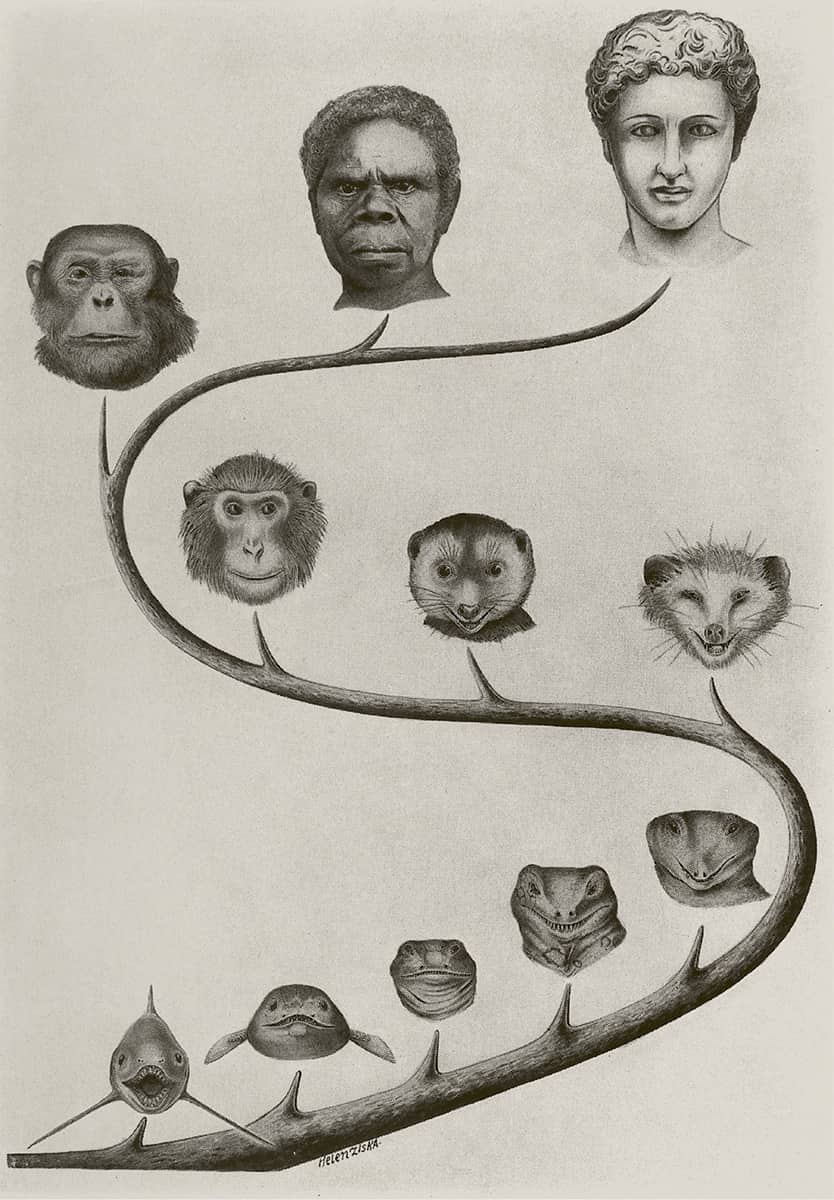
William King Gregory (1876–1970), The Upright Posture of Man (illustration from a double page spread); Our Face from Fish to Man, 1928.
William Gregory was an American zoologist with particular interests in the evolution of human bipedalism, and mammalian dentition and facial structure. He was a great popularizer of science, yet his evolutionary ideas contain a sense of ‘progress towards perfection’ not borne out by later ideas, and which led, as here, to racist overtones.
Edwin Goodrich
Organization of the Vertebrate Body
TIMELINE
1868: Edwin Goodrich born
1905: Elected Fellow of the Royal Society
1921: Becomes Professor of Zoology at Oxford
1930: Studies on the Structure and Development of Vertebrates published
1946: Edwin Goodrich dies
The Oxford academic Edwin Goodrich worked at a nexus in biology, when anatomy and embryology were well-established sciences, but had not yet been changed forever by advances in genetics and molecular biology.
Goodrich travelled the world in his research, focusing especially on the organization of the body plan of diverse marine creatures. He was particularly interested in the various tubes, secretory, excretory and reproductive, that connect the inside of animals to the outside world – and the sometimes complex equivalences between these structures in different groups.
Goodrich painstakingly developed probably the most coherent pre-molecular scheme of how the vertebrate body plan evolved and how it develops in the embryo. In particular, he was able to account for gaps in the fossil record, and cope with suspicions that the evolution of the vertebrate body has not followed a satisfyingly neat path.
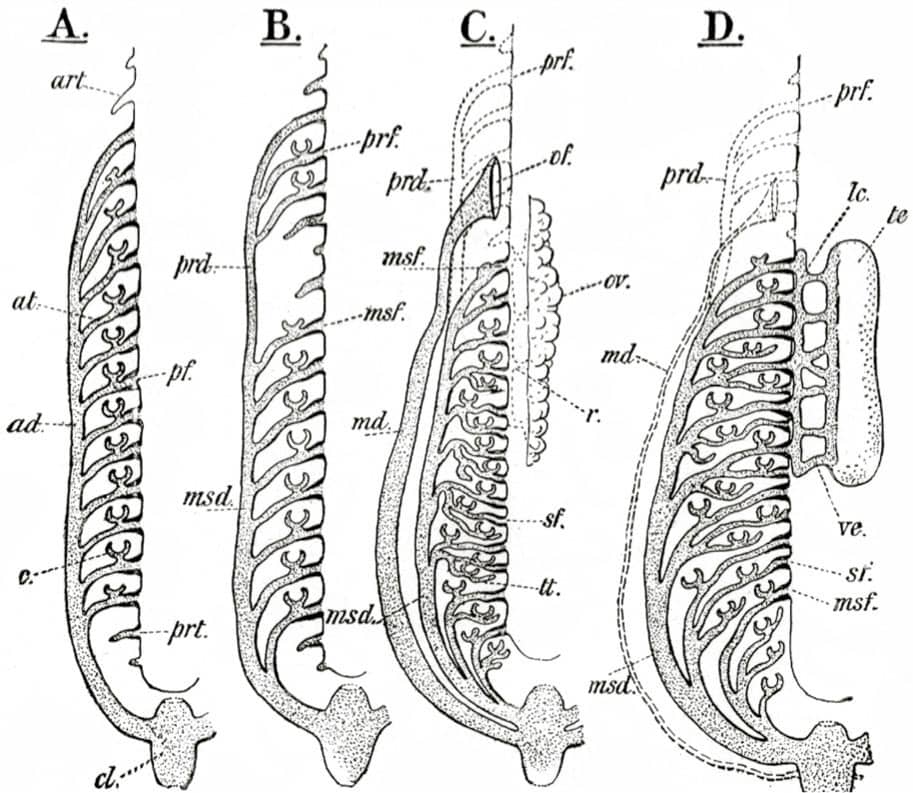
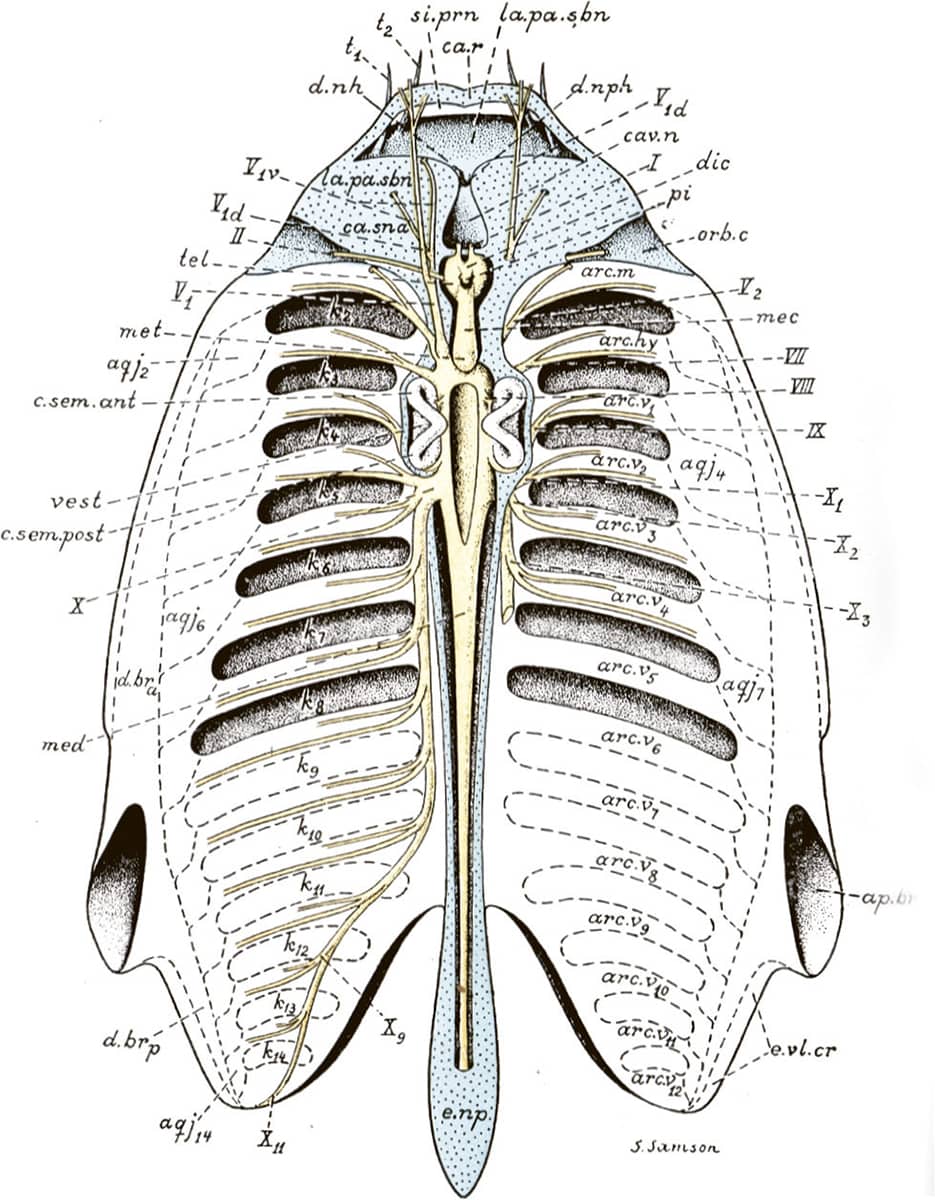
Edwin Goodrich (1868–1946), Studies on the Structure and Development of Vertebrates, 1930; The urogenital system in the Craniata.
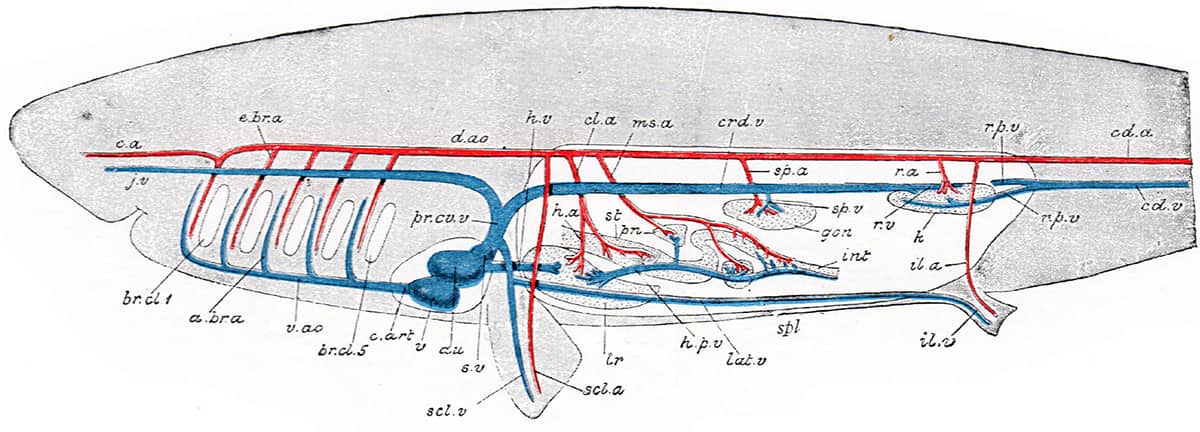
The diagrams, often self-drawn, selected for this book illustrate how his evolutionary/embryological schemes have influenced vertebrate morphology ever since. In one image, hidden among the complex bony mosaic of a fish’s skull, lie the relatively few bones that have persisted into today’s mammalian skulls. Other pictures tell the tangled evolutionary story of the vertebrate cardiovascular system, as it transitions from a one-sided system, with a single atrium and ventricle, into a two-sided system with distinct chambers pumping blood separately around the lungs and the body. Finally, the remodelling of the pelvis that took place during the evolution of dinosaurs and birds is detailed.
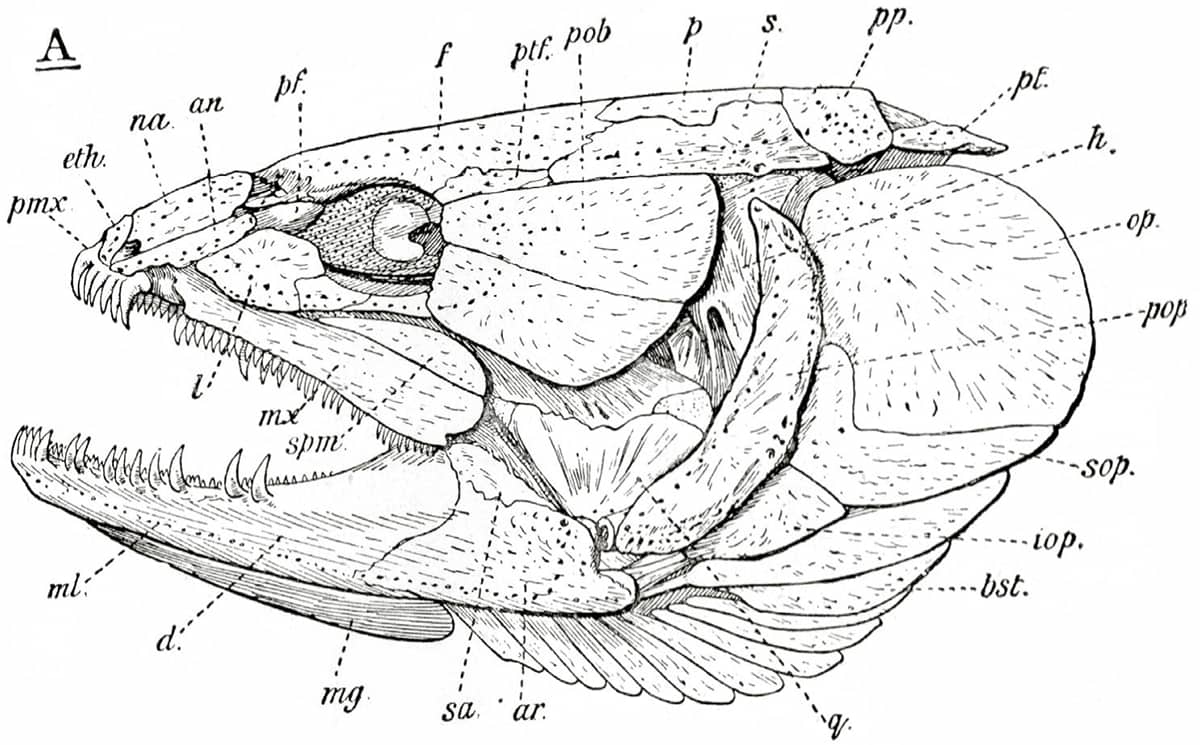
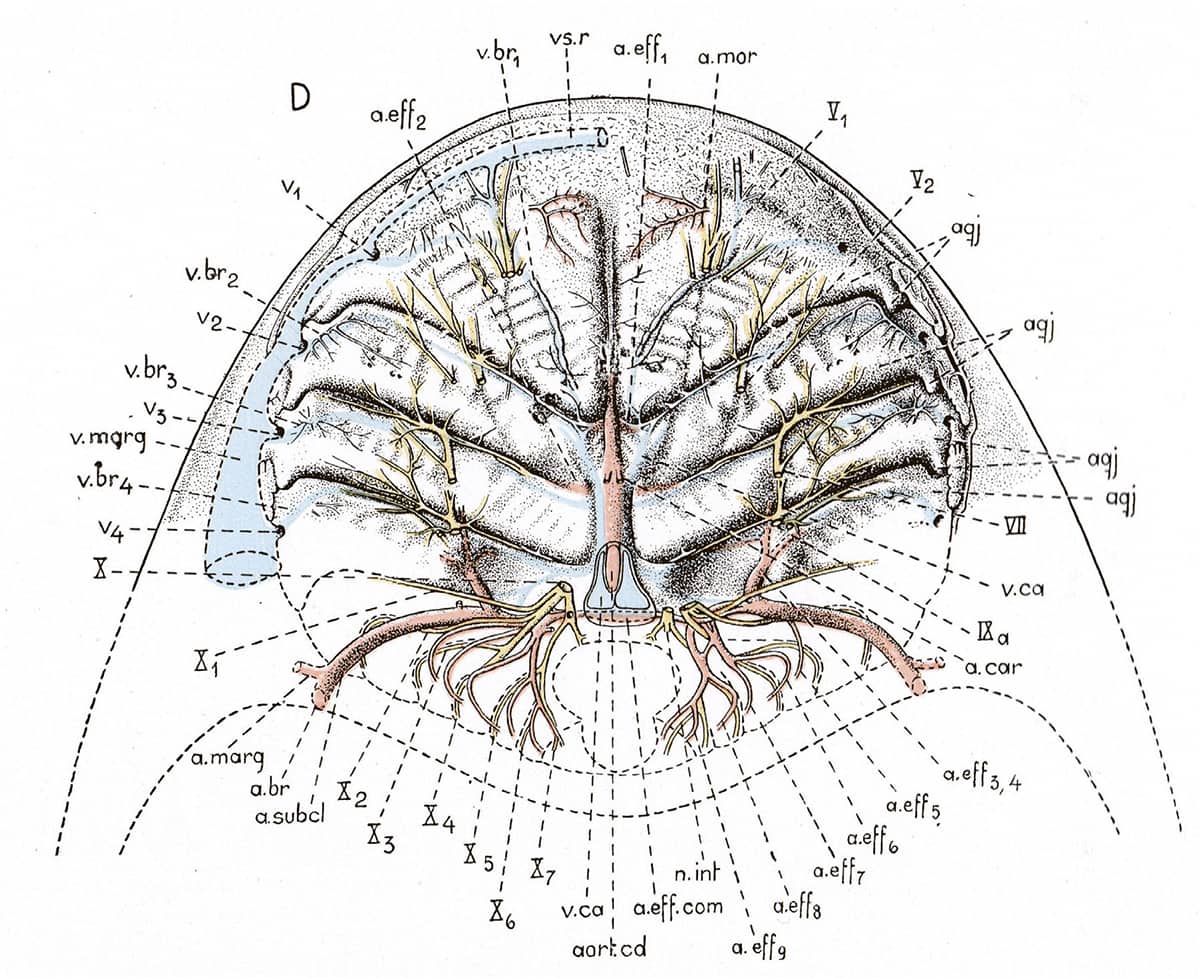
Edwin Goodrich (1868–1946), Studies on the Structure and Development of Vertebrates, 1930; Left-side view of the skull of Amia calva [bowfin](above); Vascular system of a fish (below).
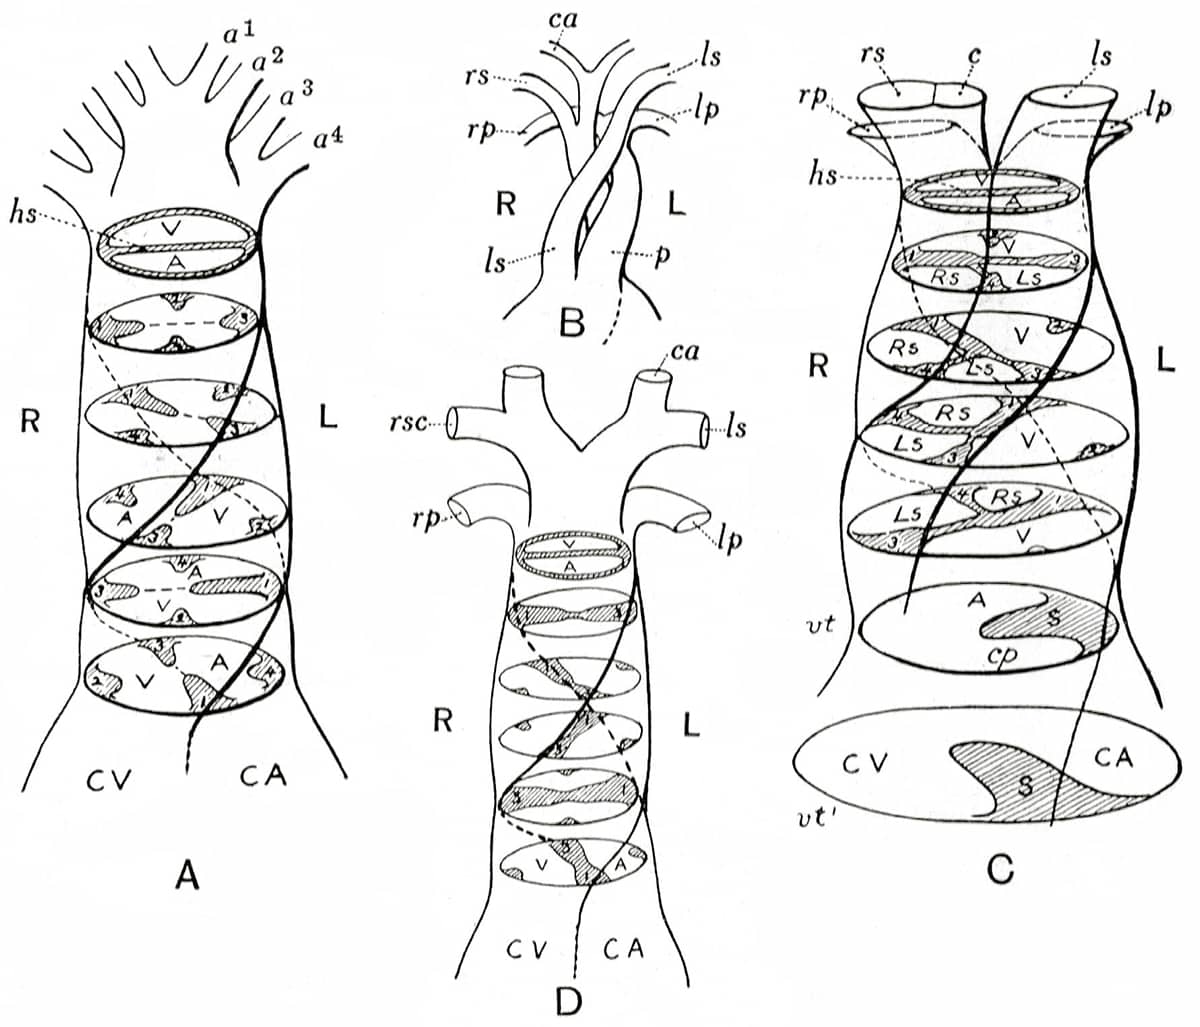
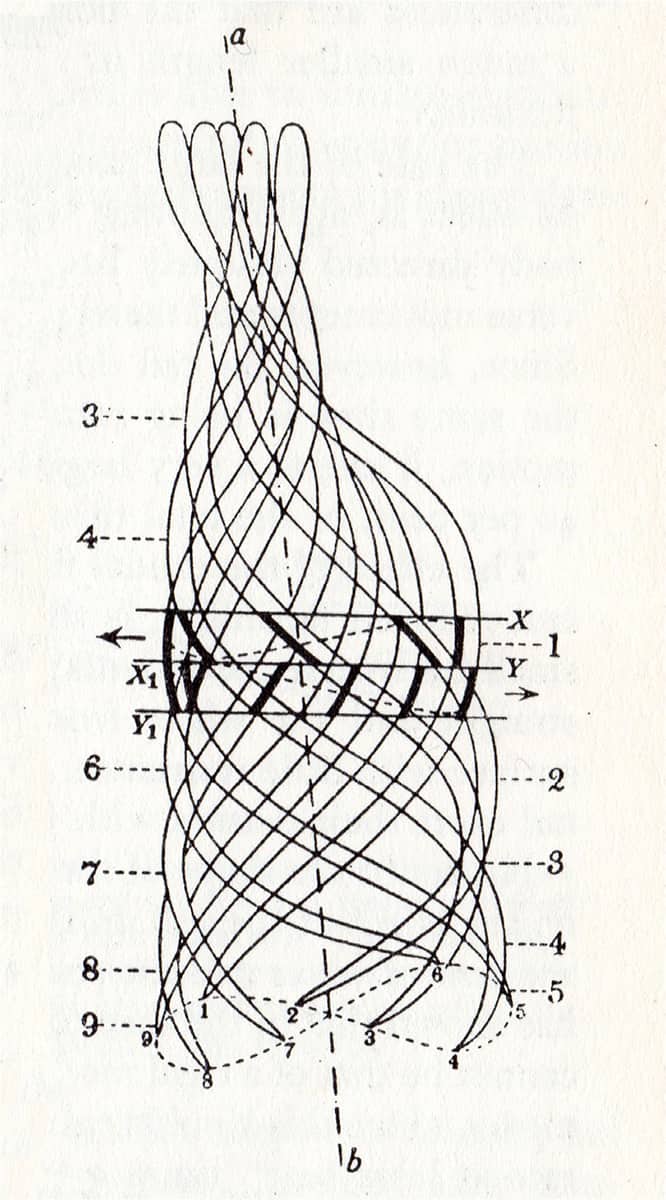
Edwin Goodrich (1868–1946), Studies on the Structure and Development of Vertebrates, 1930; Spiral subdivision of the bulbus cordis in Dipnoi (lungfish), Amphibia, Reptilia, Aves (birds) and Mammalia.
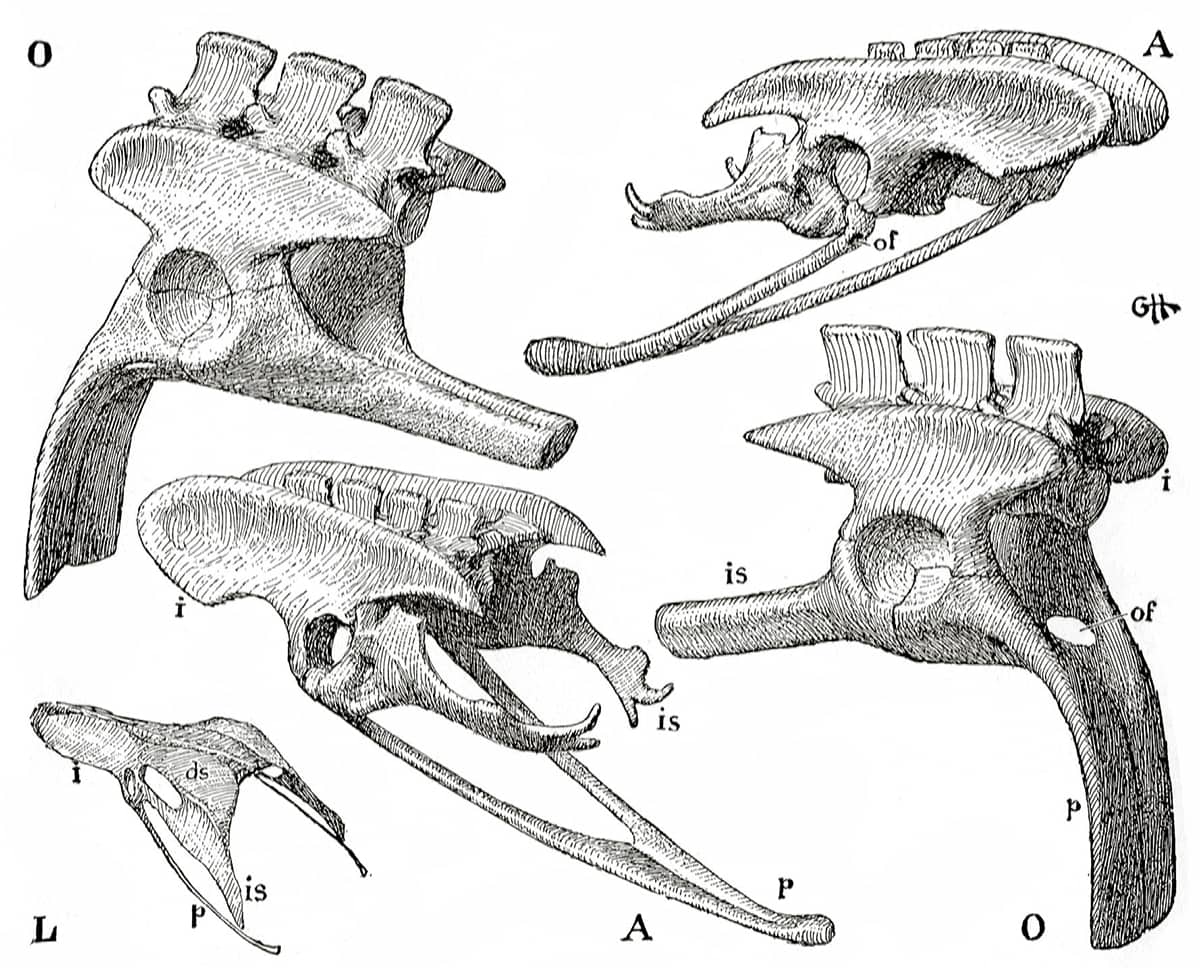
Edwin Goodrich (1868–1946), Studies on the Structure and Development of Vertebrates, 1930; Pelvic girdle and sacrum of A: Archaeopteryx, O: Ornithosuchus (a bipedal dinosaur), L: young gull.
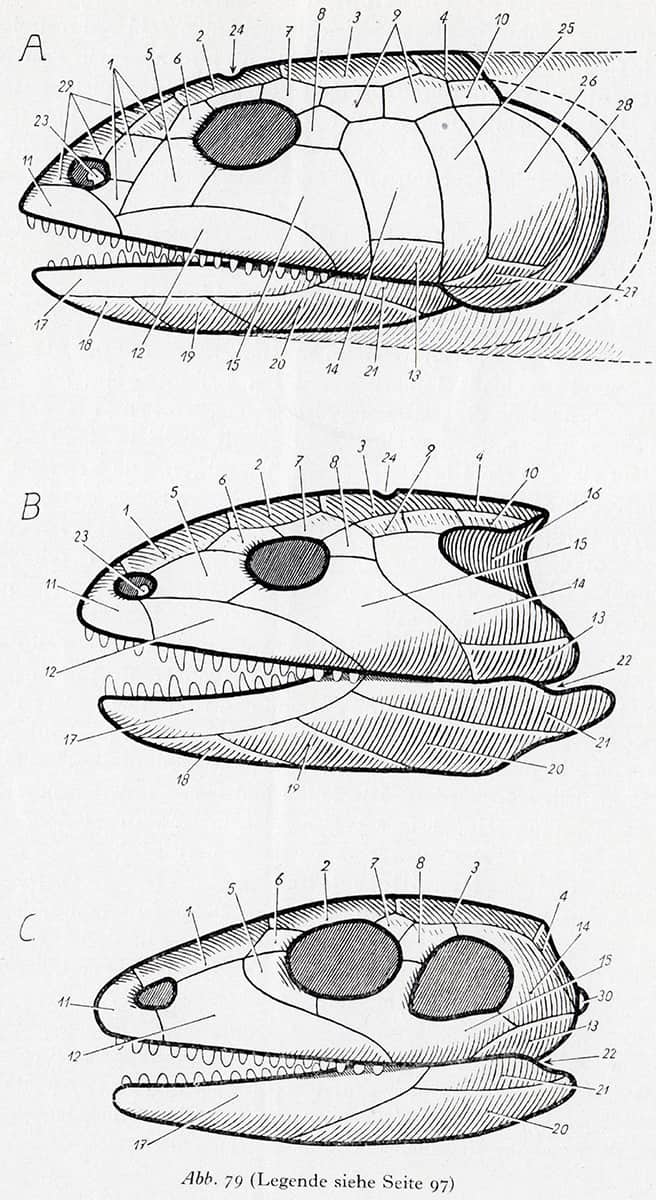
Portmann (1897–1992), Einführung in die Vergleichende Morphologie der Wirbeltiere, 1948; Side view of the skulls of a crossopterygian, a stegocephalan and a primitive reptile.
Although vertebrates share an underlying body plan, this often becomes distorted over the course of evolution, and elements may be lost (but rarely added). This schematic diagram shows trends during transitions between lobe-finned fish, ancient amphibians and primitive reptiles – for example, the progressive loss of bones, lengthening of the snout, and the incorporation of holes in the side of the skull whose edges are used for the attachment of jaw muscles. The small hole for light-sensitive organs on the top of the brain (marked ‘24’) is often lost in fully terrestrial vertebrates.
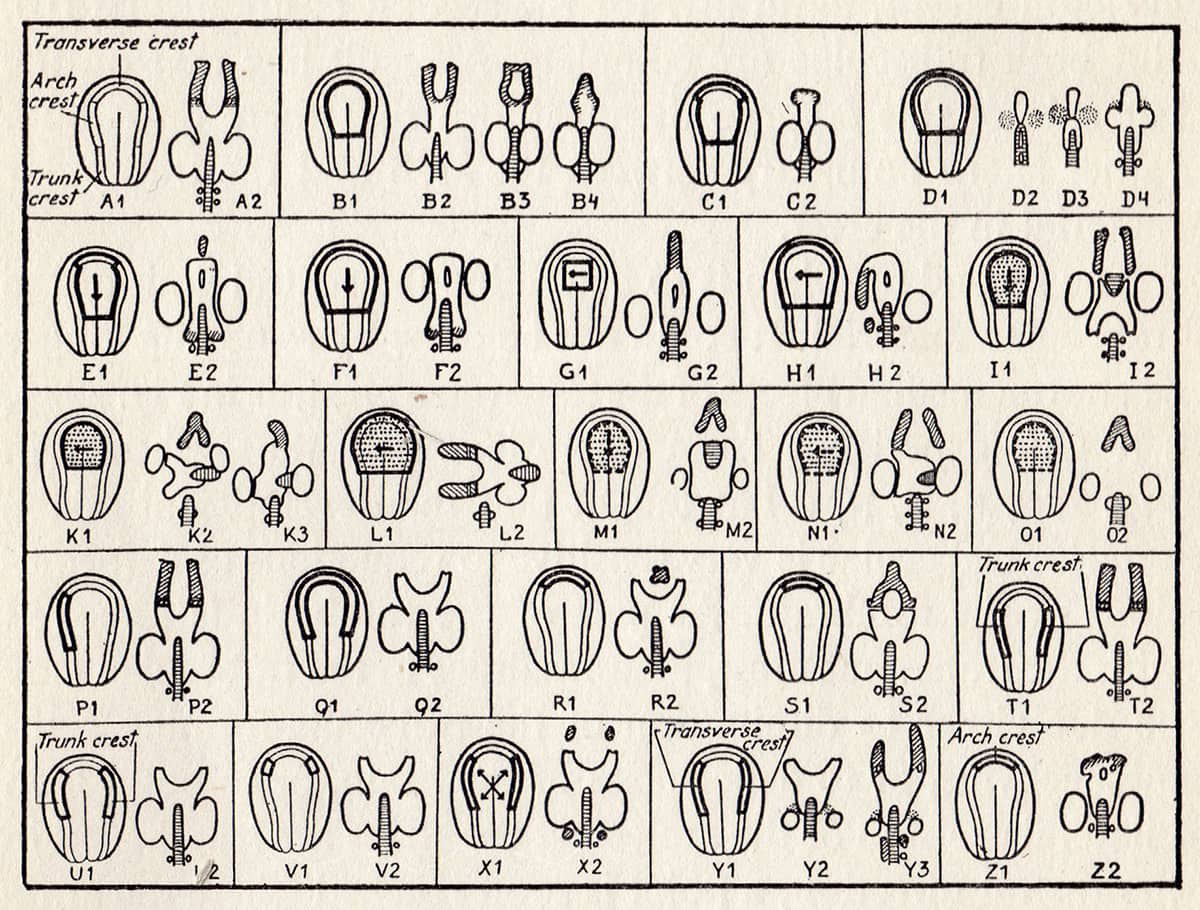
Sven Hörstadius (1898–1996), The Neural Crest, 1950; Development of neurocranium after extirpation, rotation or transplantation of neural plate and neural crest of the head.
The neural crest is an embryonic cell population unique to the vertebrates, and whose evolution is thought to have conferred many of the distinctive features that have made the group so successful. It is involved in the formation of much of the skull, jaws, teeth, gills, heart valves, adrenal glands and pigment cells, and the electrical insulation of many nerve cells. This schematic table details early experiments into the role of neural crest, in which the tissue is removed, rotated or transplanted in developing embryos.

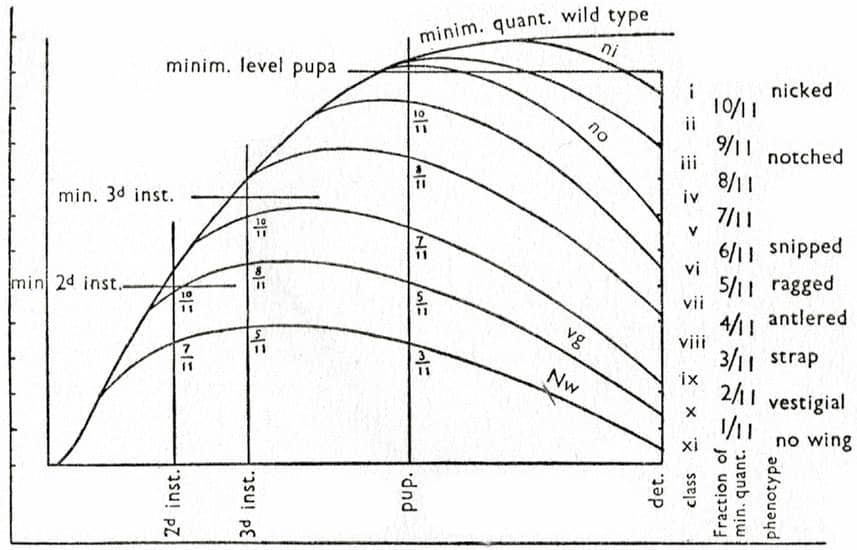
George Stuart Carter (1893–1969), Animal Evolution, 1951; Three stages of the development of the wing of Drosophila melanogaster with the ‘scalloped’ abnormality (top); Variation in a cockatoo in New Guinea (above); Action of the allelomorphs of ‘vestigial’ on the wing of Drosophila melanogaster (below).
Written mid-century, Carter’s Animal Evolution incorporates the many diverse arms of evolutionary biology then established – developmental genetics, evolutionary ecology, population genetics, adaptive processes and phylogenetic trees.
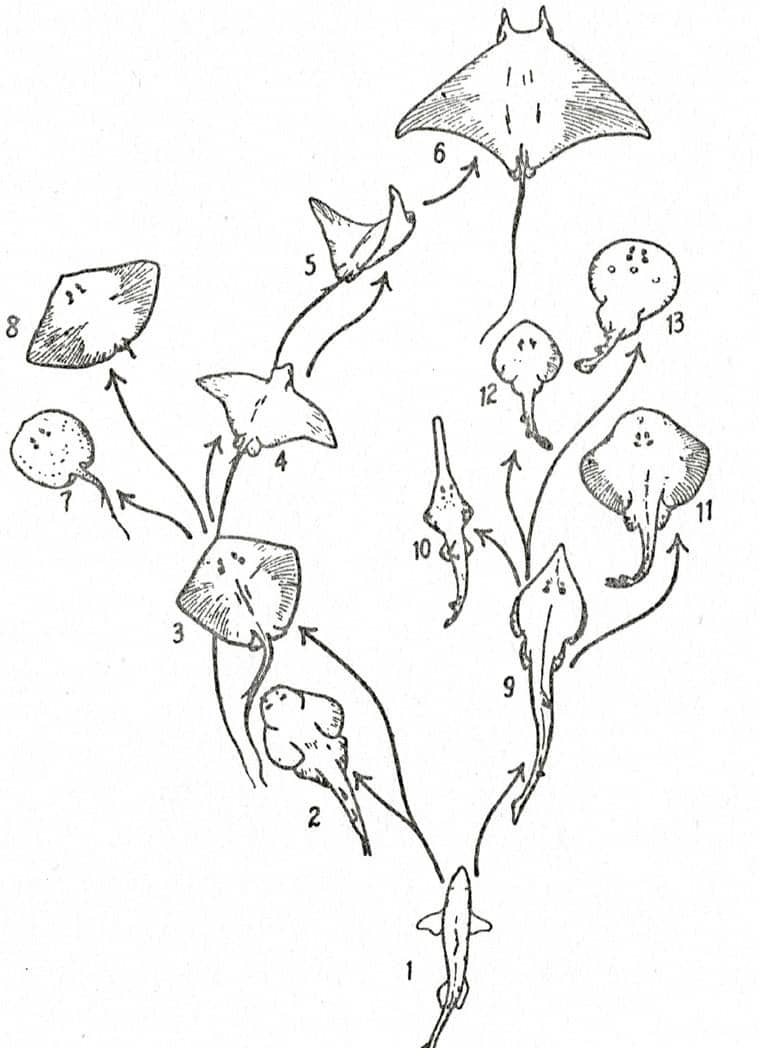
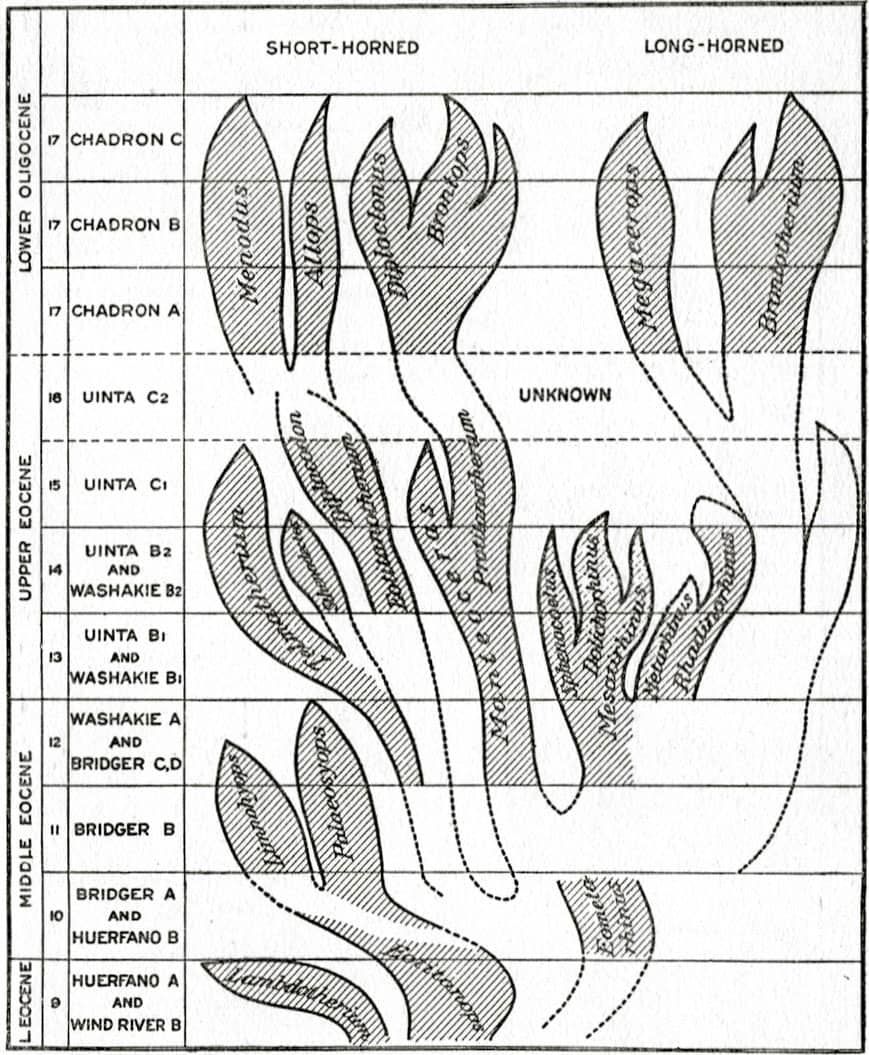
George Stuart Carter (1893–1969), Animal Evolution, 1951; Adaptive radiation in rays (above); Simplified phylogeny of the titanotheres (below); Phylogenetic tree of the vertebrates [after Romer] (bottom).
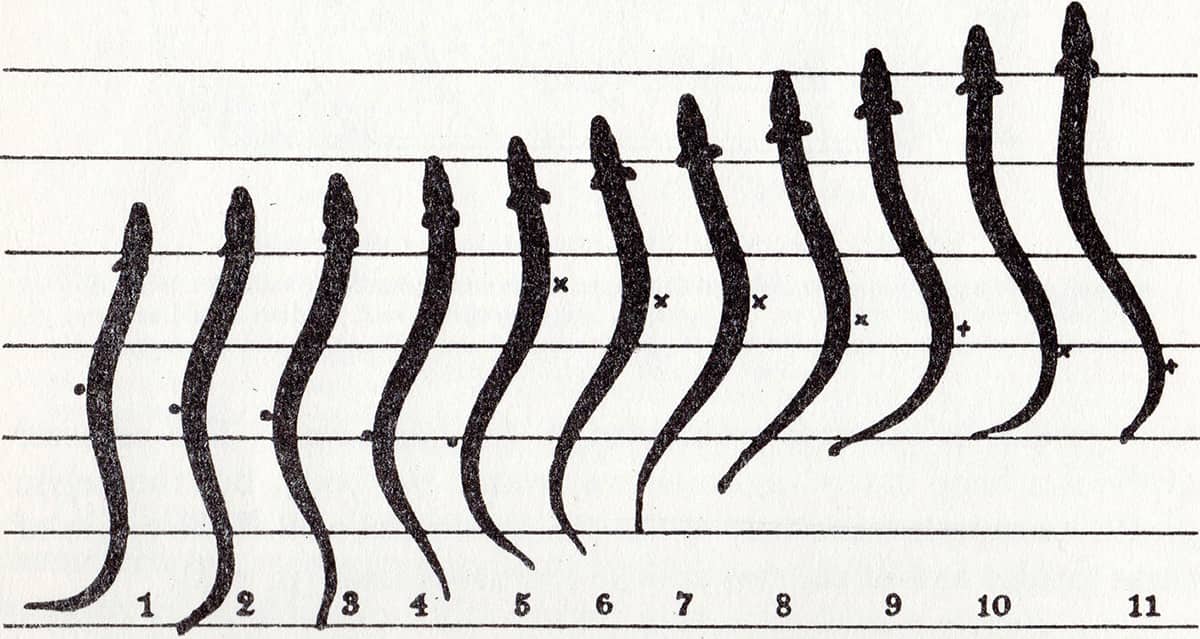
John Zachary Young (1907–1997), The Life of Vertebrates, 1950; Successive positions of a swimming eel (above); Drawings of successive photographs of a young eel superimposed on each other (below).
The field of biomechanics has allowed animals to be classified according to the physical processes by which they swim, fly or walk.
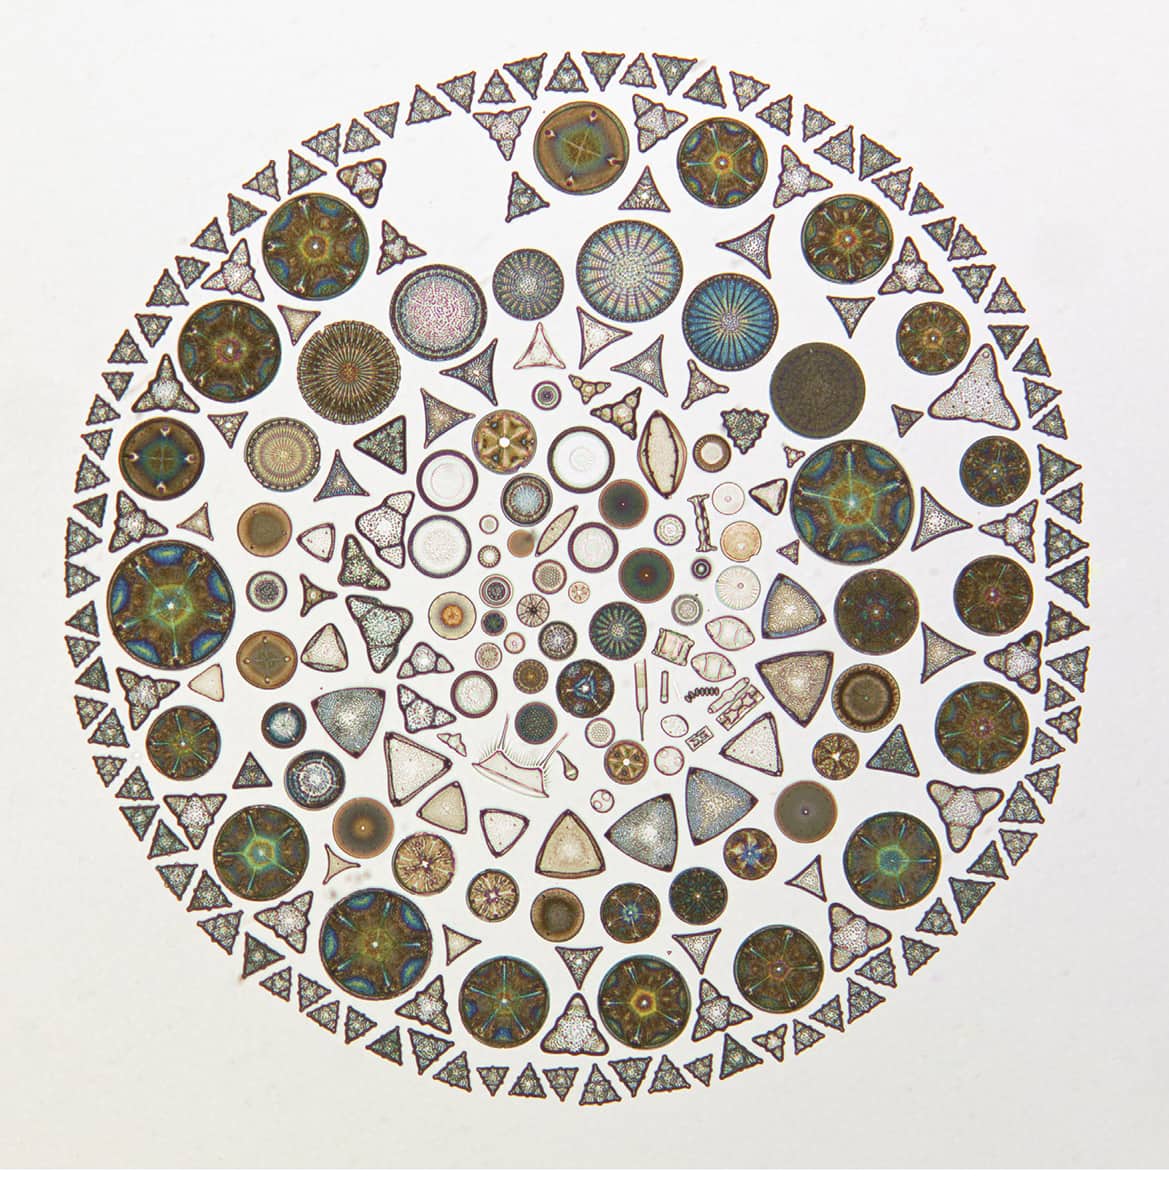
Albert Brigger (1892–1981), Microscopic diatoms arranged on a single slide (1952).
It is perhaps surprising that a twentieth-century scientist who spent his career studying the biology of microscopic plankton should choose to organize his subjects in such an unscientific way. Harking directly back to the microscopic montages of the Victorian era (see here and here), this artifice makes no claim to arrange these tiny creatures according to biological similarity or evolutionary relatedness. Instead, these diatoms are used simply as geometric elements in a visual whole – biological stained glass for the steady-handed.
Pierre-Paul Grassé (1895–1985), Traité de Zoologie, Tome XIII: Agnathes et Poissons, 1958; Zenaspis signata.
Grassé’s titanic multi-volume Treatise on Zoology was one of the last attempts at a single-author comprehensive survey of animal life – evolution, classification, diversity, structure, development and function. This image is a schematic of the organization of the bony carapace of one of the earliest fossil fishes. Even at this ancient date, the basic plan of the nervous system had been established, with tiny tunnels through the bone conveying nerves directly equivalent to nerves in our own heads.
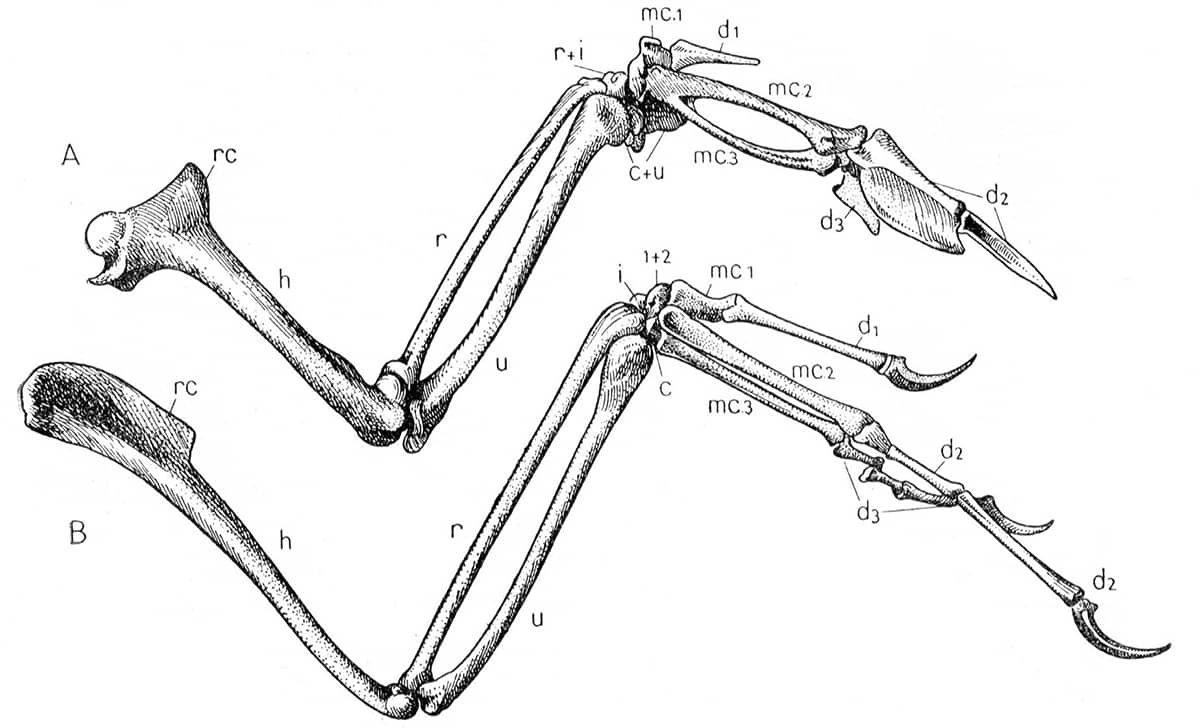
Pierre-Paul Grassé (1895–1985), Traité de Zoologie, Tome XV: Oiseaux, 1950; Squelette de l’aile droite d’un pigeon (top) et d’Archaeornis (above).
Birds’ wings contain no ‘new bones’ beyond those found in their dinosaur ancestors. However, they retain only the first three digits (‘thumb’, ‘index’ and ‘middle’ fingers). The lower image shows that some fossil forms still retained claws on their wings, and that the bony fusion seen in the ‘hand’ of today’s birds (above) was not yet complete.
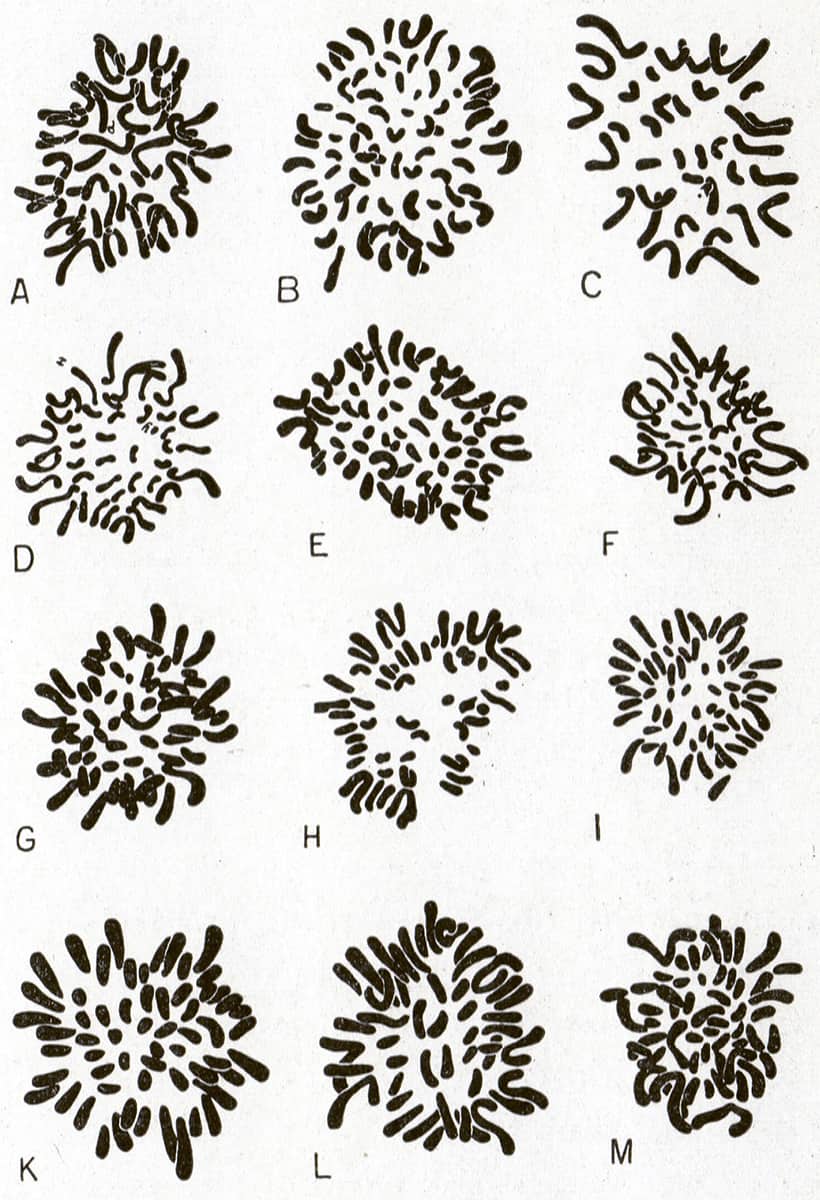
Pierre-Paul Grassé (1895–1985), Traité de Zoologie, Tome XII: Embryologie, 1954; Metaphase diploid chromosomes of twelve mammals.
It was known in the eighteenth century that at a certain phase of cell division, now called ‘metaphase’, a clump of darkly stained strands can be seen in microscopic preparations. These ‘coloured bodies’, or ‘chromo-somes’, were suspected to contain the cell’s genetic material long before the discovery of the double-helix structure of their constituent DNA molecule in 1953.

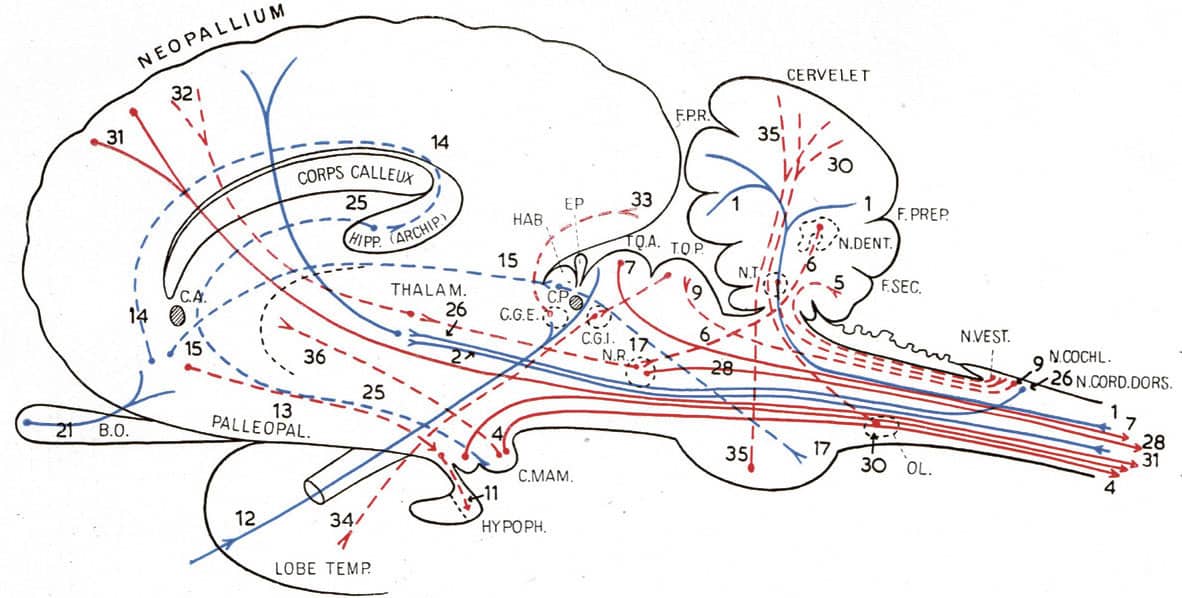
Pierre-Paul Grassé (1895–1985), Traité de Zoologie, Tome XII: Embryologie, 1954; Brain of a bird (above); Brain of a mammal (below).
The brain is the most complex organ in the vertebrate body, yet it displays a common pattern of organization in all vertebrates, including humans. There are variations between different vertebrate groups, but these are often due to differences in preponderance of brain regions present in some form in all of them.

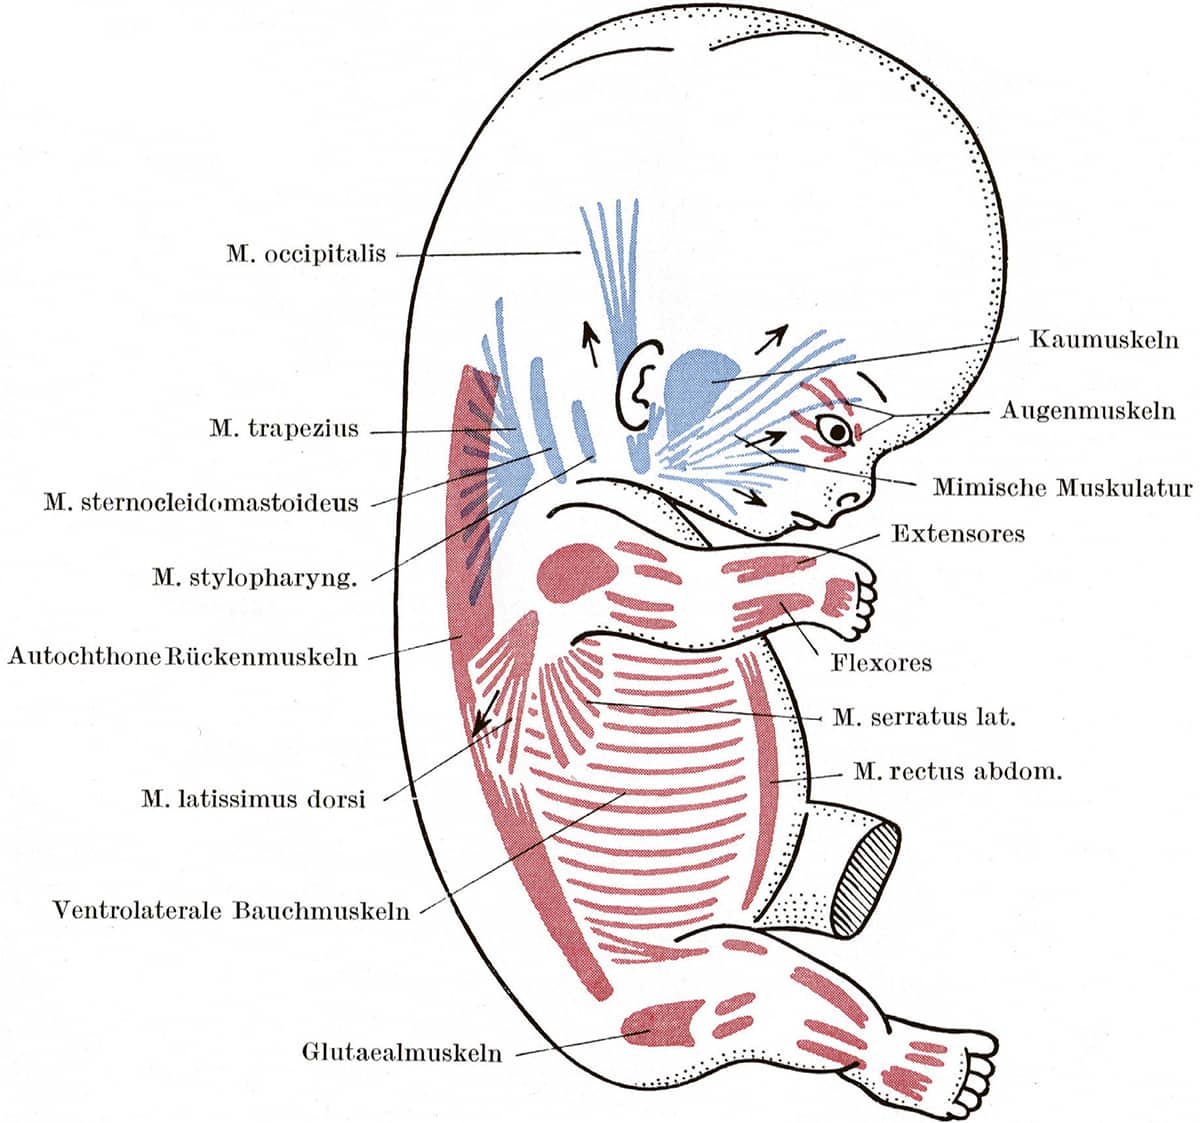
Dietrich Stark (1908–2001), Embryologie, 1955; Schema der Muskelanlagen, menschlicher Embryo von 5mm Länge (above); Schema der wichtigsten Muskelgruppen beim älteren Embryo (below).
Our evolutionary heritage is obvious during the development of a human baby. In these two images, almost all muscles of the human body are seen to be derived from two different segmental precursors. The red segments are myotomes – equivalent to the stripes of muscle in fish fillets – and they form the muscles of the trunk, limbs and tongue, as well as the unusual muscles which move the eye (Augenmuskel-anlagen). The blue segments are the pharyngeal arch muscles – evolved from the muscles that moved our fishy ancestors’ gills – which now form most other muscles in the head and neck.

Alfred Sherwood Romer (1894–1973), Osteology of the Reptiles, 1956; Cervical vertebrae.
Whether knowingly or not, many of our images of vertebrates, and especially those of extinct reptiles, are based on work by Romer. His meticulous analyses of reptilian skeletons created the armature on which most subsequent reconstructions of these captivating creatures were built.
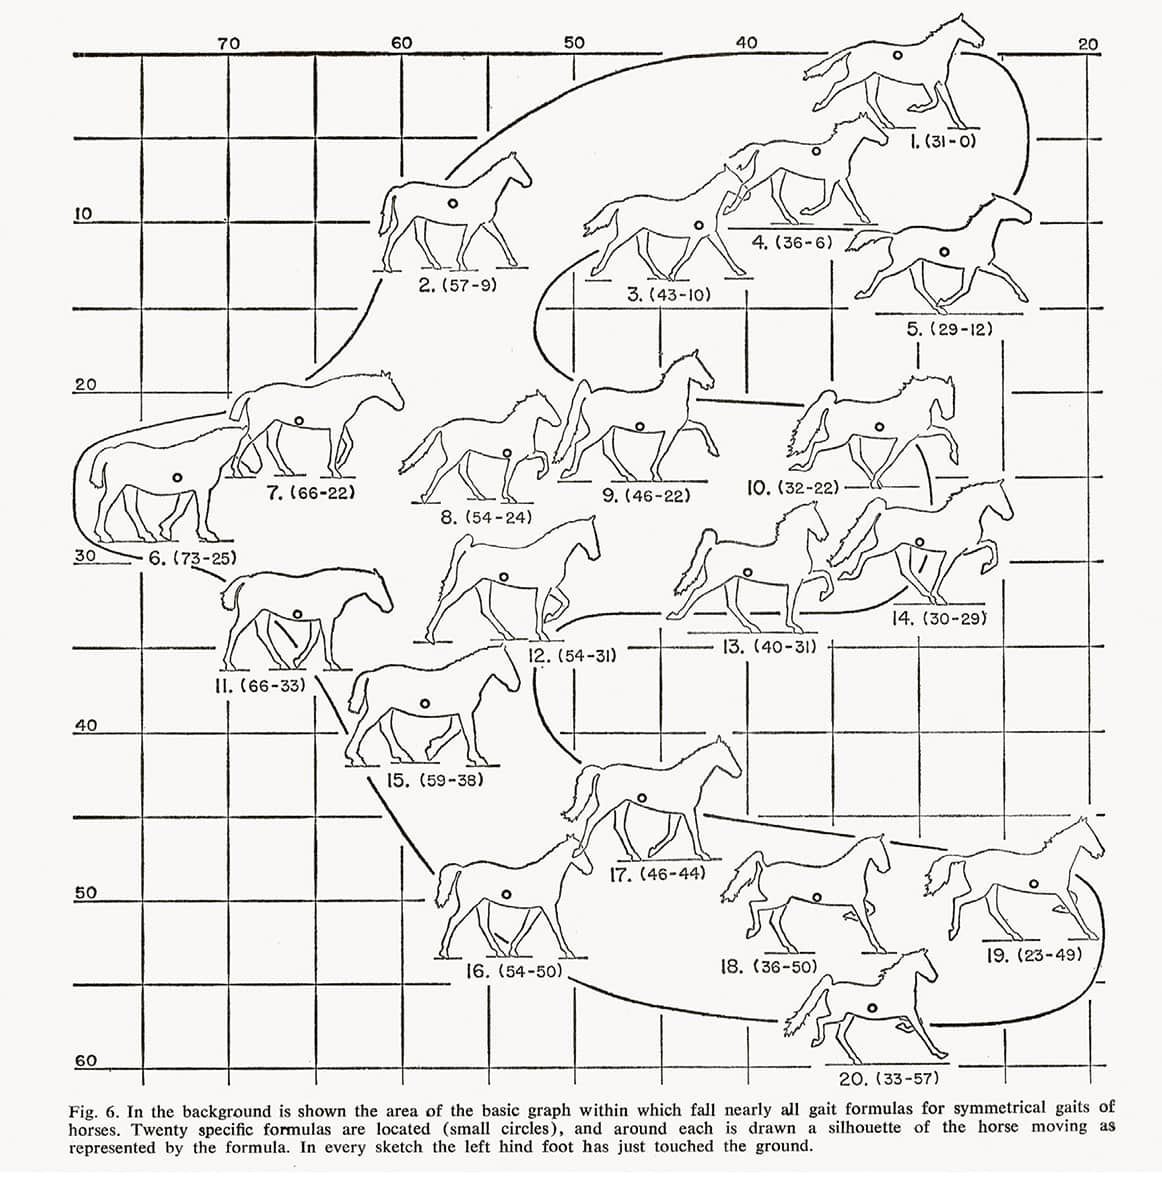
Milton Hildebrand (b. 1918), Symmetrical gaits of horses, 1965, Science vol. 150, pp. 701–708.
The natural gaits of the horse, and indeed many other quadrupeds, are the walk, the trot, the canter and the transverse gallop. However, having four legs makes possible a bewildering variety of gaits, which have proved remarkably difficult to define and classify.
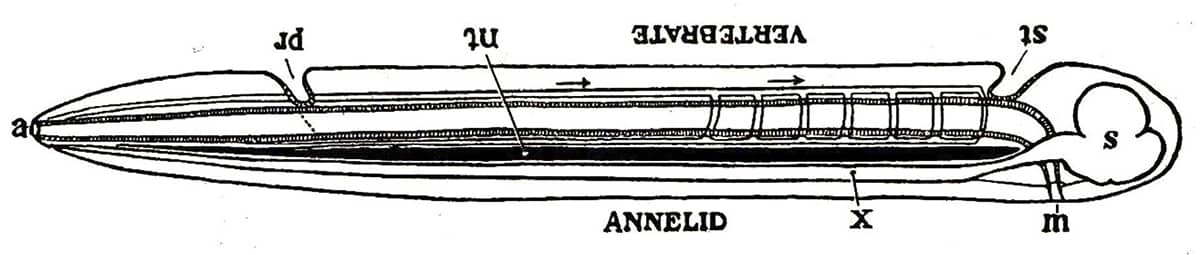
Alfred Sherwood Romer (1894–1973), The Vertebrate Body, 1970; The similarities between the vertebrate body plan and an inverted annelid.
One of the most far-reaching attempts to organize, or perhaps over-organize, the animal kingdom started in the early eighteenth century. It was realized that the structure of vertebrates was quite unlike that of many animals, such as insects and segmented worms. However, the French biologist Geoffroy Saint-Hilaire thought he had solved the problem with the startling suggestion that the common vertebrate ancestor had once indeed resembled those other creatures, but had simply started swimming upside down. The simplistic nature of this theory meant it was largely ignored for over a century, until some (but not all) modern developmental studies provided support for it. The theory remains contentious, if tenacious, so it is not yet clear whether vertebrates truly are worms that ‘turned over’.
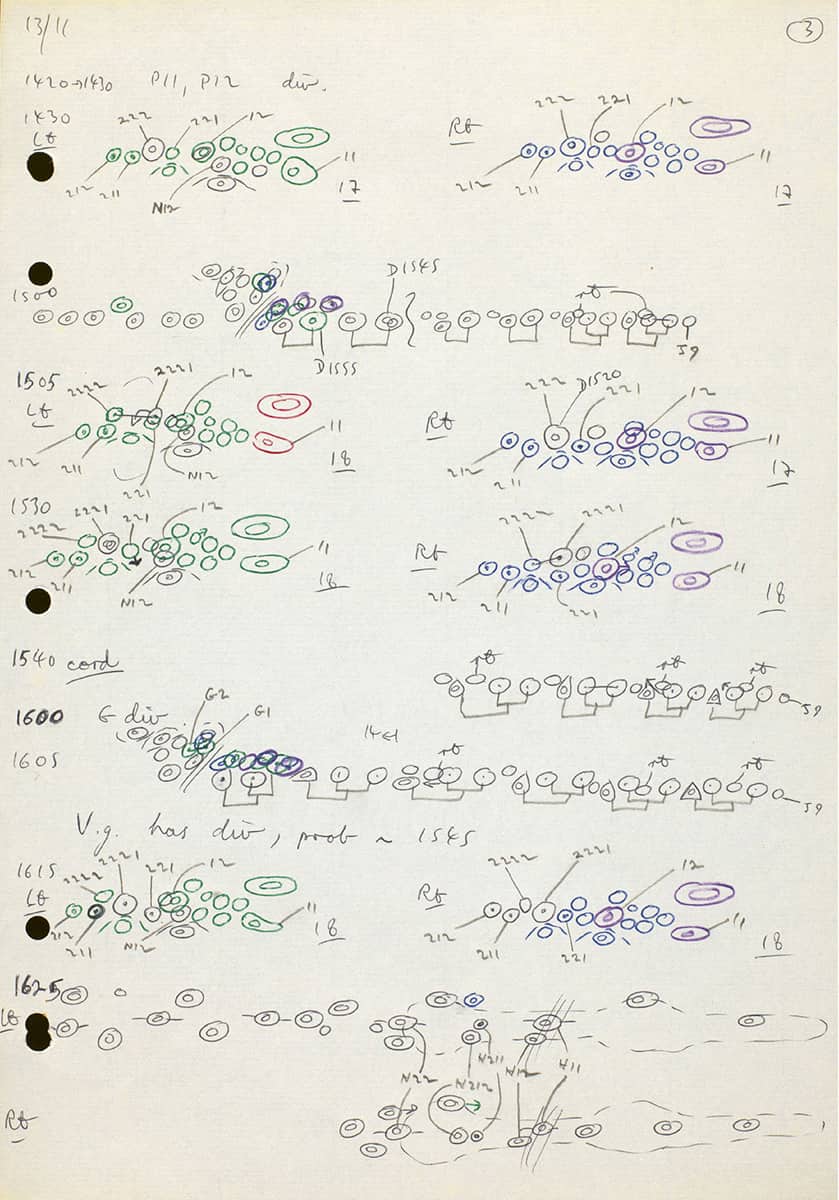
Wellcome Collection, London, Notebook page; Coloured cell lineage drawings for the Caenorhabditis elegans worm tail.
One of the most astounding feats of zoological investigation was the determination of the precise pattern of division and specialization of every cell in the larva of a multicellular organism, the roundworm Caenorhabditis elegans. A total of 671 cells are unfailingly produced during this process, and these sketches show the research team’s attempts to elucidate the “family tree” of the cells in just one part of the body. As a result of these studies, this humble creature has become a mainstay of modern developmental biology.
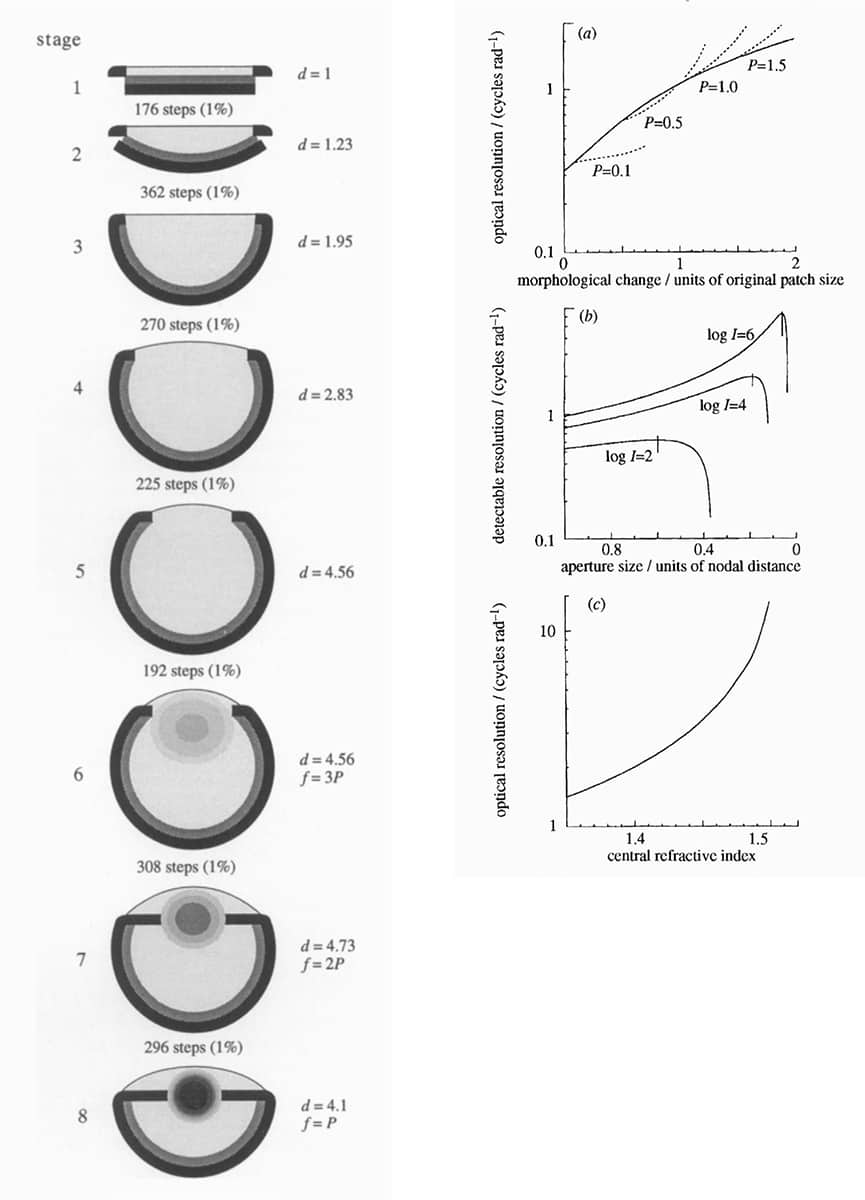
Dan Nilsson and Suzanne Pelger, A pessimistic estimate of the time required for an eye to evolve, 1994, Proceedings of the Royal Society B vol. 256, pp. 53–58.
Even Darwin worried about how something as apparently perfect as the eye could evolve by natural selection rather than by divine design. However, more recent simulations of the process of eye evolution suggest that it can take place remarkably rapidly, which may explain why so many disparate animals possess eyes.
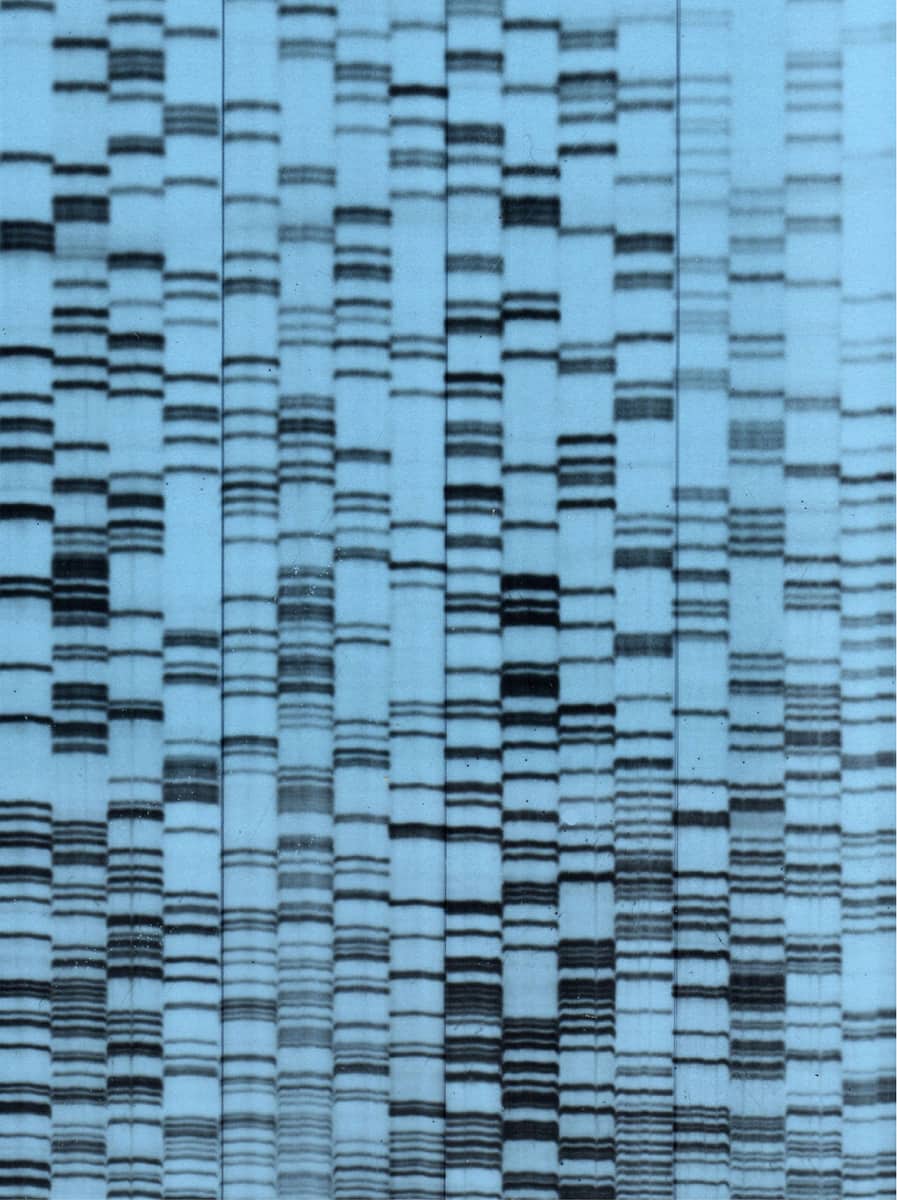
David Bainbridge, Sequences of transplantation antigen complementary DNAs derived from invasive bovine trophoblast cells, 1999.
The ability to determine the sequence of DNA has transformed experimental biology – not only can scientists observe the structure, function and behaviour of animals, but they can now also decrypt their underlying genetic code. This image is from the author’s own research into a particular set of genes postulated to have a role in immunity during pregnancy in ruminant animals, using the now-superseded technique of radioactive DNA sequencing. The DNA code consists of sequences of four possible bases named A, C, G and T – each set of four vertical columns is the sequence of a single nucleic acid molecule purified from a cell sample.
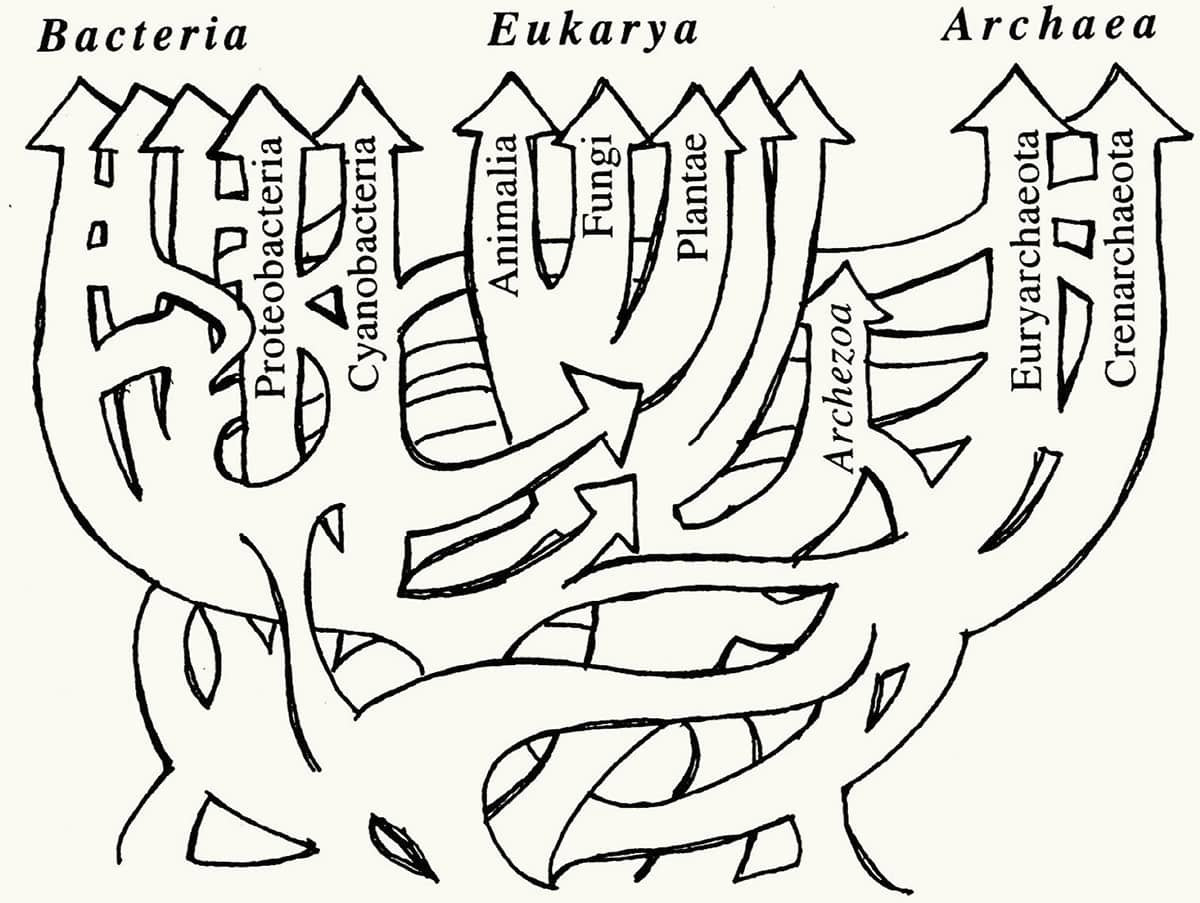
W. Ford Doolittle, Phylogenetic classification and the universal tree, 1999, Science vol. 284, pp. 2124–2128.
By the turn of the twenty-first century it was clear that organisms do not evolve in a simple, branching, tree-like pattern. First, evidence began to accumulate that much of the DNA in many bacteria seems to have been acquired remarkably recently, apparently purloined from other bacteria by a process of ‘lateral transfer’. Second, viruses are thought to provide a route for passing extensive regions of DNA from one complex animal (such as a snake) to another (such as a cow). Finally, it is now accepted that the complicated ‘eukaryote’ nucleated cells that make up animals, plants and fungi are actually conglomerations of at least two, and probably more, ancestral bacteria. As a result of all this sharing and merging, and as the images on these two pages show, the ‘tree of life’ has changed radically – not only can one branch now split into two, but two branches can, confusingly, merge into one.
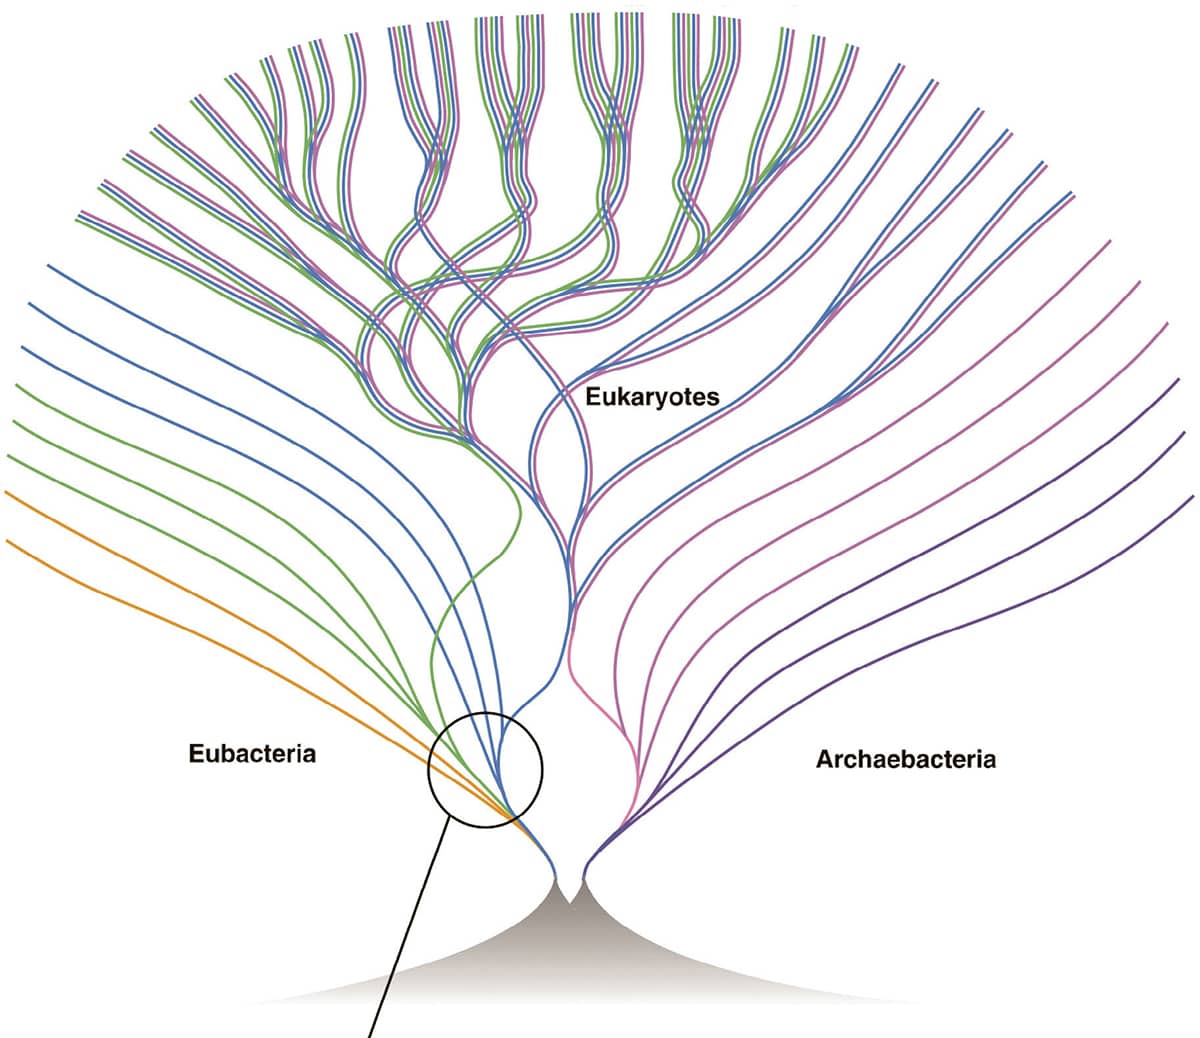
William Martin, Mosaic bacterial chromosomes: a challenge en route to a tree of genomes, 1999, Bioessays vol. 21, pp. 99–104.
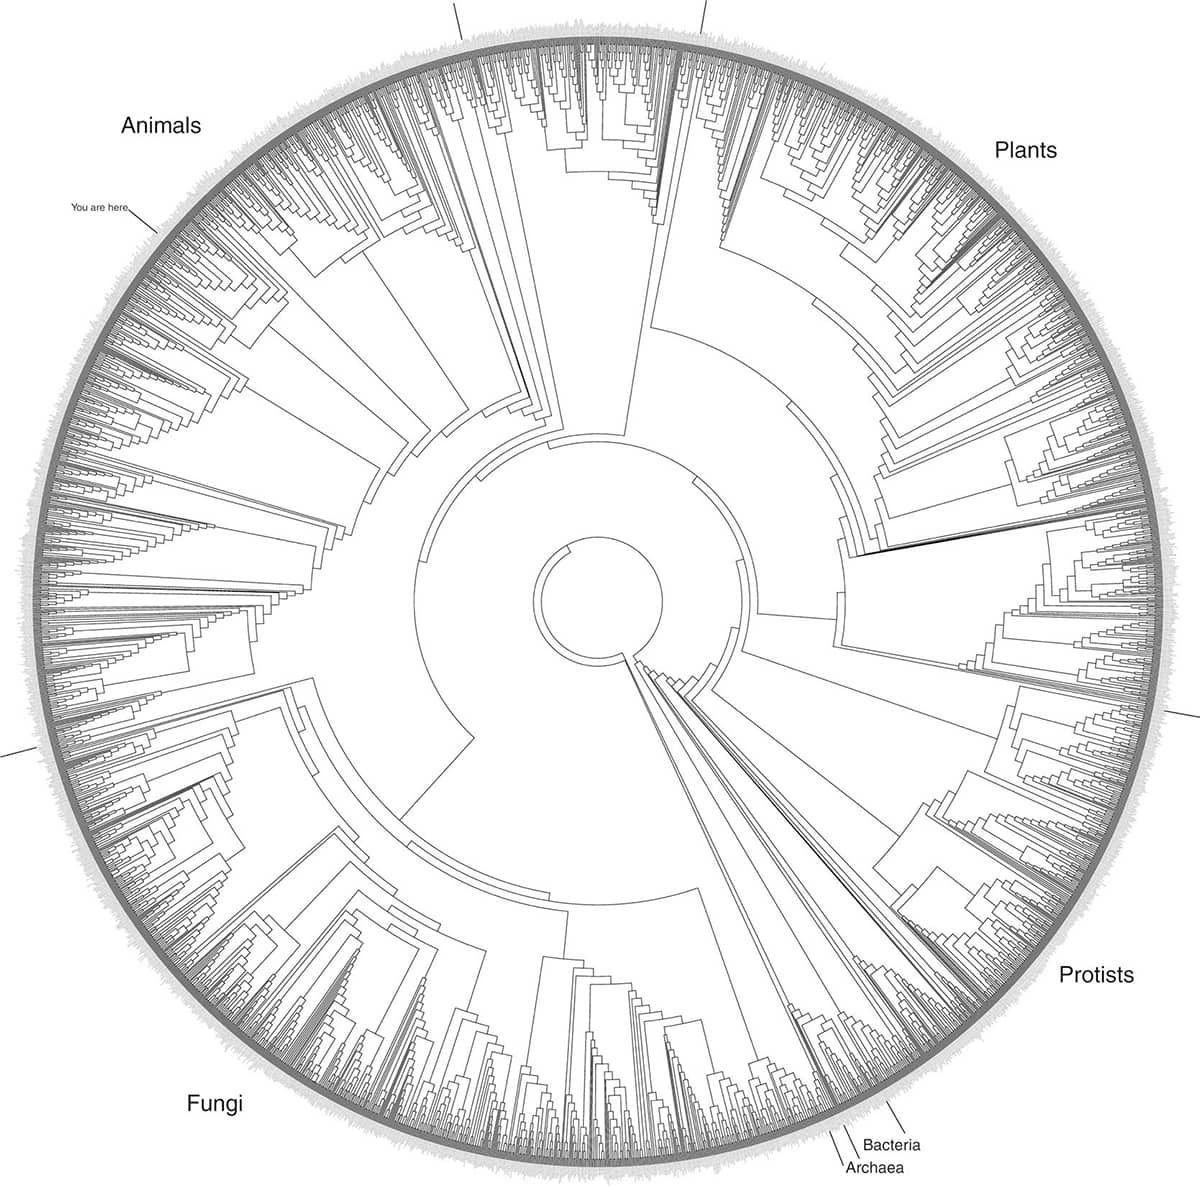
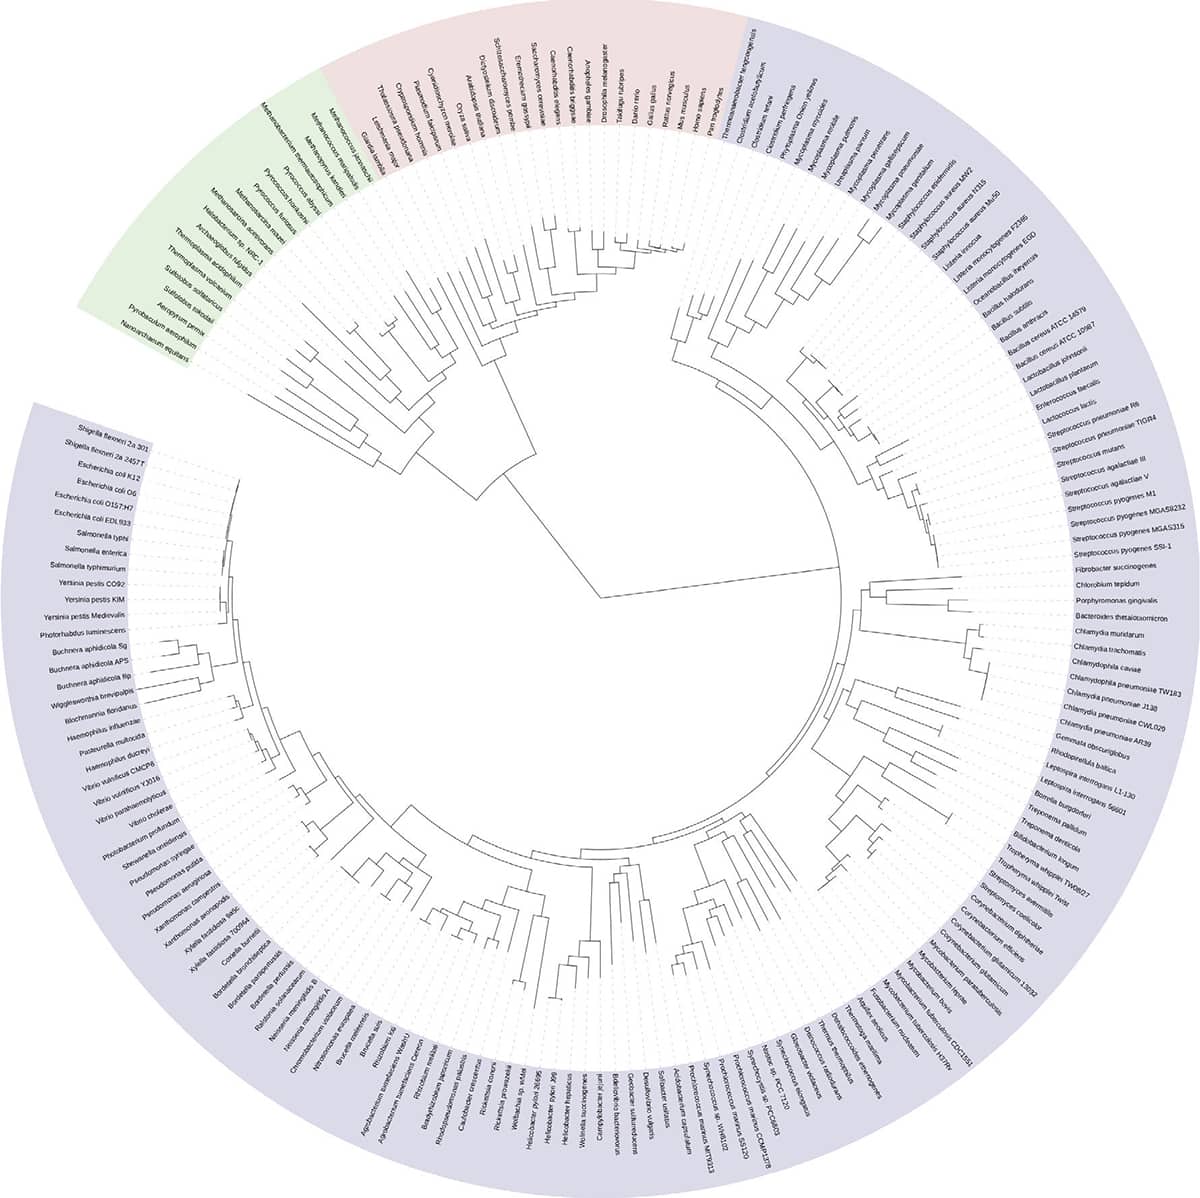
David Hillis and Elizabeth Pennisi, Modernising the Tree of Life, 2003, Science vol. 300, pp. 1692–1697; Hillis Plot.
The so-called ‘Hillis Plot’ is a striking attempt to produce an evolutionary tree for all living things. Because the terminal twigs on any tree greatly outnumber the major branches, many phylogeneticists now reformat their trees as circles, with a central ‘trunk’, and terminal twigs at the circumference, as here. The fuzzy ‘rind’ of the Hillis Plot circle is actually the names of the constituent species written in a minuscule font. The Hillis Plot is notable for its skew towards eukaryotic organisms (those with nucleated cells such as fungi, plants and animals), while the far more numerous bacteria and archaea are relegated to a tiny slice at around five o’clock. Some iterations of the plot feature the tiny announcement ‘you are here’ at half past ten.
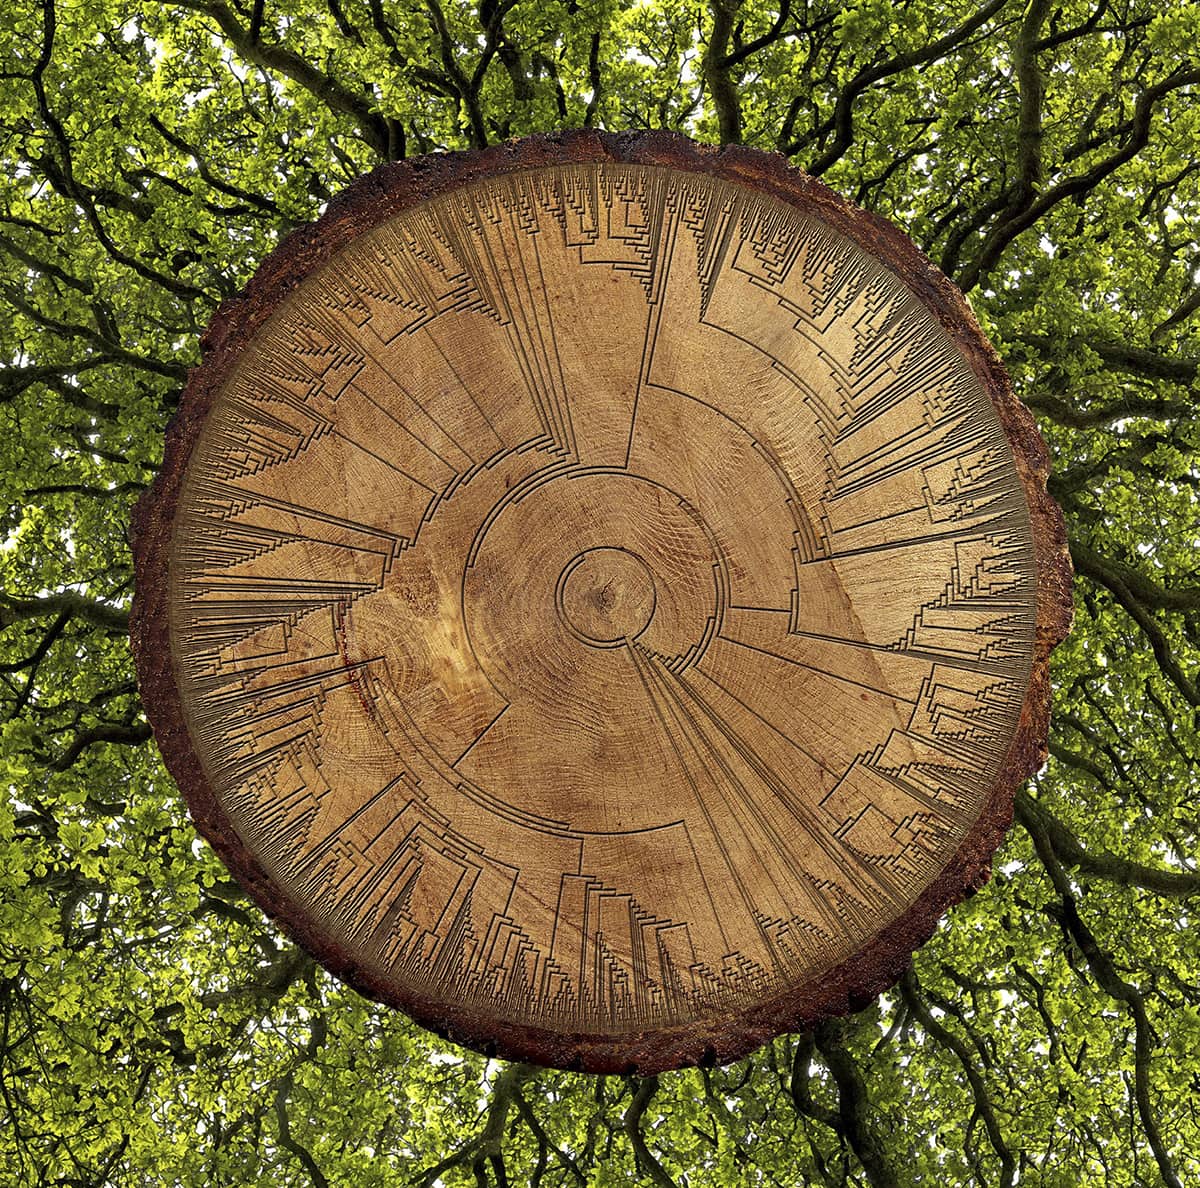
Carol Ballenger, Tree of Life: Homage to Darwin, 2007.
A gentle play on words, the centre of this image features a transected tree trunk, on which is superimposed the Hillis Plot.
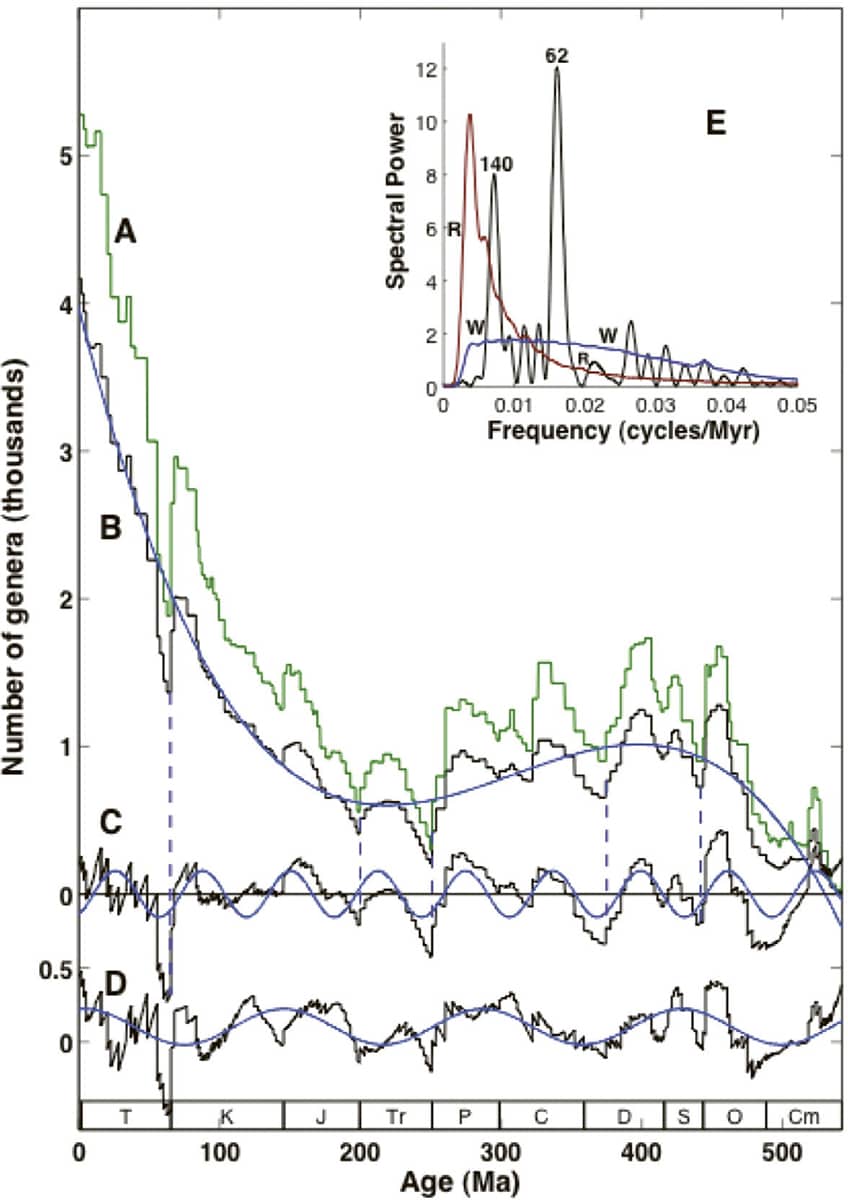
Robert Rohde and Richard Müller, Cycles in fossil diversity, 2005, Nature vol. 434, pp. 208–210.
A complex graph with an unnerving interpretation. The green line ‘A’ represents the number of known marine fossil groups present over geological time, from the present on the left, to 500 millions years ago on the right. The data are then neatened up in traces B, C and D, and some trends removed, to provide evidence that major extinction events occur with a regular interval of 62 million years. The causes of this postulated cycle are unknown, but may be celestial.
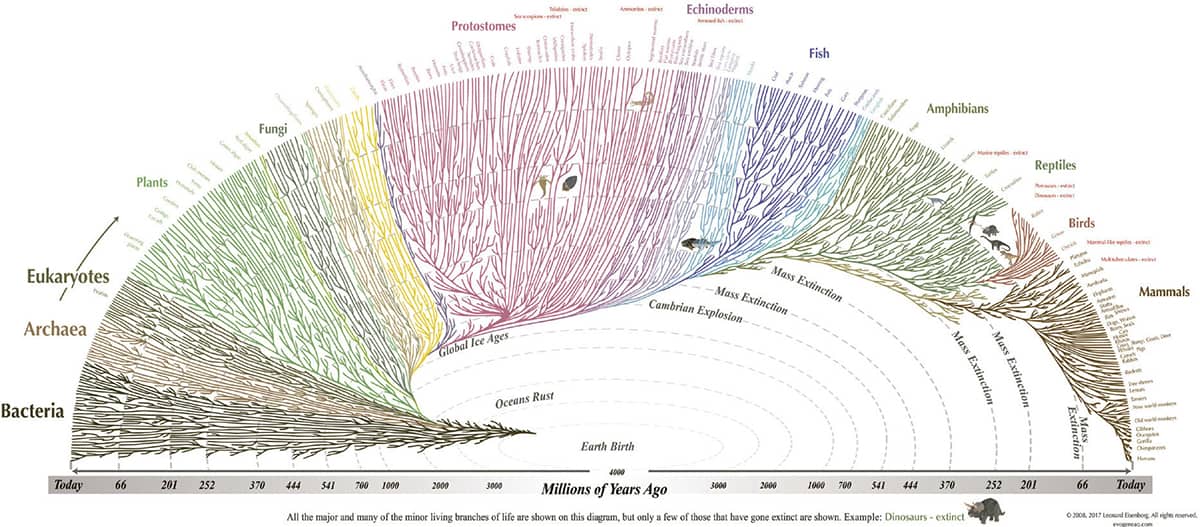
L. Eisenberg, Tree of Life (evogeneao.com).
A teaching tool designed to promote the teaching of evolution, the Evogeneao tree solves the one-trunk-many-branches design problem by employing a half-ellipse format.
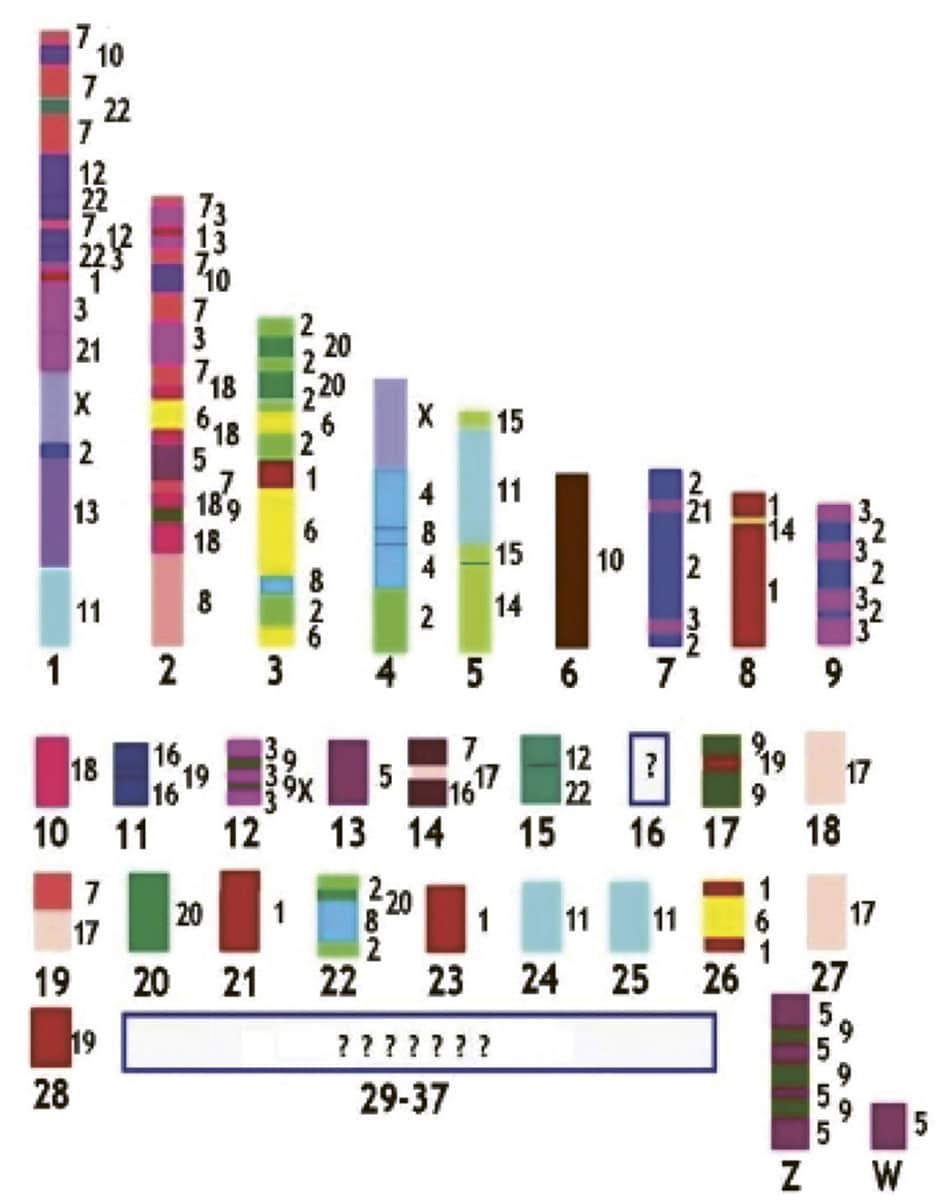
Alexander Graphodatsky and others, The genome diversity and karyotype evolution of mammals, 2011, Molecular Cytogenetics vol. 4, p. 22.
Just like animals, chromosomes evolve over time, and this diagram illustrates apparent similarities between the chromosome arrangement of chickens and humans. Each colour corresponds to one of the twenty-three pairs of human chromosomes, superimposed onto scattered regions of similarity on the thirty-nine chicken chromosome pairs.

Doris Bachtrog, Sex determination: why so many ways of doing it?, 2014, PLOS article 1001899.
The mechanisms by which animals determine their sex during embryonic development are remarkably diverse. Mammals use a system based on the X and Y sex chromosomes (red in the figure), as indeed do beetles (Coleoptera). In contrast, birds (Aves, blue) use a chromosomal Z/W system, which appears superficially to be the opposite of the mammalian system (ZZ birds are male, ZW are female). Butterflies and moths (Lepidoptera) use a bird-like system. Reptiles use a variety of systems, including environmental sex determination (green) in which the sex of offspring is controlled by the temperature at which their eggs are incubated.
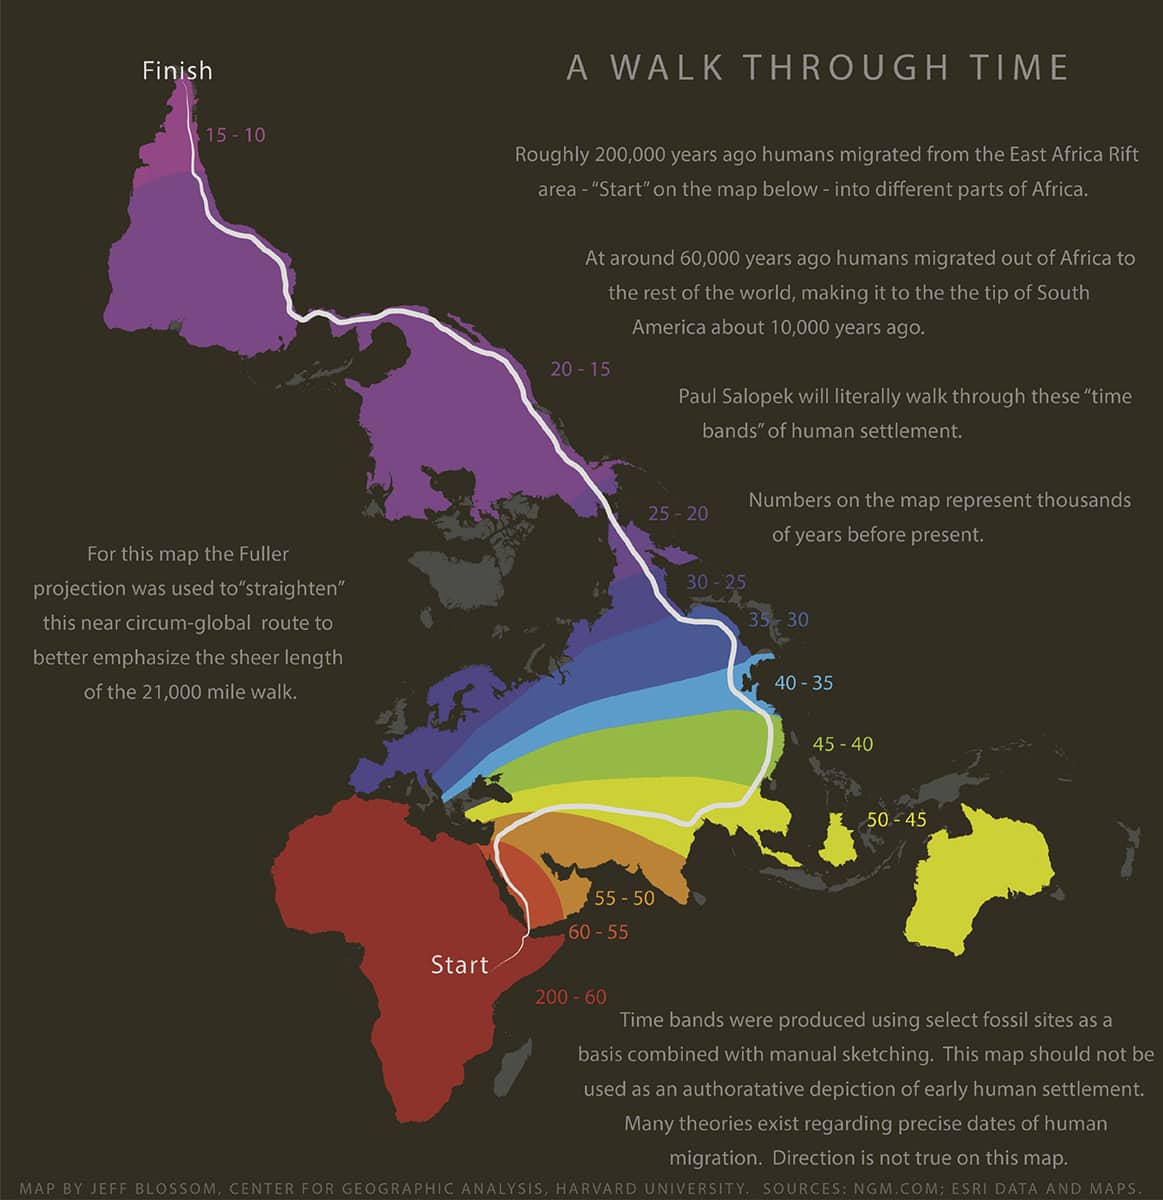
Jeff Blossom, A Walk Through Time, 2015.
Humans are the most widespread of all mammalian species, yet their geographical spread has been remarkably recent and rapid. This image is an ‘isochrone map’, in which the range of the human species at particular times is shown by different colours. The unusual map projection allows all continents to be depicted with relatively little distortion to their intrinsic shape.
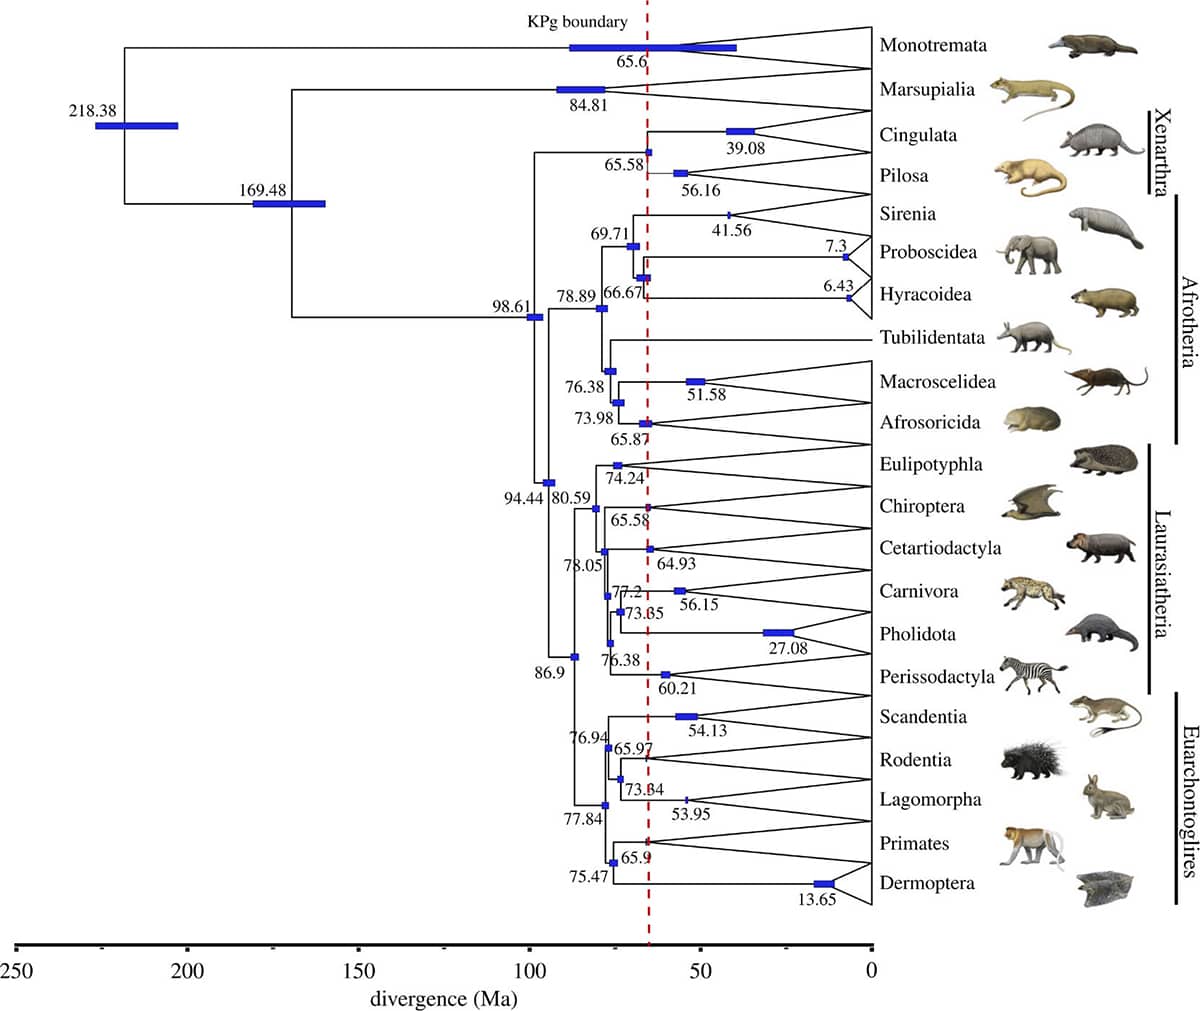
Nicole Foley and others, Mammal madness: is the mammal tree of life not yet resolved?, 2016, Philosophical Transactions of the Royal Society B vol. 371, article 20150140.
The evolutionary relationships of the twenty-or-so groups of mammals have proved surprisingly difficult to determine. Many of these groups diverged from each other a long time ago, but relatively rapidly, and have since followed a bewildering variety of evolutionary paths – a combination of circumstances that probably means their genealogy will remain unresolved for some time into the future.
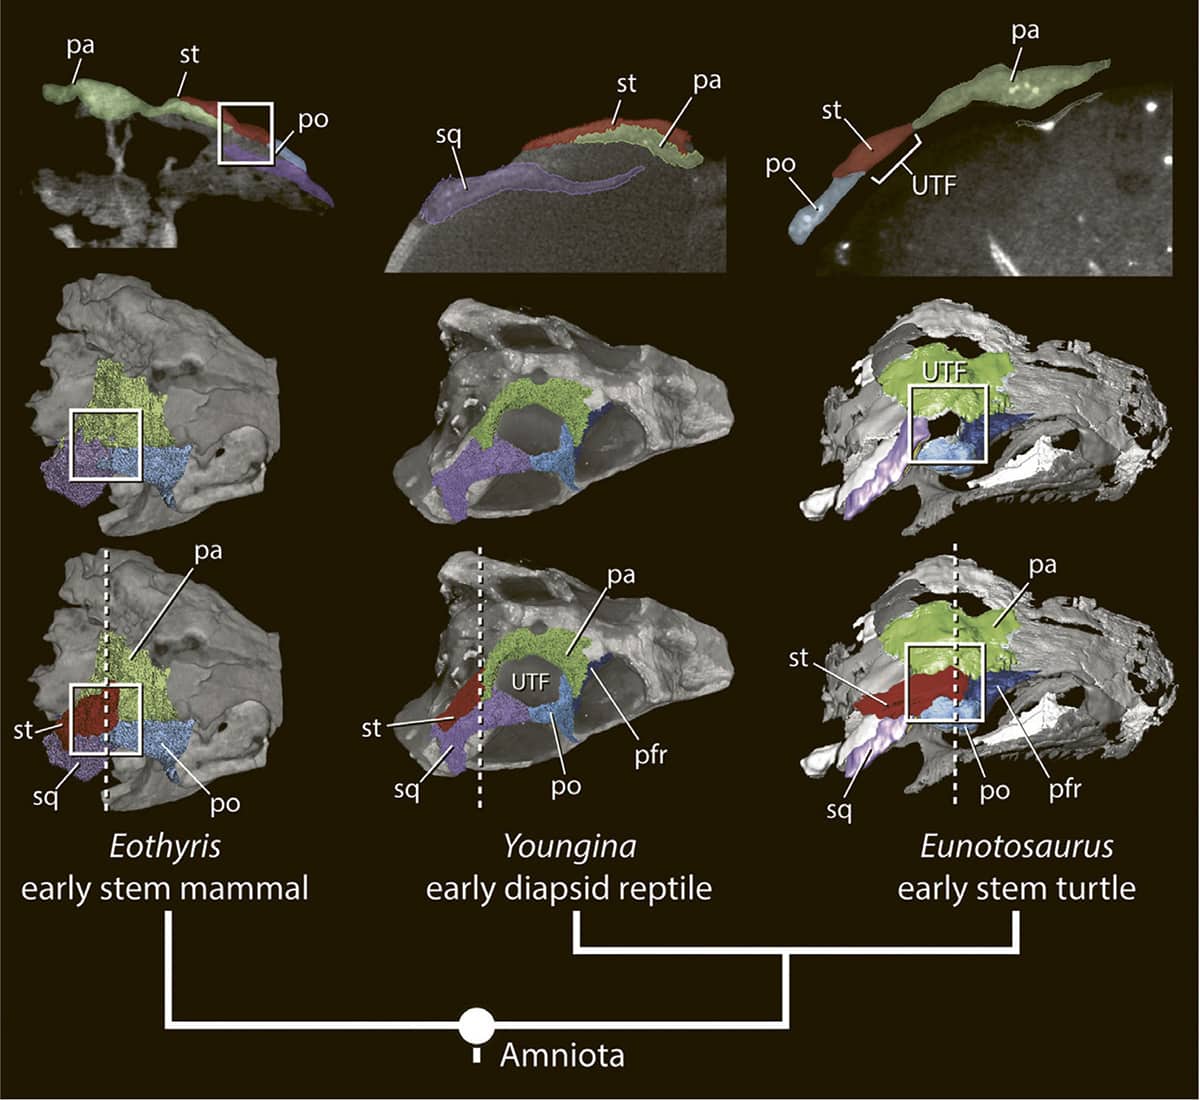
Gabriel Bever and others, The amniote temporal roof and the diapsid origin of the turtle skull, 2016, Zoology vol. 119, pp. 471–473.
For decades, the ‘amniote’ vertebrates (reptiles, birds and mammals) have been classified according to the windows or ‘fenestrae’ in the sides of their skulls – with turtles having no fenestrae, mammals having one, and birds and other reptiles having two. It was long assumed that turtles retained the ancestral arrangement, with the result that it was not possible to determine which of these three groups were most closely related. However, recent studies using micro-computerized tomography (μCT) scans have shown that the ‘windowless’ turtle skull is actually derived from a ‘two-window’ ancestor rather than the other way round. Thus, the pattern of divergence of the three dominant groups of land vertebrates seems now to have been resolved, with mammals only distantly related to all reptiles and birds.
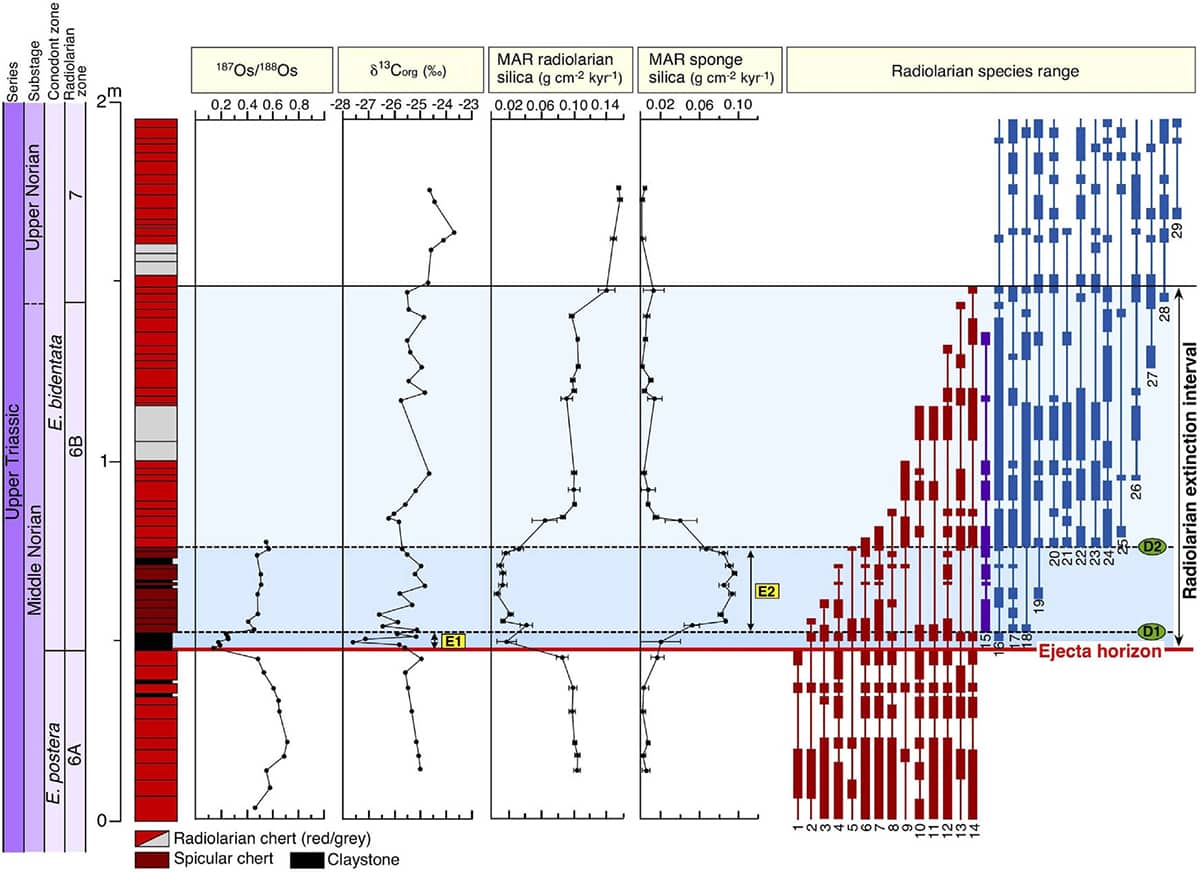
Tetsuji Onoue and others, Bolide impact triggered the late Triassic extinction event in equatorial Panthalassa, 2016, Nature Scientific Reports article 29609.
Rather than appearing only as instantaneous events in the fossil record, catastrophic extinctions can now be tracked through geological time. This graph traces marine sediment chemical isotopes, species diversity, and animal-origin silica production over a relatively brief period around the impact, 201 million years ago, of a large asteroid. Moving upwards from the lower edge of the graph, the time of impact is marked by the horizontal red line, after which there is a period of 300,000 years when the various measures of ecosystem health are dramatically perturbed. There was a simultaneous extinction of many land animals.
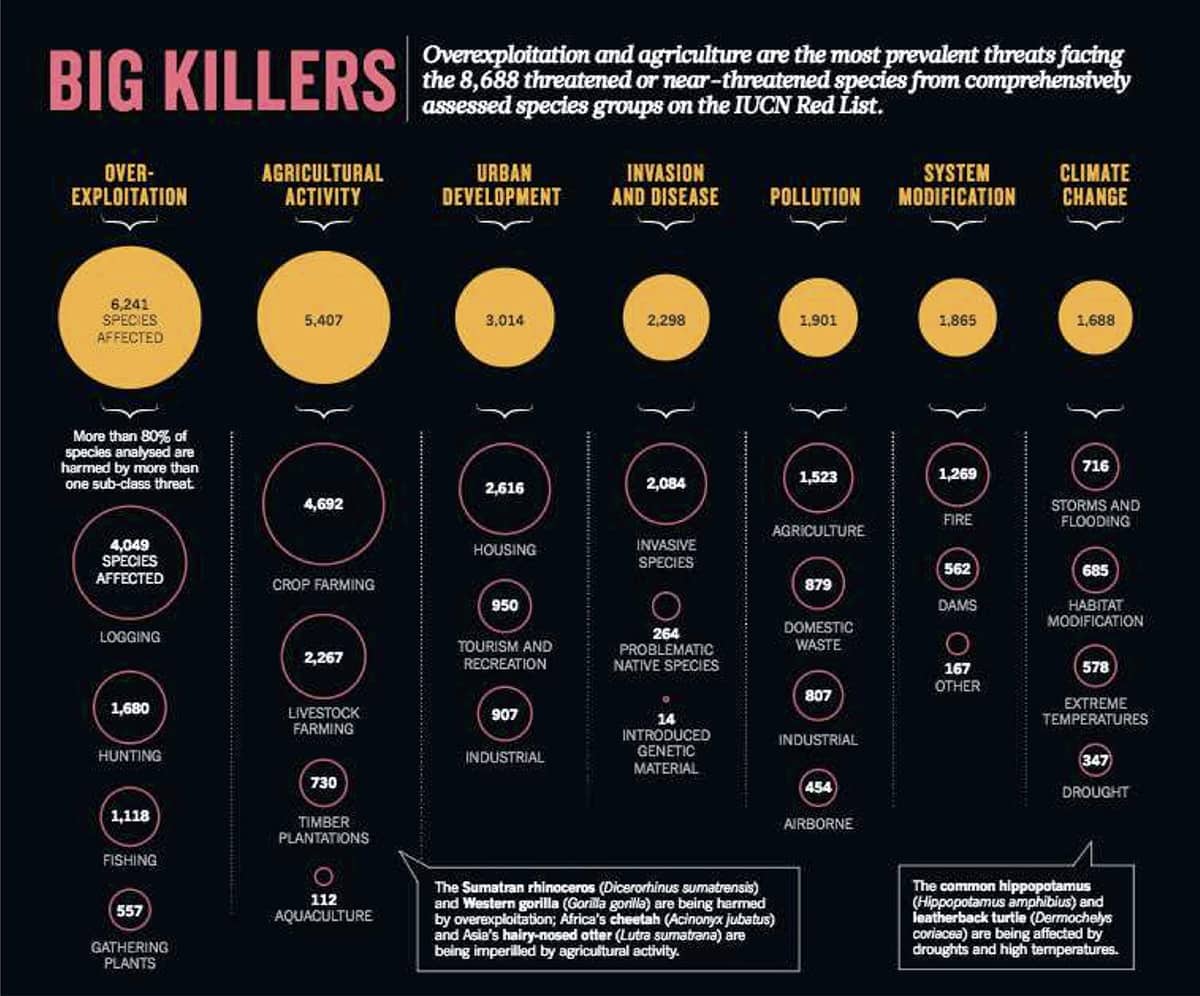
Sean Maxwell and others, Biodiversity: the ravages of guns, nets and bulldozers, 2016, Nature vol. 153–155.
We are currently living through another extinction, this one much more rapid, and caused by humans. This graphic summarizes our understanding of which human activities are threatening the most species.

Alejandro Estrada, Impending extinction crisis of the world’s primates, 2017, Science Advances vol. 3, article e1600946.
This is a hybrid diagram, a circular evolutionary ‘tree’ of the world’s primates, but also indicating their geographical location (blue/green/grey branch colour) and conservation status (yellow-red circumference colour). Man’s closest relatives, Gorilla and Pan (chimpanzee) are at the ‘half past seven’ position. A species is more likely to be at risk if a closely related species is at risk, suggesting that conservation interventions should be targeted partly on the basis of evolutionary relatedness.
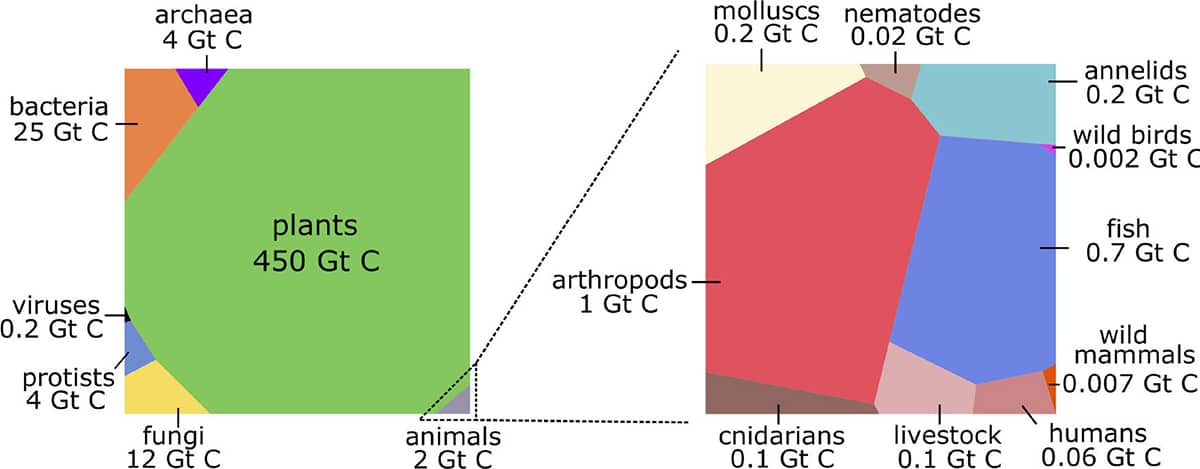
Yinon Bar-On and others, The biomass distribution on Earth, 2018, Proceedings of the National Academy of Sciences vol. 115, pp. 6506–6511.
One of the most fascinating zoological classifications was this recent assessment of the mass of living matter in the whole world. The authors estimate there is a total of 550 billion tonnes (550 gigatons) of carbon locked up in living organisms, but that only 2 gigatons of that resides in animals. Perhaps surprisingly, most of the Earth’s biomass is on land, mainly in the form of tree trunks – whereas most animal biomass is in the sea. The right-hand block represents animal biomass only, approximately half of which is arthropods (crustaceans, insects and spiders) and much of the rest is fish. Humans weigh ten times more than all wild mammals combined and thirty times more than all wild birds, but less than their own livestock.
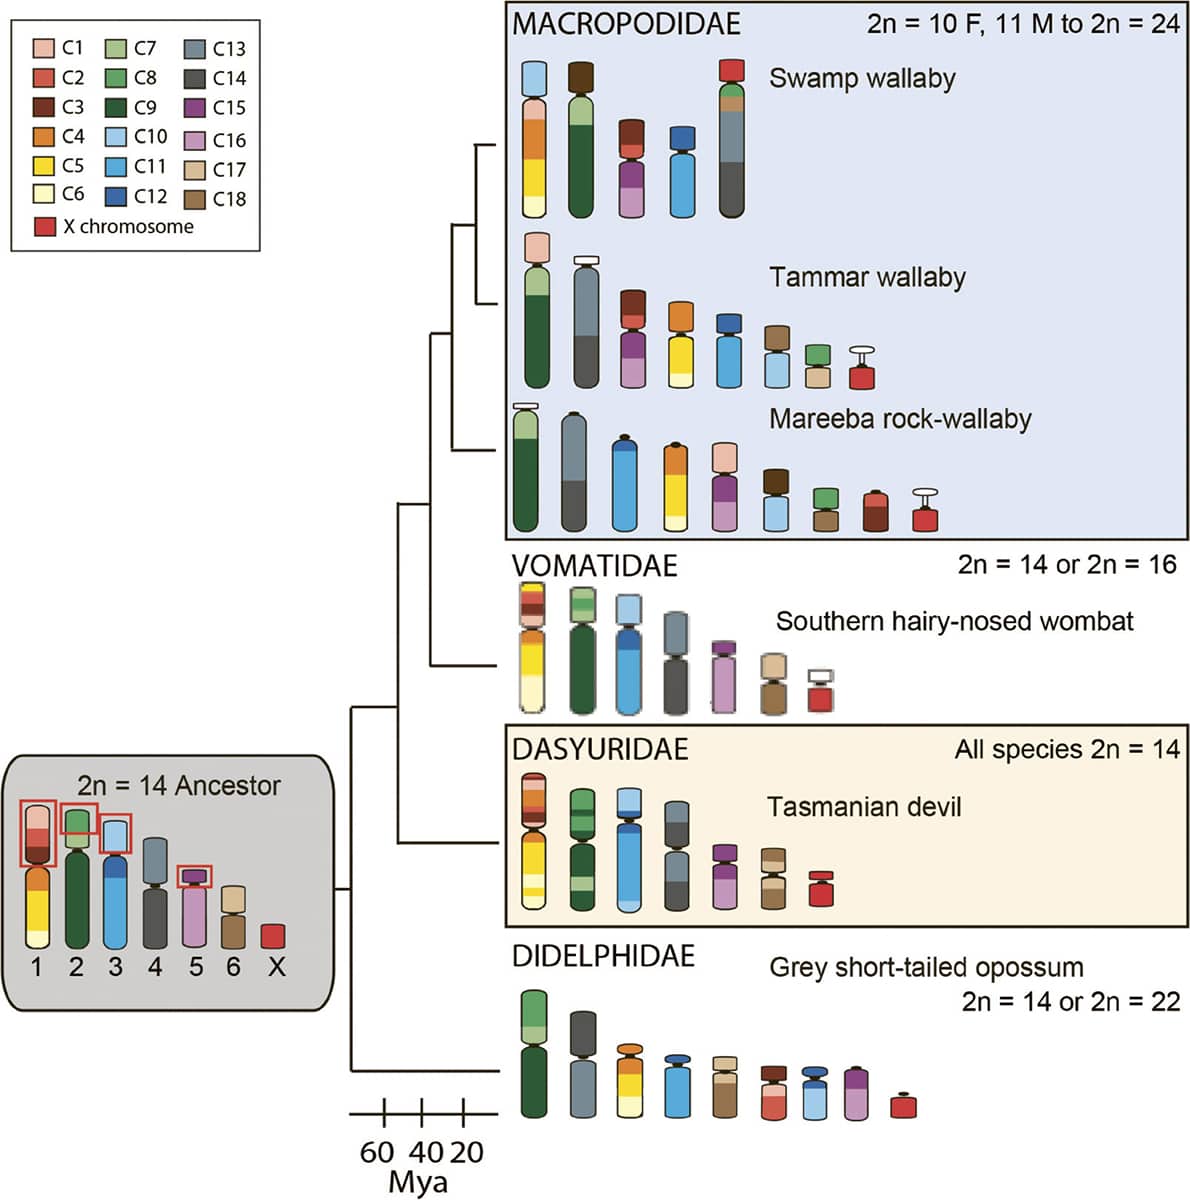
Janine Deakin, Chromosome evolution in marsupials, 2018, Genes vol. 9, p. 72.
Not only do animals and their genes evolve, but the structure of their chromosomes changes over time, too. However, the reasons why chromosomes may split, fuse and exchange segments are poorly understood. Indeed, we do not know why species possess particular numbers of chromosomes nor why certain genes are carried on certain chromosomes. This study was an attempt to use marsupials’ unusually large chromosomes to study their evolution. Some marsupial groups’ chromosomes have changed little over time, while others have undergone dramatic rearrangement, yet the reasons for these differences remain unclear. (Mya means ‘millions of years ago’.)

Jonatas Abraho, Tailed giant Tupanvirus possesses the most complete translational apparatus of the known virosphere, 2018, Nature Communications vol. 9, article 749.
A major challenge of modern molecular biology is coping with the sheer volume of data it generates, so novel computer-generated visual representations are being invented to render these data comprehensible. This image is from an analysis of a virus with an unusually large inventory of its own genes – most viruses have few genes of their own and instead use the machinery of their host cell to replicate. The Tupanvirus’s genes are mapped around the right-hand half of the circle, and are linked by arcing lines to the genes that most resemble them in the species on the left-hand side – other viruses (red); archaeans (pink); plants, fungi and animals (blue); and bacteria (green).
Interactive Tree of Life, 2019 (iTOL.embl.de).
Hosted by the European Molecular Biology Laboratory, the Interactive Tree of Life is not a single image, but an online tool to which scientists can upload their own taxonomic data and visualize it in a wide variety of formats, often visually appealing.

Graham Lawton, The truth about cheese, 2019, New Scientist vol. 3127.
It is now realized that keeping animals for food is one of the most important ways in which humans damage the environment. Adapted from the UN Food and Agriculture Organization’s assessment Tackling Climate Change through Livestock, this graph compares the mass of carbon dioxide generated in the production of one kilogram of different meat and dairy products. Animal-derived food is always less energy-efficient than plant-based food, as it comes from higher up the food-pyramid (see here). In addition, the microbes in ruminants’ stomachs produce methane, a more potent greenhouse gas than carbon dioxide.
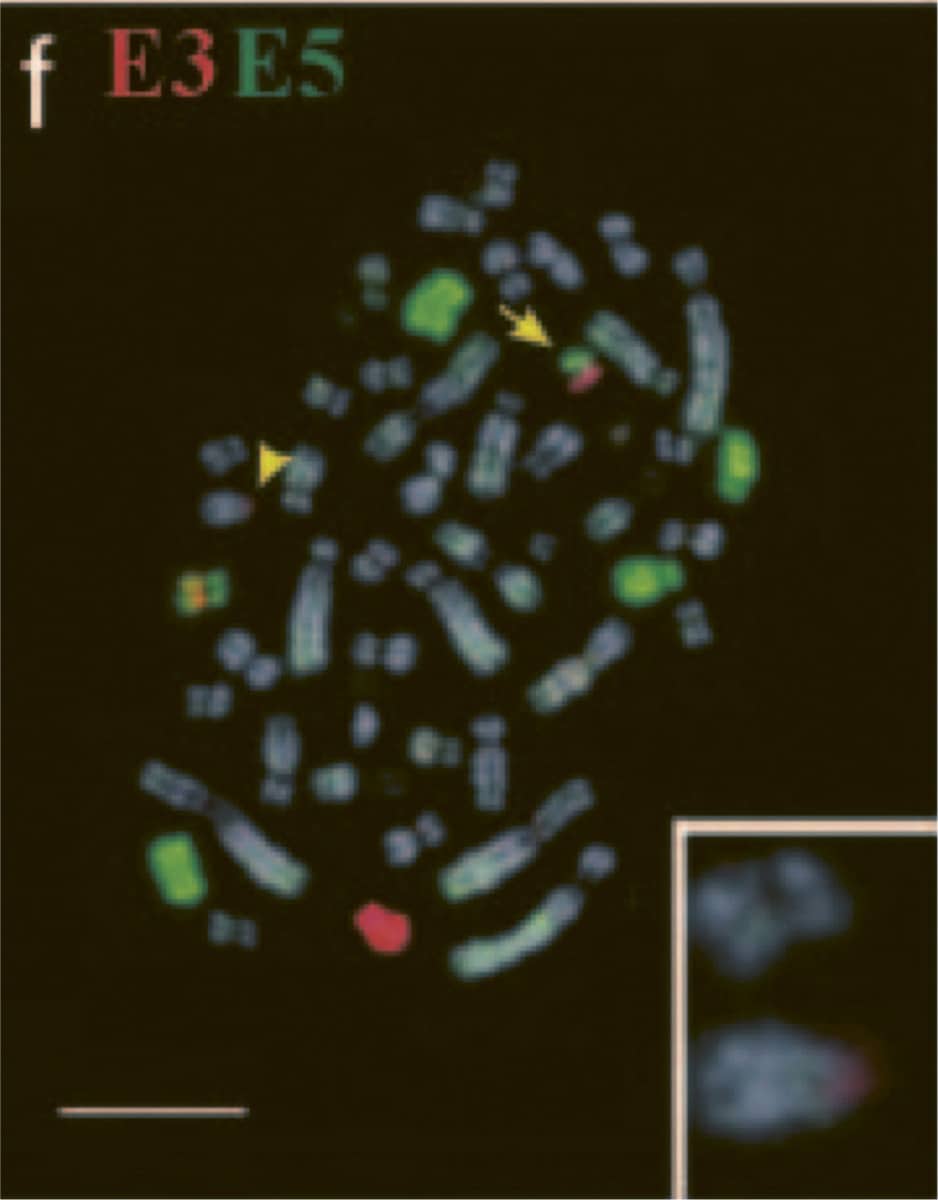
William Rens and others, Resolution and evolution of the duck-billed platypus karyotype with an X1Y1X2Y2X3Y3X4Y4X5Y5 male sex chromosome constitution, 2004, Proceedings of the National Academy of Sciences vol. 101, pp. 16257–16261.
The platypus continues to challenge biologists’ attempts to classify it. In most other mammals an individual’s sex is determined by its pair of sex chromosomes – females having two X chromosomes and males having an X and a Y. However, platypuses have a complex chromosome complement, including what appear to be five pairs of sex chromosomes, not one, and their arrangement and inheritance are complex. These images are from a study using a technique called ‘chromosome painting’ to identify which segments these ten chromosomes share. Other studies suggest that platypuses lack the key gene that drives development of the male sex in other mammals.
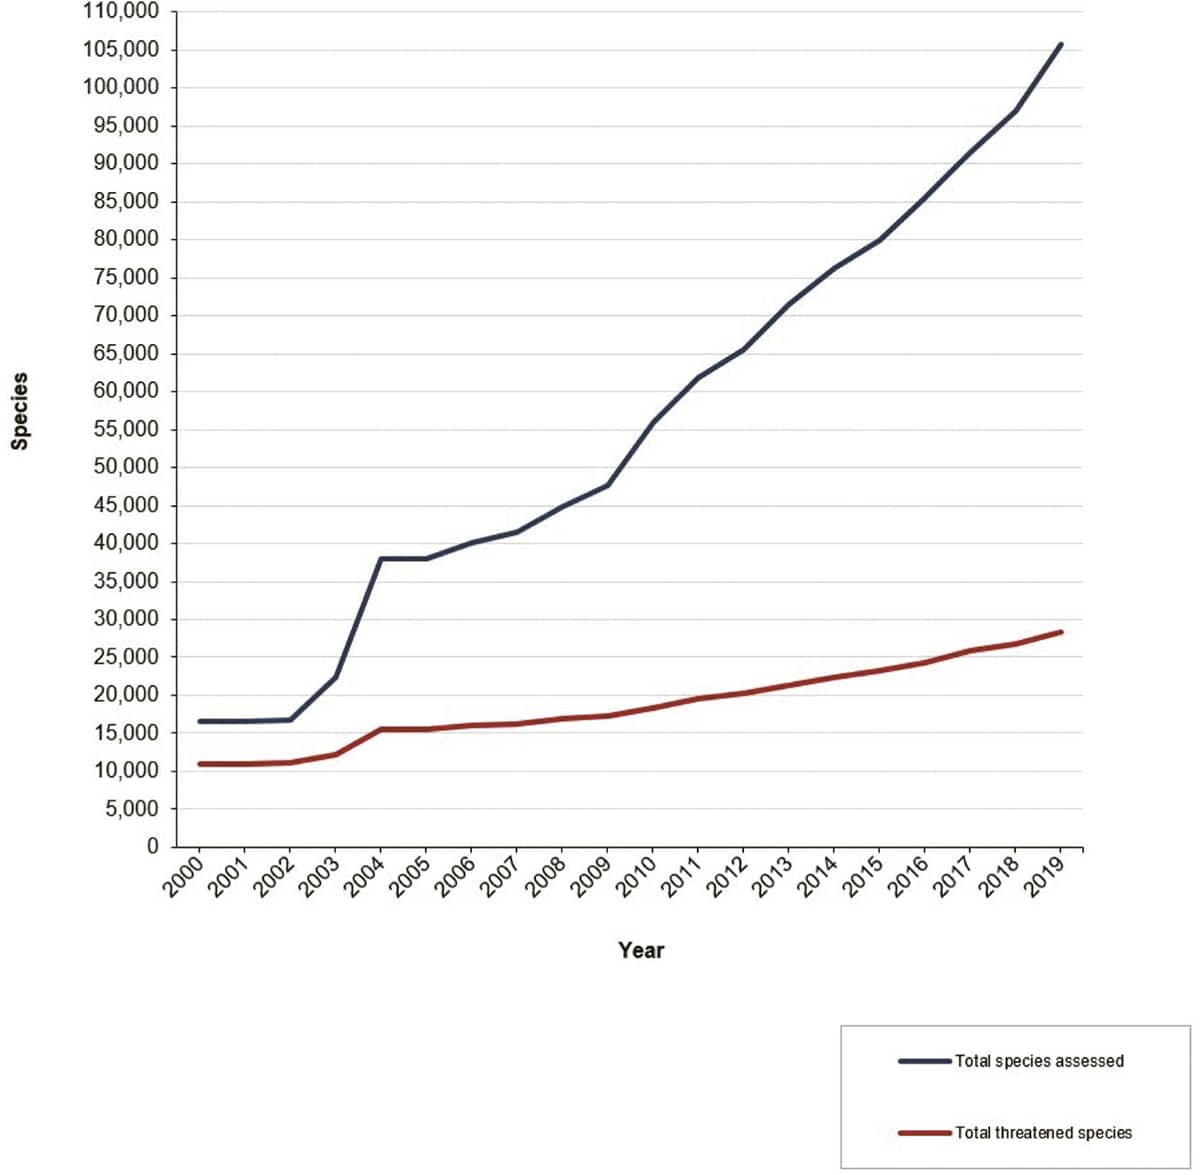
International Union for Conservation of Nature, IUCN Red List, 2019; Increase in the number of species assessed for The IUCN Red List of Threatened Species (2000–2019).
The IUCN regularly updates its list of the world’s threatened species, but these data are often misinterpreted. The red line on the graph is the number of species assessed as threatened over the last two decades. Some of the increase is due to continued loss of habitat and other manmade causes, but much of it is due to a steady increase in the size of the IUCN’s database (black line). The more species are assessed, the more species will be discovered to be threatened.
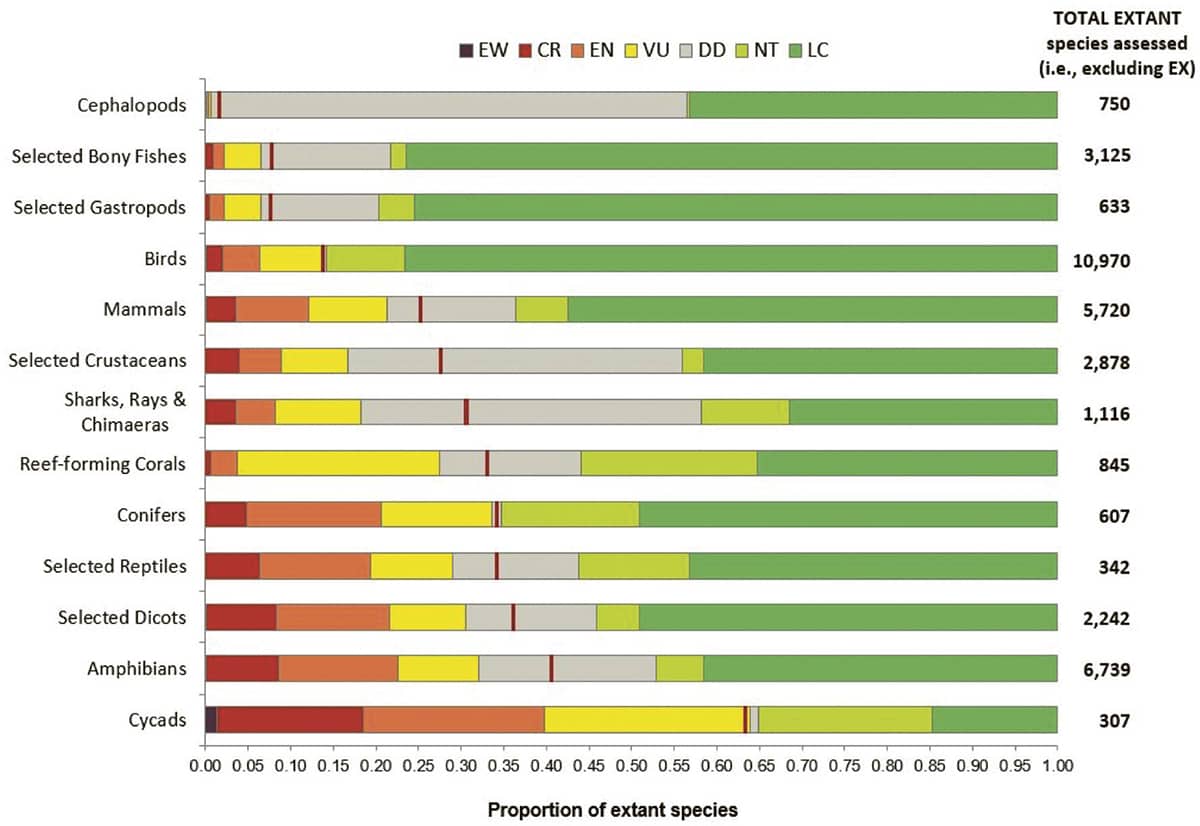
International Union for Conservation of Nature, IUCN Red List, 2019; The proportion of extant species in The IUCN Red List of Threatened Species.
Human activities do not threaten all animal groups equally. In this graph, each horizontal bar represents a taxonomic group of animals or plants, and is subdivided into colours according to the level of threat its constituent species have been assessed to face. EW (extinct in the wild); CR (critically endangered); EN (endangered); VU (vulnerable); DD (data deficient); NT (near threatened); LC (least concern).