
7 Planning and Conducting Surveys
 SIMPLE RANDOM SAMPLING
CHARACTERISTICS OF A WELL-DESIGNED, WELL-CONDUCTED SURVEY
SAMPLING ERROR
SOURCES OF BIAS
OTHER SAMPLING METHODS
Most data collection involves observational studies, not controlled experiments. Furthermore, while most data collection has some purpose, many studies come to mind after the data have been assembled and examined. For data collection to be useful, the resulting sample must be representative of the population under consideration.
How can a good, that is, a representative, sample be chosen? One technique would be to write the name of each member of the population on a card, mix the cards thoroughly in a large box, and pull out a specified number of cards. This method would give everyone in the population an equal chance of being selected as part of the sample. Unfortunately, this method is usually too time-consuming and too costly, and bias might still creep in if the mixing is not thorough. A simple random sample, that is, one in which every possible sample of the desired size has an equal chance of being selected, can more easily be obtained by assigning a number to everyone in the population and using a random number table or having a computer generate random numbers to indicate choices.
 EXAMPLE 7.1
Suppose 80 students are taking an AP Statistics course and the teacher wants to randomly pick out a sample of 10 students to try out a practice exam. She first assigns the students numbers 01, 02, 03, …, 80. Reading off two digits at a time from a random number table, she ignores any over 80 and ignores repeats, stopping when she has a set of ten. If the table began 75425 56573 90420 48642 27537 61036 15074 84675, she would choose the students numbered 75, 42, 55, 65, 73, 04, 27, 53, 76, and 10. Note that 90 and 86 are ignored because they are over 80, and the second and third occurrences of 42 are ignored because they are repeats.
CHARACTERISTICS OF A WELL-DESIGNED, WELL-CONDUCTED SURVEY
A well-designed survey always incorporates chance, such as using random numbers from a table or a computer. However, the use of probability techniques is not enough to ensure a representative sample. Often we don’t have a complete listing of the population, and so we have to be careful about exactly how we are applying “chance.” Even when subjects are picked by chance, they may choose not to respond to the survey or they may not be available to respond, thus calling into question how representative the final sample really is. The wording of the questions must be neutral—subjects give different answers depending on the phrasing.
EXAMPLE 7.2
Suppose we are interested in determining the percentage of adults in a small town who eat a nutritious breakfast. How about randomly selecting 100 numbers out of the telephone book, calling each one, and asking whether the respondent is intelligent enough to eat a nutritious breakfast every morning?
Answer: Random selection is good, but a number of questions should be addressed. For example, are there many people in the town without telephones or with unlisted numbers? How will the time of day the calls are made affect whether the selected people are reachable? If people are unreachable, will replacements be randomly chosen in the same way or will this lead to a certain class of people being underrepresented? Finally, even if these issues are satisfactorily addressed, the wording of the question is clearly not neutral—unless the phrase intelligent enough is dropped, answers will be almost meaningless.
SAMPLING ERROR: THE VARIATION INHERENT IN A SURVEY
No matter how well-designed and well-conducted a survey is, it still gives a sample statistic as an estimate for a population parameter. Different samples give different sample statistics, all of which are estimates for the same population parameter, and so error, called sampling error, is naturally present. This error can be described using probability; that is, we can say how likely we are to have a certain size error. Generally, the chance of this error occurring is smaller when the sample size is larger. However, the way the data are obtained is crucial—a large sample size cannot make up for a poor survey design or faulty collection techniques. Only a complete census can prevent sampling error; that is, whenever a sample is taken, sampling error will be present.
EXAMPLE 7.3
Each of four major news organizations surveys likely voters and separately reports that the percentage favoring the incumbent candidate is 53.4%, 54.1%, 52.0%, and 54.2%, respectively. What is the correct percentage? Did three or more of the news organizations make a mistake?
Answer: There is no way of knowing the correct population percentage from the information given. The four surveys led to four statistics, each an estimate of the population parameter. No one made a mistake unless there was a bad survey, for example, one without the use of chance, or not representative of the population, or with poor wording of the question. Sampling differences are natural.
TIP
Sampling error is to be expected, while bias is to be avoided.
Poorly designed sampling techniques result in bias, that is, in a tendency to favor the selection of certain members of a population. If a study is biased, size doesn’t help—a large sample size will simply result in a large worthless study. Think about bias before running a study, because once all the data comes in, there is no way to recover if the sample was biased. Sometimes pilot testing with a small sample will show bias that can be corrected before a larger sample is obtained. Although each of the following sources of bias is defined separately, there is overlap, and many if not most examples of bias involve more than one of the following.
HOUSEHOLD BIAS: When a sample includes only one member of any given household, members of large households are underrepresented. To respond to this, pollsters sometimes give greater weight to members of larger households.
NONRESPONSE BIAS: A good example is that of most mailed questionnaires, as they tend to have very low response percentages, and it is often unclear which part of the population is responding. Sometimes people chosen for a survey simply refuse to respond or are unreachable or too difficult to contact. Answering machines and caller ID prevent easy contacts. To maximize response rates, one can use multiple follow-up contacts and cash or other incentives. Also, short, easily understood surveys generally have higher response rates.
QUOTA SAMPLING BIAS: This results when interviewers are given free choice in picking people, for example, to obtain a particular percentage men, a particular percentage Catholic, or a particular percentage African-American. This flawed technique resulted in misleading polls leading to the Chicago Tribune making an early incorrect call of Thomas E. Dewey as the winner over Harry S. Truman in the 1948 presidential election.
RESPONSE BIAS: The very question itself can lead to misleading results. People often don’t want to be perceived as having unpopular or unsavory views and so may respond untruthfully when face to face with an interviewer or when filling out a questionnaire that is not anonymous. Patients may lie about following doctors’ orders, dieters may be dishonest about how strictly they’ve followed a weight loss program, students may shade the truth about how many hours they’ve studied for exams, and viewers may not want to admit they they watch certain television programs.
SELECTION BIAS: An often-cited example is the Literary Digest opinion poll that predicted a landslide victory for Alfred Landon over Franklin D. Roosevelt in the 1936 presidential election. The Digest surveyed people with cars and telephones, but in 1936 only the wealthy minority, who mainly voted Republican, had cars and telephones. In spite of obtaining more than two million responses, the Digest picked a landslide for the wrong man!
TIP
Think about potential bias before collecting data.
SIZE BIAS: Throwing darts at a map to decide in which states to sample would bias in favor of geographically large states. Interviewing people checking out of the hospital would bias in favor of patients with short stays, since due to costs, more people today have shorter stays. Having each student pick one coin out of a bag of 1000 coins to help estimate the total monetary value of the coins in the bag would bias in favor of large coins, for example, quarters over dimes.
UNDERCOVERAGE BIAS: This happens when there is inadequate representation. For example, telephone surveys simply ignore all those possible subjects who don’t have telephones. In the 2008 presidential election surveys, phone surveys went only to land line phones, leaving out many young adults who have only cell phones. Another example is convenience samples, like interviews at shopping malls, which are based on choosing individuals who are easy to reach. These interviews tend to produce data highly unrepresentative of the entire population. Door-to-door household surveys typically miss college students and prison inmates, as well as the homeless.
VOLUNTARY RESPONSE BIAS: Samples based on individuals who offer to participate typically give too much emphasis to people with strong opinions. For example, radio call-in programs about controversial topics such as gun control, abortion, and school segregation do not produce meaningful data on what proportion of the population favor or oppose related issues. Online surveys posted to websites are a modern source of voluntary response bias.
WORDING BIAS: Nonneutral or poorly worded questions may lead to answers that are very unrepresentative of the population. To avoid such bias, do not use leading questions, and write questions that are clear and relatively short. Also be careful of sequences of questions that lead respondents toward certain answers.
Note: Again, it should be understood that there is considerable overlap among the above classifications. For example, a nonneutral question may be said to have both response bias and wording bias. Selection bias and undercoverage bias often go hand in hand. Voluntary response bias and nonresponse bias are clearly related.
Time- and cost-saving modifications are often used to implement sampling procedures other than simple random samples.
Systematic sampling involves listing the population in some order (for example, alphabetically), choosing a random point to start, and then picking every tenth (or hundredth, or thousandth, or kth) person from the list. This gives a reasonable sample as long as the original order of the list is not in any way related to the variables under consideration.
TIP
Know the difference between strata and clusters.
In stratified sampling the population is divided into homogeneous groups called strata, and random samples of persons from all strata are chosen. For example, we can stratify by age or gender or income level or race and pick a sample of people from each stratum. Note that all individuals in a given stratum have a characteristic in common. We could further do proportional sampling, where the sizes of the random samples from each stratum depend on the proportion of the total population represented by the stratum.
In cluster sampling the population is divided into heterogeneous groups called clusters, and we then take a random sample of clusters from among all the clusters. For example, to survey high school seniors we could randomly pick several senior class homerooms in which to conduct our study. Note that each cluster should resemble the entire population.
Multistage sampling refers to a procedure involving two or more steps, each of which could involve any of the various sampling techniques. The Gallup organization often follows a procedure in which nationwide locations are randomly selected, then neighborhoods are randomly selected in each of these locations, and finally households are randomly selected in each of these neighborhoods.
EXAMPLE 7.4
Suppose a sample of 100 high school students from a school of size 5000 is to be chosen to determine their views on the death penalty. One method would be to have each student write his or her name on a slip of paper, put the papers in a box, and have the principal reach in and pull out 100 of the papers. However, questions could arise regarding how well the papers are mixed up in the box. For example, how might the outcome be affected if all students in one homeroom toss in their names at the same time so that their papers are clumped together? Another method would be to assign each student a number from 1 to 5000 and then use a random number table, picking out four digits at a time and tossing out repeats and numbers over 5000 (simple random sampling). What are alternative procedures?
Answer: From a list of the students, the surveyor could simply note every fiftieth name (systematic sampling). Since students in each class have certain characteristics in common, the surveyor could use a random selection method to pick 25 students from each of the separate lists of freshmen, sophomores, juniors, and seniors (stratified sampling). The researcher could separate the homerooms by classes; then randomly pick five freshmen homerooms, five sophomore homerooms, five junior homerooms, and five senior homerooms (cluster sampling); and then randomly pick five students from each of the homerooms (multistage sampling). The surveyor could separately pick random samples of males and females (stratified sampling), the size of each of the two samples chosen according to the proportion of male and female students attending the school (proportional sampling).
It should be noted that none of the alternative procedures in the above example result in a simple random sample because every possible sample of size 100 does not have an equal chance of being selected.
SUMMARY
 A simple random sample (SRS) is one in which every possible sample of the desired size has an equal chance of being selected.
Sampling error is not an error, but rather refers to the natural variability between samples.
Bias is the tendency to favor the selection of certain members of a population.
Nonresponse bias occurs when a large fraction of those sampled do not respond (most mailed questionnaires are good examples).
Response bias happens when the question itself leads to misleading results (for example, people don’t want to be perceived as having unpopular, unsavory, or illegal views).
Undercoverage bias occurs when part of the population is ignored (for example, telephone surveys miss all those without phones).
Voluntary response bias occurs when individuals choose whether to respond (for example, radio call-in surveys).
Systematic sampling involves listing the population, choosing a random point to start, and then picking every nth person for some n.
Stratified sampling involves dividing the population into homogeneous groups called strata and then picking random samples from each of the strata.
Cluster sampling involves dividing the population into heterogeneous groups called clusters, and then picking everyone in a random sample of the clusters.
Multistage sampling refers to procedures involving two or more steps, each of which could involve any of the sampling techniques.
QUESTIONS ON TOPIC SEVEN: PLANNING AND CONDUCTING SURVEYS
Multiple-Choice Questions
Directions: The questions or incomplete statements that follow are each followed by five suggested answers or completions. Choose the response that best answers the question or completes the statement.
1. Ann Landers, who wrote a daily advice column appearing in newspapers across the country, once asked her readers, “If you had it to do over again, would you have children?” Of the more than 10,000 readers who responded, 70% said no. What does this show?
(A) The survey is meaningless because of voluntary response bias.
(B) No meaningful conclusion is possible without knowing something more about the characteristics of her readers.
(C) The survey would have been more meaningful if she had picked a random sample of the 10,000 readers who responded.
(D) The survey would have been more meaningful if she had used a control group.
(E) This was a legitimate sample, randomly drawn from her readers and of sufficient size to allow the conclusion that most of her readers who are parents would have second thoughts about having children.
2. Which of the following is a true statement?
(A) If bias is present in a sampling procedure, it can be overcome by dramatically increasing the sample size.
(B) There is no such thing as a “bad sample.”
(C) Sampling techniques that use probability techniques effectively eliminate bias.
(D) Convenience samples often lead to undercoverage bias.
(E) Voluntary response samples often underrepresent people with strong opinions.
3. Two possible wordings for a questionnaire on gun control are as follows:
I. The United States has the highest rate of murder by handguns among all countries. Most of these murders are known to be crimes of passion or crimes provoked by anger between acquaintances. Are you in favor of a 7-day cooling-off period between the filing of an application to purchase a handgun and the resulting sale?
II. The United States has one of the highest violent crime rates among all countries. Many people want to keep handguns in their homes for self-protection. Fortunately, U.S. citizens are guaranteed the right to bear arms by the Constitution. Are you in favor of a 7-day waiting period between the filing of an application to purchase a needed handgun and the resulting sale?
One of these questions showed that 25% of the population favored a 7-day waiting period between application for purchase of a handgun and the resulting sale, while the other question showed that 70% of the population favored the waiting period. Which produced which result and why?
(A) The first question probably showed 70% and the second question 25% because of the lack of randomization in the choice of pro-gun and anti-gun subjects as evidenced by the wording of the questions.
(B) The first question probably showed 25% and the second question 70% because of a placebo effect due to the wording of the questions.
(C) The first question probably showed 70% and the second question 25% because of the lack of a control group.
(D) The first question probably showed 25% and the second question 70% because of response bias due to the wording of the questions.
(E) The first question probably showed 70% and the second question 25% because of response bias due to the wording of the questions.
4. Each of the 29 NBA teams has 12 players. A sample of 58 players is to be chosen as follows. Each team will be asked to place 12 cards with its players’ names into a hat and randomly draw out two names. The two names from each team will be combined to make up the sample. Will this method result in a simple random sample of the 348 basketball players?
(A) Yes, because each player has the same chance of being selected.
(B) Yes, because each team is equally represented.
(C) Yes, because this is an example of stratified sampling, which is a special case of simple random sampling.
(D) No, because the teams are not chosen randomly.
(E) No, because not each group of 58 players has the same chance of being selected.
5. To survey the opinions of bleacher fans at Wrigley Field, a surveyor plans to select every one-hundredth fan entering the bleachers one afternoon. Will this result in a simple random sample of Cub fans who sit in the bleachers?
(A) Yes, because each bleacher fan has the same chance of being selected.
(B) Yes, but only if there is a single entrance to the bleachers.
(C) Yes, because the 99 out of 100 bleacher fans who are not selected will form a control group.
(D) Yes, because this is an example of systematic sampling, which is a special case of simple random sampling.
(E) No, because not every sample of the intended size has an equal chance of being selected.
6. Which of the following is a true statement about sampling error?
(A) Sampling error can be eliminated only if a survey is both extremely well designed and extremely well conducted.
(B) Sampling error concerns natural variation between samples, is always present, and can be described using probability.
(C) Sampling error is generally larger when the sample size is larger.
(D) Sampling error implies an error, possibly very small, but still an error, on the part of the surveyor.
(E) Sampling error is higher when bias is present.
7. What fault do all these sampling designs have in common?
I. The Wall Street Journal plans to make a prediction for a presidential election based on a survey of its readers.
II. A radio talk show asks people to phone in their views on whether the United States should pay off its huge debt to the United Nations.
III. A police detective, interested in determining the extent of drug use by teenagers, randomly picks a sample of high school students and interviews each one about any illegal drug use by the student during the past year.
(A) All the designs make improper use of stratification.
(B) All the designs have errors that can lead to strong bias.
(C) All the designs confuse association with cause and effect.
(D) None of the designs satisfactorily controls for sampling error.
(E) None of the designs makes use of chance in selecting a sample.
8. A state auditor is given an assignment to choose and audit 26 companies. She lists all companies whose name begins with A, assigns each a number, and uses a random number table to pick one of these numbers and thus one company. She proceeds to use the same procedure for each letter of the alphabet and then combines the 26 results into a group for auditing. Which of the following is a true statement?
(A) Each company has an equal probability of being audited.
(B) Each set of 26 companies has an equal chance of being selected.
(C) Her procedure results in a simple random sample.
(D) Her procedure doesn’t truly make use of chance.
(E) She could have used a calculator random number generator in place of using a random number table to achieve similar results.
9. A researcher planning a survey of heads of households in a particular state has census lists for each of the 23 counties in that state. The procedure will be to obtain a random sample of heads of households from each of the counties rather than grouping all the census lists together and obtaining a sample from the entire group. Which of the following is an incorrect statement about the resulting stratified sample?
(A) It is not a simple random sample.
(B) It is easier and less costly to obtain than a simple random sample.
(C) It gives comparative information that a simple random sample wouldn’t give.
(D) A cluster sample would have been more appropriate.
(E) Differences in county sizes could be taken into account by making the size of the random sample from each county depend on the proportion of the total population represented by the county.
10. To find out the average occupancy size of student-rented apartments, a researcher picks a simple random sample of 100 such apartments. Even after one follow-up visit, the interviewer is unable to make contact with anyone in 27 of these apartments. Concerned about nonresponse bias, the researcher chooses another simple random sample and instructs the interviewer to continue this procedure until contact is made with someone in a total of 100 apartments. The average occupancy size in the final 100-apartment sample is 2.78. Is this estimate probably too low or too high?
(A) Too low, because of undercoverage bias.
(B) Too low, because convenience samples overestimate average results.
(C) Too high, because of undercoverage bias.
(D) Too high, because convenience samples overestimate average results.
(E) Too high, because voluntary response samples overestimate average results.
11. To conduct a survey of long-distance calling patterns, a researcher opens a telephone book to a random page, closes his eyes, puts his finger down on the page, and then reads off the next 50 names. Which of the following is incorrect?
(A) The survey design incorporates chance.
(B) Assuming the page and starting point on the page are randomly selected, each person in the phone book has an equal chance of being selected.
(C) The procedure could easily result in selection bias.
(D) The procedure does not result in a simple random sample.
(E) This is the typical methodology of a systematic sample.
12. Consider the following three events:
I. Although 18% of the student body are minorities, in a random sample of 20 students, 5 are minorities.
II. In a survey about sexual habits, an embarrassed student deliberately gives the wrong answers.
III. A surveyor mistakenly records answers to one question in the wrong space.
Which of the following correctly characterizes the above?
(A) I, sampling error; II, response bias; III, human mistake
(B) I, sampling error; II, nonresponse bias; III, hidden error
(C) I, hidden bias; II, voluntary sample bias; III, sampling error
(D) I, undercoverage error; II, voluntary error; III, unintentional error
(E) I, small sample error; II, deliberate error; III, mistaken error
13. A researcher plans a study to examine the depth of belief in God among the adult population. He obtains a simple random sample of 100 adults as they leave church one Sunday morning. All but one of them agree to participate in the survey. Which of the following is a true statement?
(A) Proper use of chance as evidenced by the simple random sample makes this a well-designed survey.
(B) The high response rate makes this a well-designed survey.
(C) Selection bias makes this a poorly designed survey.
(D) The validity of this survey depends on whether or not the adults attending this church are representative of all churches.
(E) The validity of this survey depends upon whether or not similar numbers of those surveyed are male and female.
Free-Response Questions
Directions: You must show all work and indicate the methods you use. You will be graded on the correctness of your methods and on the accuracy of your final answers.
SEVEN OPEN-ENDED QUESTIONS
1. Cell phones emit a form of electromagnetic radiation, and there is a concern on how this affects the human body. A World Health Organization (WHO) study of 12,000 people found no connection between moderate cell phone use and brain cancer, although the report does mention a higher incidence of brain cancer for heavy users (defined as those who used their phone for at least half an hour a day). A study of 420,095 persons in Denmark found no correlation between length of cell phone subscriptions (in years) and brain tumor incidence.
(a) Were these studies observational studies or experiments or one of each? Explain.
(b) Does the WHO study definition of “heavy users” seem reasonable? Explain.
(c) Neither study tries to distinguish between voice or text messaging use of the cell phone. Should this have any affect on conclusions? Explain.
(d) What is a weakness in the Denmark study that the WHO study does take into account?
2. A questionnaire is being designed to determine whether most people are or are not in favor of legislation protecting the habitat of the spotted owl. Give two examples of poorly worded questions, one biased toward each response.
3. To obtain a sample of 25 students from among the 500 students present in school one day, a surveyor decides to pick every twentieth student waiting in line to attend a required assembly in the gym.
(a) Explain why this procedure will not result in a simple random sample of the students present that day.
(b) Describe a procedure that will result in a simple random sample of the students present that day.
4. A hot topic in government these days is welfare reform. Suppose a congresswoman wishes to survey her constituents concerning their opinions on whether the federal government should turn welfare over to the states. Discuss possible sources of bias with regard to the following four options: (1) conducting a survey via random telephone dialing into her district, (2) sending out a mailing using a registered voter list, (3) having a pollster interview everyone who walks past her downtown office, and (4) broadcasting a radio appeal urging interested citizens in her district to call in their opinions to her office.
5. You and nine friends go to a restaurant and check your coats. You all forget to pick up the ticket stubs, and so when you are ready to leave, Hilda, the hatcheck girl, randomly gives each of you one of the ten coats. You are surprised that one person actually receives the correct coat. You would like to explore this further and decide to use a random number table to simulate the situation. Describe how the random number table can be used to simulate one trial of the coat episode. Explain what each of the digits 0 through 9 will represent.
6.
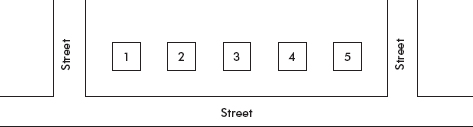
You are supposed to interview the residents of two of the above five houses.
(a) How would you choose which houses to interview?
(b) You plan to visit the homes at 9 a.m. If someone isn’t home, explain the reasons for and against substituting another house.
(c) Are there any differences you might expect to find among the residents based on the above sketch?
7. A cable company plans to survey potential customers in a small city currently served by satellite dishes. Two sampling methods are being considered. Method A is to randomly select a sample of 25 city blocks and survey every family living on those blocks. Method B is to randomly select a sample of families from each of the five natural neighborhoods making up the city.
(a) What is the statistical name for the sampling technique used in Method A, and what is a possible reason for using it rather than an SRS?
(b) What is the statistical name for the sampling technique used in Method B, and what is a possible reason for using it rather than an SRS?
AN INVESTIGATIVE TASK
A basic problem in ecology is to estimate the number of animals in a wildlife population. Suppose a wildlife management team captures and tags 27 deer in a state forest. The deer are released and given time to mingle with the deer population. One month later a second capture is made of 20 deer, among which 3 are noted to be tagged from the original capture.
(a) Assuming that the number of tagged individuals within the second sample is proportional to the number of tagged individuals in the whole population, estimate the total number of deer in the forest.
(b) A formula for variance of this estimate is 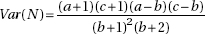 where N = estimate of total population size, a = number of animals originally captured and tagged, b = number of tagged animals who are recaptured, and c = number of animals in second sample. What is the standard deviation for the population size estimate above?
(c) Given the answers to (a) and (b), would it be unexpected for the true deer population to be 225? Explain and show your work.
(d) What would a more accurate population estimate be, if it took into account that 6 of the tagged deer were shot by hunters before they could rejoin with the herd?