
10 Combining Independent Random Variables
 MEANS AND VARIANCES FOR SUMS AND DIFFERENCES OF SETS
MEANS AND VARIANCES FOR SUMS AND DIFFERENCES OF INDEPENDENT RANDOM VARIABLES
In many experiments, a pair of numbers is associated with each outcome. This situation leads to a study of pairs of random variables. When the random variables are independent, there is an easy calculation for finding both the mean and standard deviation of the sum (and difference) of the two random variables.
MEANS AND VARIANCES FOR SUMS AND DIFFERENCES OF SETS
 EXAMPLE 10.1
A casino offers couples at the hotel free chips—each person reaches into a bag and pulls out a card stating the number of free chips—one person’s bag has a set of four cards with X = {1, 9, 20, 74}; the other person’s bag has a set of three cards with Y = {5, 15, 55}. Note that the mean of set X is 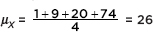 and that of set
  What is the average amount they should be able to pool together?
Answer: Form the set W of sums: W = {1 + 5, 1 + 15, 1 + 55, 9 + 5, 9 + 15, 9 + 55, 20 + 5, 20 + 15, 20 + 55, 74 + 5, 74 + 15, 74 + 55} = {6, 16, 56, 14, 24, 64, 25, 35, 75, 79, 89, 129} and

We note that µW = µX + Y = µX + µY.
In general, the mean of a set of sums is equal to the sum of the means of the two original sets. Even more generally, if a sum is formed by picking one element from each of several sets, the mean of such sums is simply the sum of the means of the various sets.
How is the variance of W related to the variances of the original sets?
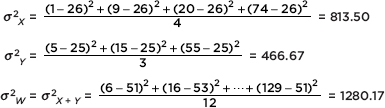
Note that  2W = 2X + Y = 2X + 2Y.
This is true for the variance of any set of sums. More generally, if a sum is formed by picking one element from each of several sets, the variance of such sums is simply the sum of the variances of the various sets.
We can also calculate the standard deviation 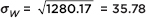 and conclude the average pooled number of chips received by a couple is 51 with a standard deviation of 35.78.
EXAMPLE 10.2
In Example 10.1, what is the average difference in number of chips received from bag X and bag Y?
Answer: Form the set of differences: Z = {1 – 5, 1 – 15, 1 – 55, 9 – 5, 9 – 15, 9 – 55, 20 – 5, 20 – 15, 20 – 55, 74 – 5, 74 – 15, 74 – 55} = {–4, –14, –54, 4, –6, –46, 15, 5, –35, 69, 59, 19}
A quick calculation gives µZ = 1. Note that µZ = µX – Y = µX – µY = 26 – 25 = 1. In general, the mean of a set of differences is equal to the difference of the means of the two original sets.
How is the variance of Z related to the variance of the original sets?
A calculation (for example, using 1-Var Stats on the TI-84) yields 2Z = 1280.17. Wow, the set of differences has the same variance as the set of sums! We have, 2Z = 2X – Y = 2X + 2Y. More generally, if a total is formed by a procedure that adds or subtracts one element from each of several independent sets, the variance of the resulting totals is simply the sum of the variances of the several sets.
Not only can we sum variances as shown above to calculate total variance, but we can also reverse the process and determine how the total variance is split up among its various sources. For example, we can find what portion of the variance in numbers of sales made by a company’s sales representatives is due to the individual salesperson, what portion is due to the territory, what portion is due to the particular products sold by each salesperson, and so on.
EXAMPLE 10.3
A company’s sports shoes sell for an average of $100 with a standard deviation of $9. The costs going into their sports shoes are as follows:
Retail store costs and profits: average of $45 with a standard deviation of $5.
Brand company costs and profits: average of $24 with a standard deviation of $4.
Advertising and publicity costs: average of $11 with a standard deviation of $3.
Assuming these various costs are independent of one another, what is the mean and standard deviation for the remaining costs R together (which includes materials, transportation, factory worker wages, etc.)?
Answer: 45 + 24 + 11 + µR = 100 gives µR = $20; and 52 + 42 + 32 + 2R = 92 gives 2R = 31 and 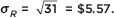
MEANS AND VARIANCES FOR SUMS AND DIFFERENCES OF INDEPENDENT RANDOM VARIABLES
The mean of the sum (or difference) of two random variables is equal to the sum (or difference) of the individual means. If two random variables are independent, the variance of the sum (or difference) of the two random variables is equal to the sum of the two individual variances.
TIP
Variances of independent random variables add, but standard deviations don’t!
EXAMPLE 10.4
An insurance salesperson estimates the numbers of new auto and home insurance policies she sells per day as follows:
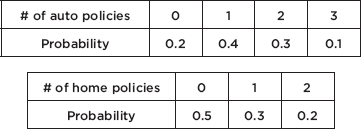
What is the expected value or mean for the overall number of policies sold per day?
Answer: µauto = (0)(0.2) + (1)(0.4) + (2)(0.3) + (3)(0.1) = 1.3,
µhome = (0)(0.5) + (1)(0.3) + (2)(0.2) = 0.7, and so
µtotal = µauto + µhome = 1.3 + 0.7 = 2.0.
Assuming the selling of new auto policies is independent of the selling of new home policies (which may not be true if some new customers buy both), what would be the standard deviation in the number of new policies sold per day?
Answer: 2auto = (0 – 1.3)2(0.2) + (1 – 1.3)2(0.4) + (2 – 1.3)2(0.3) + (3 – 1.3)2(0.1) = 0.81,2home = (0 – 0.7)2(0.5) + (1 – 0.7)2(0.3) + (2 – 0.7)2(0.2) = 0.61, and so, assuming independence, 2total = 2auto + 2home = 0.81 + 0.61 = 1.42 and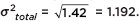
EXAMPLE 10.5
Vitamin C megadoses are claimed by alternative medicine advocates to have effects on diseases such as cancer and AIDS, as well as on the common cold. In one long-term study, participants received either a placebo or a 200-mg Vitamin C tablet each day. Suppose that the mean compliance rate was 73% with a standard deviation of 24%. Furthermore, the daily intake of Vitamin C through foods among the adult population is 94 g with a standard deviation of 39 g. Among those receiving the supplement, what is the mean and standard deviation for their daily Vitamin C intake?
Answer: With a compliance of 73%, the mean intake of Vitamin C from the supplement is (0.73)(200) = 146 with a standard deviation of (0.24)(200) = 48. Thus, the total mean intake of Vitamin C is 146 + 94 = 240 g with a standard deviation of 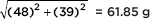 (with independence, variances add!).
EXAMPLE 10.6
Suppose the mean SAT math, critical reading, and writing scores for students at a particular high school are 515, 501, and 493, respectively, with standard deviations of 65, 40, and 38. What can be said about the mean and standard deviation of the three combined scores for these students?
Answer: The mean combined score is 515 + 501 + 493 = 1509. Can we add the three variances, 652 + 402 + 382 and then take the square root to obtain the desired standard deviation? No, because we don’t have independence—students with high scores on one of the three sections will tend to have high scores on the other two sections. The standard deviation of the combined scores cannot be calculated from the given information.
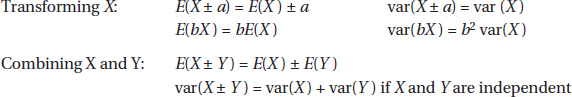
For random variables X and Y the generalizations for transforming X and for combining X and Y are sometimes written as
Does it make sense that variances add for both sums and differences of independent random variables? Ranges may illustrate this point more clearly: suppose prices for primary residences in a community go from $210,000 to $315,000, while prices for summer cottages go from $50,000 to $120,000. Someone wants to purchase a primary residence and a summer cottage. The minimum total spent will be $260,000, the maximum possible is $435,000, and thus the range for the total is $435,000 – $260,000 = $175,000. The minimum difference spent between the two homes will be $90,000, the maximum difference will be $265,000, and thus the range for the difference is $265,000 – $90,000 = $175,000, the same as the range for the total. (Variances and ranges are both measures of spread and behave the same way with regard to the above rule.)
SUMMARY
 When combining two random variables, E(X + Y) = E(X) + E(Y) and E(X – Y) = E(X) – E(Y).
When combining two independent random variables, the variances always add: var(X ± Y) = var(X) + var(Y).
QUESTIONS ON TOPIC TEN: COMBINING INDEPENDENT RANDOM VARIABLES
Multiple-Choice Questions
Directions: The questions or incomplete statements that follow are each followed by five suggested answers or completions. Choose the response that best answers the question or completes the statement.
1. An auto dealer offers discounts averaging $2,450 with a standard deviation of $575. If 50 autos are sold during one month, what is the expected value and standard deviation for the total discounts given?
(A) E(Total) | = $17,324 | SD(Total) | = $170 |
(B) E(Total) | = $17,324 | SD(Total) | = $4066 |
(C) E(Total) | = $122,500 | SD(Total) | = $170 |
(D) E(Total) | = $122,500 | SD(Total) | = $4066 |
(E) E(Total) | = $122,500 | SD(Total) | = $28,750 |
2. An auto dealer pays an average of $8,750 with a standard deviation of $1,200 for used car trade-ins, and sells new cars for an average of $28,500 with a standard deviation of $3,100. Assuming independence of trade-in and new car prices for a customer, what is the standard deviation of the revenue the dealer should expect to make if a customer trades in a used car and buys a new one?
(A) 
(B) 
(C) 
(D) 
(E) 3100 – 1200 dollars
3. Suppose a retailer knows that the mean number of broken eggs per carton is 0.3 with a standard deviation of 0.18. In a shipment of 100 cartons, what is the expected number of broken eggs and what is the standard deviation? Assume independence between cartons.
(A) E(broken) | = 3 | SD(broken) | = 1.8 |
(B) E(broken) | = 30 | SD(broken) | = 1.8 |
(C) E(broken) | = 30 | SD(broken) | = 18 |
(D) E(broken) | = 300 | SD(broken) | = 18 |
(E) E(broken) | = 300 | SD(broken) | = 180 |
4. Science majors in college pay an average of $650 per year for books with a standard deviation of $130, whereas English majors pay an average of $465 per year for books with a standard deviation of $90. What is the mean difference and standard deviation between the amounts paid for books by science and English majors?
(A) E(Diff) | = $92.50 | SD(Diff) | = $15 |
(B) E(Diff) | = $185 | SD(Diff) | = $110 |
(C) E(Diff) | = $185 | SD(Diff) | = $158 |
(D) E(Diff) | = $185 | SD(Diff) | = $220 |
(E) E(Diff) | = $557.50 | SD(Diff) | = $110 |
5. The auditor working for a veterinary clinic calculates that the mean annual cost of medical care for dogs is $98 with a standard deviation of $25 and that the mean annual cost of medical care for pets is $212 with an average deviation of $39 for owners who have one dog and one cat. Assuming expenses for dogs and cats are independent for those owning both a dog and a cat, what is the mean annual cost of medical care for cats, and what is the standard deviation?
(A) E(Cats) | = $114 | SD(Cats) | = $14 |
(B) E(Cats) | = $114 | SD(Cats) | = $46 |
(C) E(Cats) | = $114 | SD(Cats) | = $30 |
(D) E(Cats) | = $155 | SD(Cats) | = $32 |
(E) E(Cats) | = $188 | SD(Cats) | = $30 |
6. A home theater projector system technician knows that based on past experience, for unpacking, assembly, and fine tuning, the mean total setup time is 5.6 hours with a standard deviation of 0.886 hours. The times for the three steps are independent, the mean and standard deviation for the unpacking time are 1.5 hours and 0.2 hours, and for the assembly time are 2.8 hours and 0.85 hours, respectively. What are the mean and standard deviation for the fine tuning time?
(A) E(Fine tuning) | = 1.3 hr | SD(Fine tuning) | = 0.15 hr |
(B) E(Fine tuning) | = 1.3 hr | SD(Fine tuning) | = 1.24 hr |
(C) E(Fine tuning) | = 2.15 hr | SD(Fine tuning) | = 0.164 hr |
(D) E(Fine tuning) | = 2.15 hr | SD(Fine tuning) | = 1.24 hr |
(E) E(Fine tuning) | = 4.61 hr | SD(Fine tuning) | = 0.15 hr |
7. Boxes of 50 “donut holes” weigh an average of 16.0 ounces with a standard deviation of 0.245 ounces. If the empty boxes alone weigh an average of 1.0 ounce with a standard deviation of 0.2 ounces, what are the mean and standard deviation of donut hole weights?
(A) E(Donut hole) | = 0.3 oz | SD(Donut hole) | = 0.0063 oz |
(B) E(Donut hole) | = 0.3 oz | SD(Donut hole) | = 0.02 oz |
(C) E(Donut hole) | = 0.3 oz | SD(Donut hole) | = 0.142 oz |
(D) E(Donut hole) | = 15 oz | SD(Donut hole) | = 0.142 oz |
(E) E(Donut hole) | = 15 oz | SD(Donut hole) | = 0.445 oz |
AN INVESTIGATIVE TASK
Directions: You must show all work and indicate the methods you use. You will be graded on the correctness of your methods and on the accuracy of your final answers.
Two researchers at a consumer protection agency ran independent surveys to estimate mean debt of graduating college bachelor’s degree recipients. The first researcher selected a random sample of 800 bachelor’s degree recipients; the second researcher selected a random sample of 600 bachelor’s degree recipients from public schools and 200 from private schools. Summary statistics are as follows:
First researcher:
|
n |
Mean |
Standard |
|
Debt at graduation |
800 |
$16,300 |
$7800 |
Second researcher:
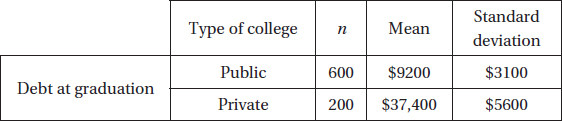
The first researcher used x as an estimator for the mean debt of all bachelor’s degree recipients, and the second researcher used xoverall = (0.75) xpublic + (0.25) xprivate as an estimator for the mean debt of all bachelor’s degree recipients.
(a) For the first researcher, based on the summary statistics, calculate the standard error of the sampling distribution of x.
(b) For the second researcher, based on the summary statistics, calculate the standard error of the sampling distribution of xoverall.
(c) Explain why, based on the summary statistics, it was expected that the answer to (b) would be smaller than the answer to (a).