For reference only.

SECTION I
Questions 1–40
Spend 90 minutes on this part of the exam.
Directions: The questions or incomplete statements that follow are each followed by five suggested answers or completions. Choose the response that best answers the question or completes the statement.
1. Which of the following is a true statement?
(A) While properly designed experiments can strongly suggest cause-and-effect relationships, a complete census is the only way of establishing such a relationship.
(B) If properly designed, observational studies can establish cause-and-effect relationships just as strongly as properly designed experiments.
(C) Controlled experiments are often undertaken later to establish cause-and-effect relationships first suggested by observational studies.
(D) A useful approach to overcome bias in observational studies is to increase the sample size.
(E) In an experiment, the control group is a self-selected group who choose not to receive a designated treatment.
2. Two classes take the same exam. Suppose a certain score is at the 40th percentile for the first class and at the 80th percentile for the second class. Which of the following is the most reasonable conclusion?
(A) Students in the first class generally scored higher than students in the second class.
(B) Students in the second class generally scored higher than students in the first class.
(C) A score at the 20th percentile for the first class is at the 40th percentile for the second class.
(D) A score at the 50th percentile for the first class is at the 90th percentile for the second class.
(E) One of the classes has twice the number of students as the other.
3. In an experiment, the control group should receive
(A) treatment opposite that given the experimental group.
(B) the same treatment given the experimental group without knowing they are receiving the treatment.
(C) a procedure identical to that given the experimental group except for receiving the treatment under examination.
(D) a procedure identical to that given the experimental group except for a random decision on receiving the treatment under examination.
(E) none of the procedures given the experimental group.
4. In a random sample of Toyota car owners, 83 out of 112 said they were satisfied with the Toyota front-wheel drive, while in a similar survey of Subaru owners, 76 out of 81 said they were satisfied with the Subaru four-wheel drive. A 90% confidence interval estimate for the difference in proportions between Toyota and Subaru car owners who are satisfied with their drive systems is reported to be –0.197 ± 0.081. Which is a proper conclusion?
(A) The interval is invalid because probabilities cannot be negative.
(B) The interval is invalid because it does not contain zero.
(C) Subaru owners are approximately 19.7% more satisfied with their drive systems than are Toyota owners.
(D) 90% of Subaru owners are approximately 19.7% more satisfied with their drive systems than are Toyota owners.
(E) We are 90% confident that the difference in proportions between Toyota and Subaru car owners who are satisfied with their drive systems is between –0.278 and –0.116.
5. In a study on the effect of music on worker productivity, employees were told that a different genre of background music would be played each day and the corresponding production outputs noted. Every change in music resulted in an increase in production. This is an example of
(A) the effect of a treatment unit.
(B) the placebo effect.
(C) the control group effect.
(D) sampling error.
(E) voluntary response bias.
6. A computer manufacturer sets up three locations to provide technical support for its customers. Logs are kept noting whether or not calls about problems are solved successfully. Data from a sample of 1000 calls are summarized in the following table:
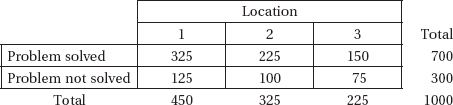
Assuming there is no association between location and whether or not a problem is resolved successfully, what is the expected number of successful calls (problem solved) from location 1?
(A) 
(B) 
(C) 
(D) 
(E) 
7. Which of the following statements about the correlation coefficient is true?
(A) The correlation coefficient and the slope of the regression line may have opposite signs.
(B) A correlation of 1 indicates a perfect cause-and-effect relationship between the variables.
(C) Correlations of +0.87 and –0.87 indicate the same degree of clustering around the regression line.
(D) Correlation applies equally well to quantitative and categorical data.
(E) A correlation of 0 shows little or no association between two variables.
8. Suppose X and Y are random variables with E(X) = 780, var(X) = 75, E(Y) = 430, and var(Y) = 25. Given that X and Y are independent, what is the variance of the random variable X – Y?
(A) 75 – 25
(B) 75 + 25
(C) 
(D) 
(E) 
9. What is a sample?
(A) A measurable characteristic of a population
(B) A set of individuals having a characteristic in common
(C) A value calculated from raw data
(D) A subset of a population
(E) None of the above
10. A histogram of the cholesterol levels of all employees at a large law firm is as follows:
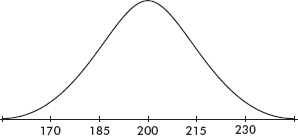
Which of the following is the best estimate of the standard deviation of this distribution?
(A) 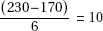
(B) 15
(C) 
(D) 230 – 170 = 60
(E) 245 – 155 = 90
11. A soft drink dispenser can be adjusted to deliver any fixed number of ounces. If the machine is operating with a standard deviation in delivery equal to 0.3 ounce, what should be the mean setting so that a 12-ounce cup will overflow less than 1% of the time? Assume a normal distribution for ounces delivered.
(A) 11.23 ounces
(B) 11.30 ounces
(C) 11.70 ounces
(D) 12.70 ounces
(E) 12.77 ounces
12. An insurance company wishes to study the number of years drivers in a large city go between automobile accidents. They plan to obtain and analyze the data from a sample of drivers. Which of the following is a true statement?
(A) A reasonable time-and-cost-saving procedure would be to use systematic sampling on an available list of all AAA (Automobile Association of America) members in the city.
(B) A reasonable time-and-cost-saving procedure would be to randomly choose families and include all drivers in each of these families in the sample.
(C) To determine the mean number of years between accidents, randomness in choosing a sample of drivers is not important as long as the sample size is very large.
(D) The larger a simple random sample, the more likely its standard deviation will be close to the population standard deviation divided by the square root of the sample size.
(E) None of the above are true statements.
13. The probability that a person will show a certain gene-transmitted trait is 0.8 if the father shows the trait and 0.06 if the father doesn’t show the trait. Suppose that the children in a certain community come from families in 25% of which the father shows the trait. Given that a child shows the trait, what is the probability that her father shows the trait?
(A) 0.245
(B) 0.250
(C) 0.750
(D) 0.816
(E) 0.860
14. Given an experiment with H0 : µ = 10, Ha : µ > 10, and a possible correct value of 11, which of the following increases as n increases?
I. The probability of a Type I error.
II. The probability of a Type II error.
III. The power of the test.
(A) I only
(B) II only
(C) III only
(D) II and III
(E) None will increase.
15. If all the values of a data set are the same, all of the following must equal zero except for which one?
(A) Mean
(B) Standard deviation
(C) Variance
(D) Range
(E) Interquartile range
16. To determine the average number of minutes it takes to manufacture one unit of a new product, an assembly line manager tracks a random sample of 15 units and records the number of minutes it takes to make each unit. The assembly times are assumed to have a normal distribution. If the mean and standard deviation of the sample are 3.92 and 0.45 minutes respectively, which of the following gives a 90% confidence interval for the mean assembly time, in minutes, for units of the new product?
(A) 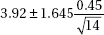
(B) 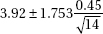
(C) 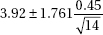
(D) 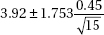
(E) 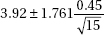
17. A company has 1000 employees evenly distributed throughout five assembly plants. A sample of 30 employees is to be chosen as follows. Each of the five managers will be asked to place the 200 time cards of their respective employees in a bag, shake them up, and randomly draw out six names. The six names from each plant will be put together to make up the sample. Will this method result in a simple random sample of the 1000 employees?
(A) Yes, because every employee has the same chance of being selected.
(B) Yes, because every plant is equally represented.
(C) Yes, because this is an example of stratified sampling, which is a special case of simple random sampling.
(D) No, because the plants are not chosen randomly.
(E) No, because not every group of 30 employees has the same chance of being selected.
18. Given that P(E) = 0.32, P(F) = 0.15, and P(E  F) = 0.048, which of the following is a correct conclusion?
(A) The events E and F are both independent and mutually exclusive.
(B) The events E and F are neither independent nor mutually exclusive.
(C) The events E and F are mutually exclusive but not independent.
(D) The events E and F are independent but not mutually exclusive.
(E) The events E and F are independent, but there is insufficient information to determine whether or not they are mutually exclusive.
19. The number of leasable square feet of office space available in a city on any given day has a normal distribution with mean 640,000 square feet and standard deviation 18,000 square feet. What is the interquartile range for this distribution?
(A) 652,000 – 628,000
(B) 658,000 – 622,000
(C) 667,000 – 613,000
(D) 676,000 – 604,000
(E) 694,000 – 586,000
20. Consider the following back-to-back stemplot:
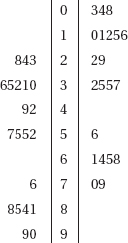
Which of the following is a correct statement?
(A) The distributions have the same mean.
(B) The distributions have the same median.
(C) The interquartile range of the distribution to the left is 20 greater than the interquartile range of the distribution to the right.
(D) The distributions have the same variance.
(E) None of the above is correct.
21. Which of the following is a correct statement?
(A) A study results in a 99% confidence interval estimate of (34.2, 67.3). This means that in about 99% of all samples selected by this method, the sample means will fall between 34.2 and 67.3.
(B) A high confidence level may be obtained no matter what the sample size.
(C) The central limit theorem is most useful when drawing samples from normally distributed populations.
(D) The sampling distribution for a mean has standard deviation  only when n is sufficiently large (typically one uses n
  30).
30).
(E) The center of any confidence interval is the population parameter.
22. The binomial distribution is an appropriate model for which of the following?
(A) The number of minutes in an hour for which the Dow-Jones average is above its beginning average for the day.
(B) The number of cities among the 10 largest in New York State for which the weather is cloudy for most of a given day.
(C) The number of drivers wearing seat belts if 10 consecutive drivers are stopped at a police roadblock.
(D) The number of A’s a student receives in his/her five college classes.
(E) None of the above.
23. Suppose two events, E and F, have nonzero probabilities p and q, respectively. Which of the following is impossible?
(A) p + q > 1
(B) p – q < 0
(C) p/q > 1
(D) E and F are neither independent nor mutually exclusive.
(E) E and F are both independent and mutually exclusive.
24. An inspection procedure at a manufacturing plant involves picking four items at random and accepting the whole lot if at least three of the four items are in perfect condition. If in reality 90% of the whole lot are perfect, what is the probability that the lot will be accepted?
(A) (0.9)4
(B) 1 – (0.9)4
(C) 4(0.9)3(0.1)
(D) 0.1 – 4(0.9)3(0.1)
(E) 4(0.9)3(0.1) + (0.9)4
25. A town has one high school, which buses students from urban, suburban, and rural communities. Which of the following samples is recommended in studying attitudes toward tracking of students in honors, regular, and below-grade classes?
(A) Convenience sample
(B) Simple random sample (SRS)
(C) Stratified sample
(D) Systematic sample
(E) Voluntary response sample
26. Suppose there is a correlation of r = 0.9 between number of hours per day students study and GPAs. Which of the following is a reasonable conclusion?
(A) 90% of students who study receive high grades.
(B) 90% of students who receive high grades study a lot.
(C) 90% of the variation in GPAs can be explained by variation in number of study hours per day.
(D) 10% of the variation in GPAs cannot be explained by variation in number of study hours per day.
(E) 81% of the variation in GPAs can be explained by variation in number of study hours per day.
27. To determine the average number of children living in single-family homes, a researcher picks a simple random sample of 50 such homes. However, even after one follow-up visit the interviewer is unable to make contact with anyone in 8 of these homes. Concerned about nonresponse bias, the researcher picks another simple random sample and instructs the interviewer to keep trying until contact is made with someone in a total of 50 homes. The average number of children is determined to be 1.73. Is this estimate probably too low or too high?
(A) Too low, because of undercoverage bias.
(B) Too low, because convenience samples overestimate average results.
(C) Too high, because of undercoverage bias.
(D) Too high, because convenience samples overestimate average results.
(E) Too high, because voluntary response samples overestimate average results.
28. The graph below shows cumulative proportions plotted against land values (in dollars per acre) for farms on sale in a rural community.
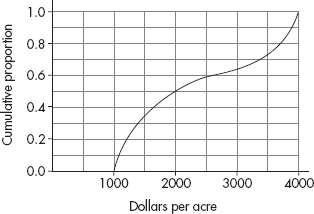
What is the median land value?
(A) $2000
(B) $2250
(C) $2500
(D) $2750
(E) $3000
29. An experiment is to be conducted to determine whether taking fish oil capsules or garlic capsules has more of an effect on cholesterol levels. In past studies it was noted that daily exercise intensity (low, moderate, high) is associated with cholesterol level, but average sleep length (< 5, 5 – 8, > 8 hours) is not associated with cholesterol level. This experiment should be done
(A) by blocking on exercise intensity
(B) by blocking on sleep length
(C) by blocking on cholesterol level
(D) by blocking on capsule type
(E) without blocking
30. A confidence interval estimate is determined from the monthly grocery expenditures in a random sample of n families. Which of the following will result in a smaller margin of error?
I. A smaller confidence level
II. A smaller sample standard deviation
III. A smaller sample size
(A) II only
(B) I and II
(C) I and III
(D) II and III
(E) I, II, and III
31. A medical research team claims that high vitamin C intake increases endurance. In particular, 1000 milligrams of vitamin C per day for a month should add an average of 4.3 minutes to the length of maximum physical effort that can be tolerated. Army training officers believe the claim is exaggerated and plan a test on an SRS of 400 soldiers in which they will reject the medical team’s claim if the sample mean is less than 4.0 minutes. Suppose the standard deviation of added minutes is 3.2. If the true mean increase is only 4.2 minutes, what is the probability that the officers will fail to reject the false claim of 4.3 minutes?
(A) 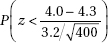
(B) 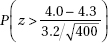
(C) 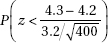
(D) 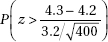
(E) 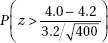
32. Consider the two sets X = {10, 30, 45, 50, 55, 70, 90} and Y = {10, 30, 35, 50, 65, 70, 90}. Which of the following is false?
(A) The sets have identical medians.
(B) The sets have identical means.
(C) The sets have identical ranges.
(D) The sets have identical boxplots.
(E) None of the above are false.
33. The weight of an aspirin tablet is 300 milligrams according to the bottle label. An FDA investigator weighs a simple random sample of seven tablets, obtains weights of 299, 300, 305, 302, 299, 301, and 303, and runs a hypothesis test of the manufacturer’s claim. Which of the following gives the P-value of this test?
(A) P(t > 1.54) with df = 6
(B) 2P(t > 1.54) with df = 6
(C) P(t > 1.54) with df = 7
(D) 2P(t > 1.54) with df = 7
(E) 0.5P(t > 1.54) with df = 7
34. A teacher believes that giving her students a practice quiz every week will motivate them to study harder, leading to a greater overall understanding of the course material. She tries this technique for a year, and everyone in the class achieves a grade of at least C. Is this an experiment or an observational study?
(A) An experiment, but with no reasonable conclusion possible about cause and effect
(B) An experiment, thus making cause and effect a reasonable conclusion
(C) An observational study, because there was no use of a control group
(D) An observational study, but a poorly designed one because randomization was not used
(E) An observational study, and thus a reasonable conclusion of association but not of cause and effect
35. Which of the following is not true with regard to contingency tables for chi-square tests for independence?
(A) The categories are not numerical for either variable.
(B) Observed frequencies should be whole numbers.
(C) Expected frequencies should be whole numbers.
(D) Expected frequencies in each cell should be at least 5, and to achieve this, one sometimes combines categories for one or the other or both of the variables.
(E) The expected frequency for any cell can be found by multiplying the row total by the column total and dividing by the sample size.
36. Which of the following is a correct statement?
(A) The probability of a Type II error does not depend on the probability of a Type I error.
(B) In conducting a hypothesis test, it is possible to simultaneously make both a Type I and a Type II error.
(C) A Type II error will result if one incorrectly assumes the data are normally distributed.
(D) In medical disease testing with the null hypothesis that the patient is healthy, a Type I error is associated with a false negative; that is, the test incorrectly indicates that the patient is disease free.
(E) When you choose a significance level α, you’re setting the probability of a Type I error to exactly α.
37.
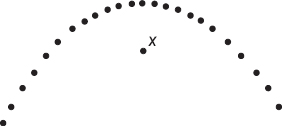
Above is a scatterplot with one point labeled X. Suppose you find the least squares regression line. Which of the following is a correct statement?
(A) X has the largest residual, in absolute value, of any point on the scatterplot.
(B) X is an influential point.
(C) The residual plot will show a curved pattern.
(D) The association between the x and y variables is very weak.
(E) If the point X were removed, the correlation would be 1.
38. A banking corporation advertises that 90% of the loan applications it receives are approved within 24 hours. In a random sample of 50 applications, what is the expected number of loan applications that will be turned down?
(A) 50(0.90)
(B) 50(0.10)
(C) 50(0.90)(0.10)
(D) 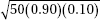
(E) 
39. The parallel boxplots below show monthly rainfall summaries for Liberia, West Africa.
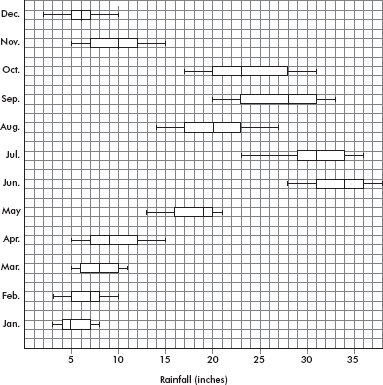
Which of the following months has the least variability as measured by interquartile range?
(A) January
(B) February
(C) March
(D) May
(E) December
40. In comparing the life expectancies of two models of refrigerators, the average years before complete breakdown of 10 model A refrigerators is compared with that of 15 model B refrigerators. The 90% confidence interval estimate of the difference is (6, 12). Which of the following is the most reasonable conclusion?
(A) The mean life expectancy of one model is twice that of the other.
(B) The mean life expectancy of one model is 6 years, while the mean life expectancy of the other is 12 years.
(C) The probability that the life expectancies are different is 0.90.
(D) The probability that the difference in life expectancies is greater than 6 years is 0.90.
(E) We should be 90% confident that the difference in life expectancies is between 6 and 12 years.

If there is still time remaining, you may review your answers.
SECTION II
Part A
QUESTIONS 1–5
Spend about 65 minutes on this part of the exam.
Percentage of Section II grade—75
Directions: You must show all work and indicate the methods you use. You will be graded on the correctness of your methods and on the accuracy of your results and explanations.
1. The Information Technology Services division at a university is considering installing a new spam filter software product on all campus computers to combat unwanted advertising and spyware. A sample of 60 campus computers was randomly divided into two groups of 30 computers each. One group of 30 was considered to be a control group, while each computer in the other group had the spam filter software installed. During a two-week period each computer user was instructed to keep track of the number of unwanted spam e-mails received. The back-to-back stemplot below shows the distribution of such e-mails received for the control and treatment groups.
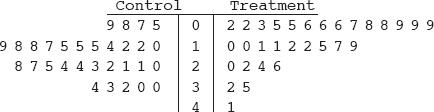
(a) Compare the distribution of spam e-mails from the control and treatment groups.
(b) The standard deviation of the numbers of e-mails in the control group is 8.1. How does this value summarize variability for the control group data?
(c) A researcher in Information Technology Services calculates a 95% confidence interval for the difference in mean number of spam e-mails received between the control group and the treatment group with the new software and obtains (1.5, 10.9). Assuming all conditions for a two-sample t-interval are met, comment on whether or not there is evidence of a difference in the means for the number of spam e-mails received during a two-week period by computers with and without the software.
(d) The computer users on campus fall into four groups: administrators, staff, faculty, and students. Explain why a researcher might decide to use blocking in setting up this experiment.
2. A game contestant flips three fair coins and receives a score equal to the absolute value of the difference between the number of heads and number of tails showing.
(a) Construct the probability distribution table for the possible scores in this game.
(b) Calculate the expected value of the score for a player.
(c) What is the probability that if a player plays this game three times the total score will be 3?
(d) Suppose a player wins a major prize if he or she can average a score of at least 2. Given the choice, should he or she try for this average by playing 10 times or by playing 15 times? Explain.
3. A high school has a room set aside after school for students to play games. The attendance data are summarized in the following table.
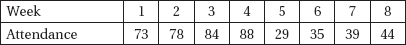
A student plugs these data into his calculator and comes up with:

(a) Interpret the slope of the regression line in context. Does this seem to adequately explain the data? Why or why not?
Another student points out that during the first 4 weeks the school allowed computer games, but then the policy changed.
(b) Give a more appropriate regression analysis modeling attendance in terms of week. Include correlation and interpretation of slope in your analysis.
(c) Explain the above results in terms of a scatterplot.
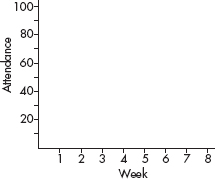
4. State investigators believe that a particular auto repair facility is fraudulently charging customers for repairs they don’t need. As part of their investigation they pick a random sample of ten damaged cars, do their own cost estimate for repair work, and then send the cars to the facility under suspicion for an estimate. The data obtained are shown in the table below.
Is the mean estimate of the facility under suspicion significantly greater than the mean estimate by the investigators? Justify your answer.
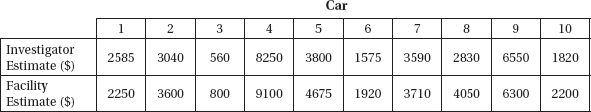
5. Five new estimators are being evaluated with regard to quality control in manufacturing professional baseballs of a given weight. Each estimator is tested every day for a month on samples of sizes n = 10, n = 20, and n = 40. The baseballs actually produced that month had a consistent mean weight of 146 grams. The distributions given by each estimator are as follows:
(a) Which of the above appear to be unbiased estimators of the population parameter? Explain.
(b) Which of the above exhibits the lowest variability for n = 40? Explain.
(c) Which of the above is the best estimator if the selected estimator will eventually be used with a sample of size n = 100? Explain.
SECTION II
Part B
QUESTION 6
Spend about 25 minutes on this part of the exam.
Percentage of Section II grade—25
6. Dose intensity in chemotherapy is a balance between minimizing adverse side effects and maximizing therapeutic effect of the treatment. A study is performed on a random sample of 800 patients with stage 4 colon cancer to determine the relationship between nausea (a side effect of most types of chemotherapy) and dosage of an experimental chemotherapy agent. Each patient is randomly placed in one of eight groups, each group receiving a different dose intensity, and the numbers of patients experiencing severe nausea are noted. The table below summarizes the data collected.
|
Dose intensity (mg/week) |
Number of patients |
Number experiencing severe nausea |
Proportion experiencing severe nausea |
|
10 |
110 |
34 |
0.31 |
|
15 |
105 |
15 |
0.14 |
|
20 |
85 |
22 |
0.26 |
|
25 |
95 |
17 |
0.18 |
|
50 |
100 |
47 |
0.47 |
|
55 |
95 |
54 |
0.57 |
|
60 |
110 |
42 |
0.38 |
|
65 |
100 |
62 |
0.62 |
(a) A medical researcher notes that a total of 205 out of 405 patients given higher doses ( 50 mg/week) experienced severe nausea, while only 88 of the 395 patients given lower doses (≤ 25 mg/week) experienced severe nausea. Do these data support that a greater proportion of patients receiving higher doses experience severe nausea than patients receiving lower doses?
(b) Another researcher thinks there is more of a relation between dose intensity and proportion experiencing severe nausea than one can see by simply looking at low and high doses. She runs a regression analysis with the following computer output.
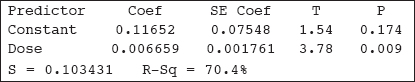
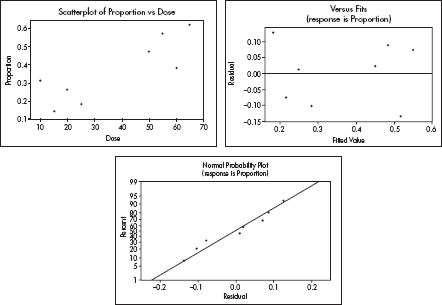
Find a 95% confidence interval for the slope of the regression line, and interpret your answer in context.
(c) A researcher plans to interview five patients randomly chosen from among the 800 participants in this experiment. What is the probability that a majority of those chosen will have experienced severe nausea?
If there is still time remaining, you may review your answers.