For reference only.

SECTION I
Questions 1–40
Spend 90 minutes on this part of the exam.
Directions: The questions or incomplete statements that follow are each followed by five suggested answers or completions. Choose the response that best answers the question or completes the statement.
1. The mean and standard deviation of the population {1, 5, 8, 11, 15} are µ = 8 and σ = 4.8, respectively. Let S be the set of the 125 ordered triples (repeats allowed) of elements of the original population. Which of the following is a correct statement about the mean µx and standard deviation σx of the means of the triples in S?
(A) µx = 8, σx = 4.8
(B) µx = 8, σx < 4.8
(C) µx = 8, σx > 4.8
(D) µx < 8, σx = 4.8
(E) µx > 8, σx > 4.8
2. Consider the following studies being run by three different AP Statistics instructors.
I. One rewards students every day with lollipops for relaxation, encouragement, and motivation to learn the material.
II. One promises that all students will receive A’s as long as they give their best efforts to learn the material.
III. One is available every day after school and on weekends so that students with questions can come in and learn the material.
(A) None of these studies use randomization.
(B) None of these studies use control groups.
(C) None of these studies use blinding.
(D) Important information can be found from all these studies, but none can establish causal relationships.
(E) All of the above.
3. A survey to measure job satisfaction of high school mathematics teachers was taken in 1993 and repeated 5 years later in 1998. Each year a random sample of 50 teachers rated their job satisfaction on a 1-to-100 scale with higher numbers indicating greater satisfaction. The results are given in the following back-to-back stemplot.
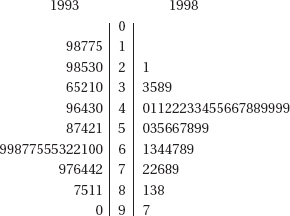
What is the trend from 1993 to 1998 with regard to the standard deviation and range of the two samples?
(A) Both the standard deviation and range increased.
(B) The standard deviation increased, while the range decreased.
(C) The range increased, while the standard deviation decreased.
(D) Both the standard deviation and range decreased.
(E) Both the standard deviation and range remained unchanged.
4. The number of days it takes to build a new house has a variance of 386. A sample of 40 new homes shows an average building time of 83 days. With what confidence can we assert that the average building time for a new house is between 80 and 90 days?
(A) 15.4%
(B) 17.8%
(C) 20.0%
(D) 38.8%
(E) 82.2%
5. A shipment of resistors have an average resistance of 200 ohms with a standard deviation of 5 ohms, and the resistances are normally distributed. Suppose a randomly chosen resistor has a resistance under 194 ohms. What is the probability that its resistance is greater than 188 ohms?
(A) 0.07
(B) 0.12
(C) 0.50
(D) 0.93
(E) 0.97
6. Suppose 4% of the population have a certain disease. A laboratory blood test gives a positive reading for 95% of people who have the disease and for 5% of people who do not have the disease. If a person tests positive, what is the probability the person has the disease?
(A) 0.038
(B) 0.086
(C) 0.442
(D) 0.558
(E) 0.950
7. For which of the following is it appropriate to use a census?
(A) A 95% confidence interval of mean height of teachers in a small town.
(B) A 95% confidence interval of the proportion of students in a small town who are taking some AP class.
(C) A two-tailed hypothesis test where the null hypothesis was that the mean expenditure on entertainment by male students at a high school is the same as that of female students.
(D) None of the above.
(E) All of the above.
8. On the same test, Mary and Pam scored at the 64th and 56th percentiles, respectively. Which of the following is a true statement?
(A) Mary scored eight more points than Pam.
(B) Mary’s score is 8% higher than Pam’s.
(C) Eight percent of those who took the test scored between Pam and Mary.
(D) Thirty-six people scored higher than both Mary and Pam.
(E) None of the above.
9. Which of the following is a true statement?
(A) While observational studies gather information on an already existing condition, they still often involve intentionally forcing some treatment to note the response.
(B) In an experiment, researchers decide on the treatment but typically allow the subjects to self-select into the control group.
(C) If properly designed, either observational studies or controlled experiments can easily be used to establish cause and effect.
(D) Wording to disguise hidden interests in observational studies is the same idea as blinding in experimental design.
(E) Stratifying in sampling is the same idea as blocking for experiments.
10. The random variable describing the number of minutes high school students spend in front of a computer daily has a mean of 200 minutes. Samples of two different sizes result in sampling distributions with the two graphs below.
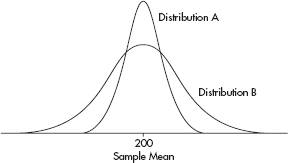
Which of the following is a true statement?
(A) Based on these graphs, no comparison between the two sample sizes is possible.
(B) More generally, sample sizes have no effect on sampling distributions.
(C) The sample size in A is the same as the sample size in B.
(D) The sample size in A is less than the sample size in B.
(E) The sample size in A is greater than the sample size in B.
11. To determine the mean cost of groceries in a certain city, an identical grocery basket of food is purchased at each store in a random sample of ten stores. If the average cost is $47.52 with a standard deviation of $1.59, find a 98% confidence interval estimate for the cost of these groceries in the city.
(A) 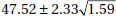
(B) 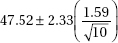
(C) 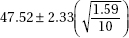
(D) 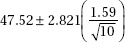
(E) 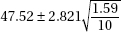
12. A set consists of four numbers. The largest value is 200, and the range is 50. Which of the following statements is true?
(A) The mean is less than 185.
(B) The mean is greater than 165.
(C) The median is less than 195.
(D) The median is greater than 155.
(E) The median is the mean of the second and third numbers if the set is arranged in ascending order.
13. A telephone survey of 400 registered voters showed that 256 had not yet made up their minds 1 month before the election. How sure can we be that between 60% and 68% of the electorate were still undecided at that time?
(A) 2.4%
(B) 8.0%
(C) 64.0%
(D) 90.5%
(E) 95.3%
14. Suppose we have a random variable X where the probability associated with the value k is 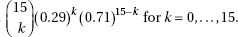
What is the mean of X?
(A) 0.29
(B) 0.71
(C) 4.35
(D) 10.65
(E) None of the above
15. The financial aid office at a state university conducts a study to determine the total student costs per semester. All students are charged $4500 for tuition. The mean cost for books is $350 with a standard deviation of $65. The mean outlay for room and board is $2800 with a standard deviation of $380. The mean personal expenditure is $675 with a standard deviation of $125. Assuming independence among categories, what is the standard deviation of the total student costs?
(A) $24
(B) $91
(C) $190
(D) $405
(E) $570
16. Suppose X and Y are random variables with E(X) = 312, var(X) = 6, E(X) = 307, and var(Y) = 8. What are the expected value and variance of the random variable X + Y?
(A) E(X + Y) = 619, var(X + Y) = 7
(B) E(X + Y) = 619, var(X + Y) = 10
(C) E(X + Y) = 619, var(X + Y) = 14
(D) E(X + Y) = 309.5, var(X + Y) = 14
(E) There is insufficient information to answer this question.
17. In sample surveys, what is meant by bias?
(A) A systematic error in a sampling method that leads to an unrepresentative sample.
(B) Prejudice, for example in ethnic and gender related studies.
(C) Natural variability seen between samples.
(D) Tendency for some distributions to be skewed.
(E) Tendency for some distributions to vary from normality.
18. The following histogram gives the shoe sizes of people in an elementary school building one morning.
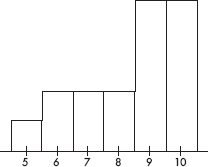
Which of the following is a true statement?
(A) The distribution of shoe sizes is bimodal.
(B) The median shoe size is 
(C) The mean shoe size is less than the median shoe size.
(D) The five-number summary is: 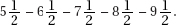
(E) Only 10% of the people had size 5 shoes.
19. When comparing the standard normal (z) distribution to the t-distribution with df = 30, which of (A)–(D), if any, are false?
(A) Both are symmetric.
(B) Both are bell-shaped.
(C) Both have center 0.
(D) Both have standard deviation 1.
(E) All the above are true statements.
20. Given a probability of 0.65 that interest rates will jump this year, and a probability of 0.72 that if interest rates jump the stock market will decline, what is the probability that interest rates will jump and the stock market will decline?
(A) 0.72 + 0.65 – (0.72)(0.65)
(B) (0.72)(0.65)
(C) 1 – (0.72)(0.65)
(D) 
(E) 
21. Sampling error is
(A) the mean of a sample statistic.
(B) the standard deviation of a sample statistic.
(C) the standard error of a sample statistic.
(D) the result of bias.
(E) the difference between a population parameter and an estimate of that parameter.
22. Suppose that the weights of trucks traveling on the interstate highway system are normally distributed. If 70% of the trucks weigh more than 12,000 pounds and 80% weigh more than 10,000 pounds, what are the mean and standard deviation for the weights of trucks traveling on the interstate system?
(A) µ = 14,900; σ = 6100
(B) µ = 15,100; σ = 6200
(C) µ = 15,300; σ = 6300
(D) µ = 15,500; σ = 6400
(E) The mean and standard deviation cannot be computed from the information given.
23. If the correlation coefficient r = 0.78, what percentage of variation in y is explained by variation in x?
(A) 22%
(B) 39%
(C) 44%
(D) 61%
(E) 78%
24. Consider the following scatterplot:
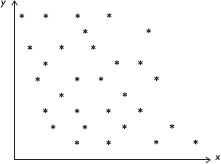
Which of the following is the best estimate of the correlation between x and y?
(A) –0.95
(B) –0.15
(C) 0
(D) 0.15
(E) 0.95
25. For one NBA playoff game the actual percentage of the television viewing public who watched the game was 24%. If you had taken a survey of 50 television viewers that night and constructed a confidence interval estimate of the percentage watching the game, which of the following would have been true?
I. The center of the interval would have been 24%.
II. The interval would have contained 24%.
III. A 99% confidence interval estimate would have contained 24%.
(A) I and II
(B) I and III
(C) II and III
(D) All are true.
(E) None is true.
26. Which of the following is a true statement?
(A) In a well-designed, well-conducted sample survey, sampling error is effectively eliminated.
(B) In a well-designed observational study, responses are influenced through an orderly, carefully planned procedure during the collection of data.
(C) In a well-designed experiment, the treatments are carefully planned to result in responses that are as similar as possible.
(D) In a well-designed experiment, double-blinding is a useful matched pairs design.
(E) None of the above is a true statement.
27. Consider the following scatterplot showing the relationship between caffeine intake and job performance.
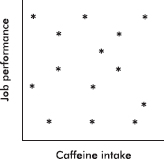
Which of the following is a reasonable conclusion?
(A) Low caffeine intake is associated with low job performance.
(B) Low caffeine intake is associated with high job performance.
(C) High caffeine intake is associated with low job performance.
(D) High caffeine intake is associated with high job performance.
(E) Job performance cannot be predicted from caffeine intake.
28. An author of a new book claims that anyone following his suggested diet program will lose an average of 2.8 pounds per week. A researcher believes that the true figure will be lower and plans a test involving a random sample of 36 overweight people. She will reject the author’s claim if the mean weight loss in the volunteer group is less than 2.5 pounds per week. Assume that the standard deviation among individuals is 1.2 pounds per week. If the true mean value is 2.4 pounds per week, what is the probability that the researcher will mistakenly fail to reject the author’s false claim of 2.8 pounds?
(A) 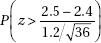
(B) 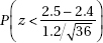
(C) 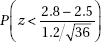
(D) 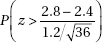
(E) 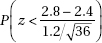
29. Which of the following is the central limit theorem?
(A) No matter how the population is distributed, as the sample size increases, the mean of the sample means becomes closer to the mean of the population.
(B) No matter how the population is distributed, as the sample size increases, the standard deviation of the sample means becomes closer to the standard deviation of the population divided by the square root of the sample size.
(C) If the population is normally distributed, then as the sample size increases, the sampling distribution of the sample mean becomes closer to a normal distribution.
(D) All of the above together make up the central limit theorem.
(E) The central limit theorem refers to something else.
30. What is a sampling distribution?
(A) A distribution of all the statistics that can be found in a given sample
(B) A histogram, or other such visual representation, showing the distribution of a sample
(C) A normal distribution of some statistic
(D) A distribution of all the values taken by a statistic from all possible samples of a given size
(E) All of the above
31. A judge chosen at random reaches a just decision roughly 80% of the time. What is the probability that in randomly chosen cases at least two out of three judges reach a just decision?
(A) 3(0.8)2(0.2)
(B) 1 – 3(0.8)2(0.2)
(C) (0.8)3
(D) 1 – (0.8)3
(E) 3(0.8)2(0.2) + (0.8)3
32. Miles per gallon versus speed (miles per hour) for a new model automobile is fitted with a least squares regression line. Following is computer output of the statistical analysis of the data.
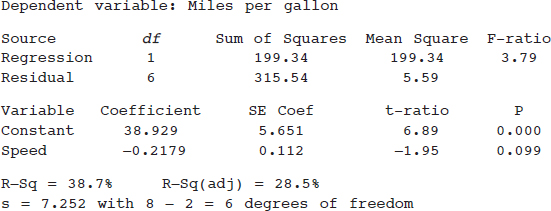
Which of the following gives a 99% confidence interval for the slope of the regression line?
(A) –0.2179 ± 3.707(0.112)
(B) 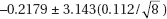
(C) 
(D) 
(E) 
33. What fault do all these sampling designs have in common?
I. The Parent-Teacher Association (PTA), concerned about rising teenage pregnancy rates at a high school, randomly picks a sample of high school students and interviews them concerning unprotected sex they have engaged in during the past year.
II. A radio talk show host asks people to phone in their views on whether the United States should keep troops in Bosnia indefinitely to enforce the cease-fire.
III. The Ladies Home Journal plans to predict the winner of a national election based on a survey of its readers.
(A) All the designs make improper use of stratification.
(B) All the designs have errors that can lead to strong bias.
(C) All the designs confuse association with cause and effect.
(D) All the designs suffer from sampling error.
(E) None of the designs makes use of chance in selecting a sample.
34. Hospital administrators wish to determine the average length of stay for all surgical patients. A statistician determines that for a 95% confidence level estimate of the average length of stay to within ±0.50 days, 100 surgical patients’ records would have to be examined. How many records should be looked at for a 95% confidence level estimate to within ±0.25 days?
(A) 25
(B) 50
(C) 200
(D) 400
(E) There is not enough information given to determine the necessary sample size.
35. A chess master wins 80% of her games, loses 5%, and draws the rest. If she receives 1 point for a win,  point for a draw, and no points for a loss, what is true about the sampling distribution X of the points scored in two independent games?
(A) X takes on the values 0, 1, and 2 with respective probabilities 0.10, 0.26, and 0.64.
(B) X takes on the values  and 2 with respective probabilities 0.0025, 0.015, 0.1025, 0.24, and 0.64.
(C) X takes on values according to a binomial distribution with n = 2 and P = 0.8.
(D) X takes on values according to a binomial distribution with mean 
(E) X takes on values according to a distribution with mean (2)(0.8) and standard deviation 
36. Which of the following is a true statement?
(A) The P-value is a conditional probability.
(B) The P-value is usually chosen before an experiment is conducted.
(C) The P-value is based on a specific test statistic and thus should not be used in a two-sided test.
(D) P-values are more appropriately used with t-distributions than with z-distributions.
(E) If the P-value is less than the level of significance, then the null hypothesis is proved false.
37. An assembly line machine is supposed to turn out ball bearings with a diameter of 1.25 centimeters. Each morning the first 30 bearings produced are pulled and measured. If their mean diameter is under 1.23 centimeters or over 1.27 centimeters, the machinery is stopped and an engineer is called to make adjustments before production is resumed. The quality control procedure may be viewed as a hypothesis test with the null hypothesis H0: µ = 1.25 and the alternative hypothesis Ha: µ ≠ 1.25. The engineer is asked to make adjustments when the null hypothesis is rejected. In test terminology, what would a Type II error result in?
(A) A warranted halt in production to adjust the machinery
(B) An unnecessary stoppage of the production process
(C) Continued production of wrong size ball bearings
(D) Continued production of proper size ball bearings
(E) Continued production of ball bearings that randomly are the right or wrong size
38. Both over-the-counter niacin and the prescription drug Lipitor are known to lower blood cholesterol levels. In one double-blind study Lipitor outperformed niacin. The 95% confidence interval estimate of the difference in mean cholesterol level lowering was (18, 41). Which of the following is a reasonable conclusion?
(A) Niacin lowers cholesterol an average of 18 points, while Lipitor lowers cholesterol an average of 41 points.
(B) There is a 0.95 probability that Lipitor will outperform niacin in lowering the cholesterol level of any given individual.
(C) There is a 0.95 probability that Lipitor will outperform niacin by at least 23 points in lowering the cholesterol level of any given individual.
(D) We should be 95% confident that Lipitor will outperform niacin as a cholesterol-lowering drug.
(E) None of the above.
39. The following parallel boxplots show the average daily hours of bright sunshine in Liberia, West Africa:
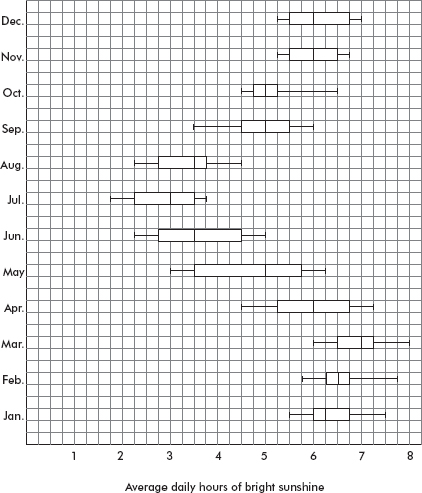
For how many months is the median below 4 hours?
(A) One
(B) Two
(C) Three
(D) Four
(E) Five
40. Following is a cumulative probability graph for the number of births per day in a city hospital.
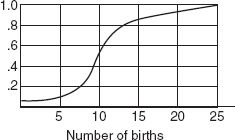
Assuming that a birthing room can be used by only one woman per day, how many rooms must the hospital have available to be able to meet the demand at least 90 percent of the days?
(A) 5
(B) 10
(C) 15
(D) 20
(E) 25

If there is still time remaining, you may review your answers.
SECTION II
Part A
QUESTIONS 1–5
Spend about 65 minutes on this part of the exam.
Percentage of Section II grade—75
Directions: You must show all work and indicate the methods you use. You will be graded on the correctness of your methods and on the accuracy of your results and explanations.
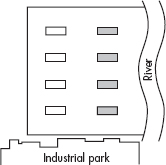
1. An experiment is being planned to study urban land use practices aimed at reviving and sustaining native bird populations. Vegetation types A and B are to be compared, and eight test sites are available. After planting, volunteer skilled birdwatchers will collect data on the abundance of bird species making each of the two habitat types their home. The east side of the city borders a river, while the south side borders an industrial park.
(a) Suppose the decision is made to block using the scheme below (one block is white, one gray). How would you use randomization, and what is the purpose of the randomization?
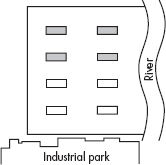
(b) Comment on the strength and weakness of the above scheme as compared to the following blocking scheme (one block is white, one gray).
2. A world organization report gives the following percentages for primary-school-age children enrolled in school in the 17 countries of each of two geographic regions.
Region A: 36, 45, 52, 56, 56, 58, 60, 63, 65, 66, 69, 71, 72, 74, 77, 82, 92
Region B: 35, 37, 41, 43, 43, 48, 50, 54, 65, 71, 78, 82, 83, 87, 89, 91, 92
(a) Draw a back-to-back stemplot of this data.
(b) The report describes both regions as having the same median percentage (for primary-school-age children enrolled in school) among their 17 countries and approximately the same range. What about the distributions is missed by the report?
(c) If the organization has education funds to help only one region, give an argument for which should be helped.
(d) A researcher plans to run a two-sample t-test to study the difference in means between the percentages from each region. Comment on his plan.
3. Data were collected from a random sample of 100 student athletes at a large state university. The plot below shows grade point average (GPA) versus standard normal value (z-score) corresponding to the percentile of each GPA (when arranged in order). Also shown is the normal line, that is, a line passing through expected values for a normal distribution with the mean and SD of the given data.
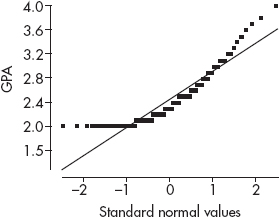
(a) What is the shape of this distribution? Explain.
(b) What is the 95th percentile of the data? Explain.
(c) In a normal distribution with the mean and SD of this data, what is the 95th percentile? Explain.
4. Although blood type frequencies in the United States are in the ratios of 9:8:2:1 for types O, A, B, and AB, respectively, local differences are often found depending upon a variety of demographic characteristics. Two researchers are independently assigned to determine if patients at a particular large city general hospital exhibit blood types supporting the above model. The table below gives the data results from what each researcher claims to be random samples of 500 patient lab results.
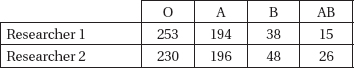
(a) Do the data reported by Researcher 1 support the 9:8:2:1 model for blood types of patients at the particular hospital? Justify your answer.
(b) The editorial board of a medical publication rejects the findings of Researcher 2, claiming that his data are suspicious in that they are too good to be true. Give a statistical justification for the board’s decision.
5. In a random sample of automobiles the highway mileage (in mpg) and the engine size (in liters) are measured, and the following computer output for regression is obtained:
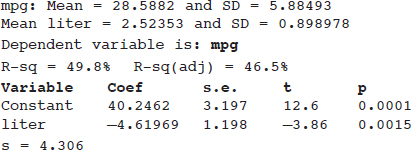
Assume all conditions for regression inference are met.
(a) One of the points on the regression line corresponds to an auto with an engine size of 1.5 liters and highway mileage of 35 miles per gallon. What is the residual of this point?
Suppose another auto with an engine size of 5.0 liters and highway mileage of 17 mpg is added to the data set.
(b) Explain whether the new slope will be greater than, less than, or about the same as the slope given by the output above.
(c) Explain whether the new correlation will be greater than, less than, or about the same in absolute value as the correlation given by the output above.
SECTION II
Part B
QUESTION 6
Spend about 25 minutes on this part of the exam.
Percentage of Section II grade—25
6. A demographer randomly selects five northern and five southern U.S. states and notes the populations in 1990 and 2000:
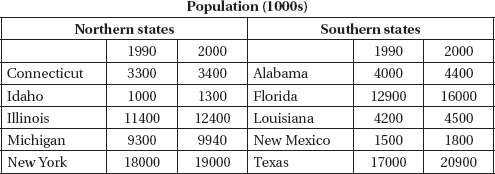
She calculates the following summary statistics:
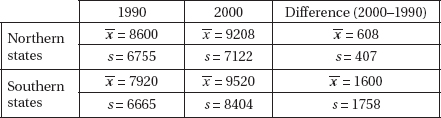
Assuming that all conditions for inference are met,
(a) at the  = 0.05 significance level, test the null hypothesis that southern states did not grow between 1990 and 2000;
(b) find a 95% confidence interval for the difference in populations between northern and southern states in 1990;
(c) test the hypothesis that southern states grew faster than northern states between 1990 and 2000.
If there is still time remaining, you may review your answers.