Chapter 5
Improving on the 4-Percent Rule
The Thompsons used the 4-percent rule to set their initial income target. That means they drew $24,000 in the first year of retirement from their RRIF. In subsequent years, they increased the amount they were drawing from the RRIF by inflation. In addition, they received pension income from OAS and CPP.
Given that they ran their nest egg down to zero when Susan was still in her 70s, the 4-percent rule is obviously less than perfect. We have already identified one problem with it: it doesn’t produce a smooth stream of total income when other sources of income aren’t smooth.
There is a more fundamental problem with it, though, which has to do with increasing the payouts each year by the rate of inflation. You might wonder, What’s wrong with having your retirement income rising with inflation? If you really need that much more income each year, nothing is wrong with it. But if you naturally start to spend less after a certain age, then drawing that extra income is increasing the chances you will eventually go broke.
As it turns out, most retirees eventually spend less in real terms once they reach a certain age. This is true whether they have a little money or a lot. Once they reach that point, the drop in their real spending from one year to the next may be small, but it makes a significant difference over time.
There are two reasons why most older retirees spend progressively less. First, the particular basket of goods and services that they consume is constantly changing with age. By the time you reach age 80, the contents of that basket will bear little resemblance to what it was when you were 60, much less 40. It would have been sheer coincidence if their real spending didn’t change as well.
The other reason they eventually spend less is that they consume less over time. What is amazing is that this finding should come as a surprise to anyone. I sort of knew about this phenomenon when I was 20. I received cash gifts every so often from my grandmother even though she had only a modest income (a small government pension from Italy). As it happens, her spending needs were even more modest.
I’m not the only one who knew something was going on, of course. In his 1977 book on the state of retirement in Canada, Geoffrey Calvert observed that “as age advances, clothing and footwear expenditures fall steadily to less than one half . . . furniture costs fall to one-third . . . automobile-related costs to one-sixth, while travel costs as a whole drop to less than one-quarter.”a
Calvert went on to say, “Even though the incomes recorded in this sample become significantly less as age advances, the ability to make gifts, add to assets and purchase discretionary and luxury items, seems to be surprisingly well sustained. One does not see reflected here a picture of increasing hardship as age advances.”
If Calvert’s remarks were true in 1977, they should carry even more weight today. Since the 1970s, Canada’s seniors have grown steadily more affluent. Calvert’s observations, however, have been all but forgotten. Most of us still think that our retirement income needs to keep up with inflation.
Just because we choose to ignore a phenomenon doesn’t mean it no longer exists. The data still suggest that older people spend less. It is hard otherwise to fathom how they could be saving such large amounts. (Yes, older Canadians save a greater percentage of their income than younger Canadians.) According to a CIBC study, the elderly in Canada will be handing over a mind-blowing $750 billion to the next generation over the next ten years alone!b
If we fail to acknowledge the true spending patterns of older retirees, political correctness may have something to do with it. The mere suggestion that older people don’t need quite as much money can come across as senior-bashing. But while it is a sensitive subject, I don’t think that justifies our shying away from the truth. By perpetuating myths, we would be doing a disservice to the retirees themselves, as well as to those planning for their retirement. If new retirees know what’s in store for them, they can recalibrate their spending intentions early on to reflect that reality. In other words, they can spend more now, knowing they will be spending less (in real terms) later on. This should make them feel less anxious about their future financial prospects.
I mentioned to a friend a while back that older people spend less, and he immediately objected. He said his widowed dad (who was in his mid-80s) spent all kinds of money. I said, “Really? On what, may I ask?” He opened his mouth to answer me but stopped himself. He suddenly realized that most of his dad’s extra spending was not on himself but on others. For instance, his dad was paying the rent for one of his adult daughters. What he spent on himself had shrunk down to practically nothing as he seldom went out and no longer travelled in his later retirement years.
Academic Studies on Retirement Spending
If there is any lingering doubt that seniors start spending less in real terms, then numerous academic studies from a variety of countries should dispel it. These studies, based on extensive data, make a compelling case that the drop in spending at older ages is a widespread phenomenon in developed countries. The tipping point for the slowdown in spending seems to occur in one’s early 70s and then persists well into one’s 80s.
Here are some of the key findings from those studies:
- In 1992, Axel Börsch-Supan studied the saving and consumption patterns of the “very old” (his words, not mine) in Germany.c By observing 40,000 households, he found that retirees tended to maintain their spending in real terms during their 60s. This result was expected. What surprised him was what happened around age 70. Instead of retirees continuing to draw down their savings, their assets started to climb again. Börsch-Supan determined that this happened because older German retirees spent less in real terms. Eighty-year-olds were saving more than 45-year-olds! After testing all the possible reasons for the decline in spending, he concluded that the reduced spending stemmed from two causes. The first was a reduced ability to spend due to creeping infirmity. If you can no longer get on a plane, your travelling expenses decline. The other cause was a diminished inclination to spend. After the death of a loved one, for instance, exotic travel might seem less enticing.
- Actuary Malcolm Hamilton produced a landmark study in 2001 that showed that seniors in Canada save enormous amounts of money.d Senior couples aged 75 and over either saved or gave away as cash gifts an average of 16.1 percent of their income. Couples age 85 and older saved or gave away even more. Saving so much indicated that super-seniors must be spending less. More important, it also showed that the drop in spending had little to do with insufficient income.
- The only plausible conclusion is that the elderly are either not inclined or not able to spend as much as they used to. Hamilton’s finding is especially compelling given that the study encompassed seniors at all income levels, not just the wealthy. The average income for couples 85 and over, for instance, was just $31,300. While Hamilton used data from the late 1990s, his findings should be just as valid today given that modern-day seniors are much better off. Incomes among seniors have risen nearly 20 percent in real terms since the mid-1990s.
- David Domeij and Magnus Johannesson reported that Swedes also spend less as they age. Their 2006 study tried to explain why.e The explanation that best fit the data was that failing health made spending both more difficult and less enjoyable — essentially the same conclusion as Börsch-Supan’s.
- A 2015 UK study (Brancati et al.) sifted through two very large data sets: the Living Costs and Food Survey, and the English Longitudinal Study of Ageing.f They uncovered a precipitous drop in spending between ages 60 and 80. In spite of it, most of the 80-year-old respondents said that their spending was not constrained by a lack of money. The reductions in spending occurred at all income levels, by the way. Similar to the Börsch-Supan work, the tipping point for a slowdown in spending occurred around ages 70 to 74. As the authors noted, this is also when time spent at home alone starts to rise rapidly.
You might be wondering why I have not cited any Canadian studies other than Malcolm Hamilton’s, which is now more than 20 years old. It is because good Canadian studies are hard to find. One possible reason for this, as mentioned earlier, is political correctness, a force from which even academics are not immune. A more tangible reason is that longitudinal data on consumption does not exist yet in Canada.
McKinsey & Company Canada did their best to overcome this deficiency using data from Statistics Canada’s Survey of Household Spending.g They showed that spending drops sharply with age. Not everyone accepts this finding, however, as it was not based on longitudinal data and was not corrected for changes in household size. These apparent shortcomings do not mean the McKinsey findings were wrong; it’s just that longitudinal data would be so much more compelling.
There is one recent Canadian study that suggests that the inflation rate for seniors is in fact a little higher than for younger Canadians.h That study, however, speaks only to the basket of goods and says nothing about the gradual change in consumption. A longitudinal study of actual retirees would have been more useful.
For now, we have to rely heavily on the results from Germany, Sweden, and the UK. The studies from these countries are hard to ignore. The data we do have for Canada makes it hard to argue that Canadians are fundamentally different.
Here are some metrics that help to pinpoint how fast spending declines:
- A 2012 Employee Benefit Research Institute study by Michael Hurd and Susann Rohwedder concluded that real (inflation-adjusted) spending by college-educated married couples fell by 1.23 percent a year in their late 60s, 1.75 percent a year in their 70s, and 2.75 percent a year in their early 80s.2
- Another study from the United States, this one by David Blanchett of Morningstar, estimated that real spending declined by about 1 percent a year in the first ten years of retirement, 2 percent a year in the next ten years, and 1 percent a year thereafter.
- A third US study, produced by J.P. Morgan using its own data, found that real spending among affluent households dropped by 1 percent a year for the first 20 years of retirement.
- The 2006 Swedish study mentioned above calculated that consumption fell by 25 percent between ages 60 and 80.
- The UK (Brancati) study reported that a household headed by an 80-year-old spends 43 percent less on average than a household headed by a 50-year-old. If one includes mortgage payments in the calculation, then 80-year-olds spend 56 percent less. The researchers used this and similar data to estimate that household expenditure in retirement fell by 1.4 percent a year. This is after having adjusted for various factors such as household size.
Incidentally, all the above studies (except for the McKinsey study) made adjustments to reflect changes in household size over time. The usual reasons that households get smaller are because of children leaving the family home or the death of a spouse.
When it comes to the impact of household size, by the way, there is a broad consensus in academic circles that spending in a household is proportional to the square root of the number of persons in the household. Hence, the living expenses for a single retiree are about 70 percent of the expenses for two (one divided by the square root of two). The death of a spouse should therefore result in a reduction in household spending of about 30 percent.
Setting an Income Target for Future Years
Taking all the foregoing studies into account, I believe it is reasonable to conclude that the spending of most seniors in real terms keeps up with inflation until age 70 or so, and after that it will usually fall at the rate of:
- 1 percent a year throughout one’s 70s,
- 2 percent a year in one’s 80s,3 and
- 0 percent from age 90 and on.
When we factor these percentages into the retirement income target, we get the result depicted in Figure 5.1.
In the case of a couple, this series of reductions begs the question of what happens if the ages of spouses fall in different decades; for instance, what if one spouse is in his 70s and the other is in her 60s? I confess I’m not exactly sure of the answer myself, so I have erred on the side of caution. I have assumed the reduction in spending in a given year is the smaller of the two. For instance, when Nick is 82 and Susan is 79, I have assumed that real spending declines by just 1 percent rather than 2 percent. And as mentioned above, there would also be a one-time reduction in spending of 30 percent when a spouse dies (not illustrated here).
Figure 5.1. How the income target should change
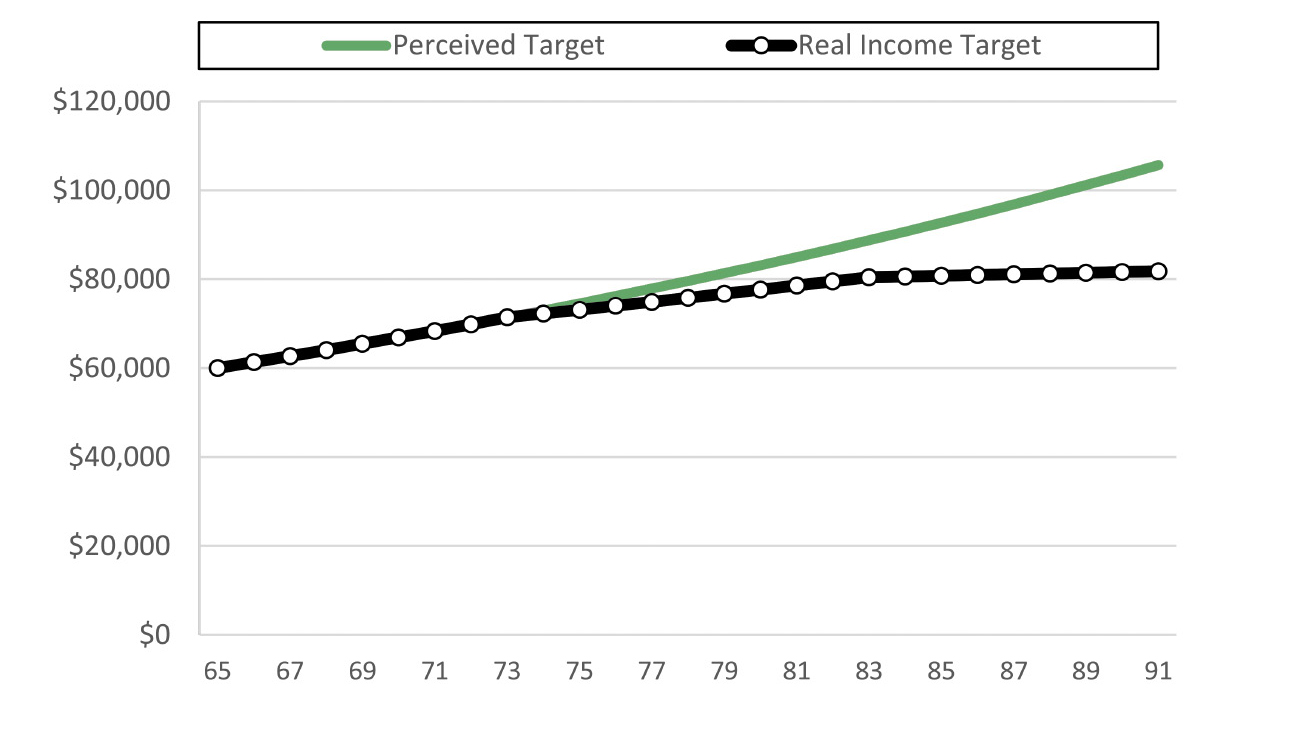
The income target should rise as shown by the black line, not the green line. This chart assumes inflation of 2.2% a year.
We will now apply this to Nick and Susan. We will build in everything we’ve learned in the last two chapters. In particular:
- The 4-percent rule showed significantly lower income for the Thompsons in the first three years of retirement. This was because Susan’s OAS pension hadn’t started yet. We will eliminate this shortfall by having the couple draw enough extra income in the first three years to fill the gap.
- We will assume the same three spending shocks but will show that the bumps in extra income needed in those years have now been either eliminated or at least reduced by the creation of a reserve.
- The new income target curve will be used.
We still haven’t established whether the starting income amount is sustainable, but let’s assume for the time being that it is the right amount. (More on this later.) The result of these modifications is shown in Figure 5.2. The Thompsons are still running out of money way too soon, but this will be rectified later on.
Figure 5.2. Add a reserve and reset the income target
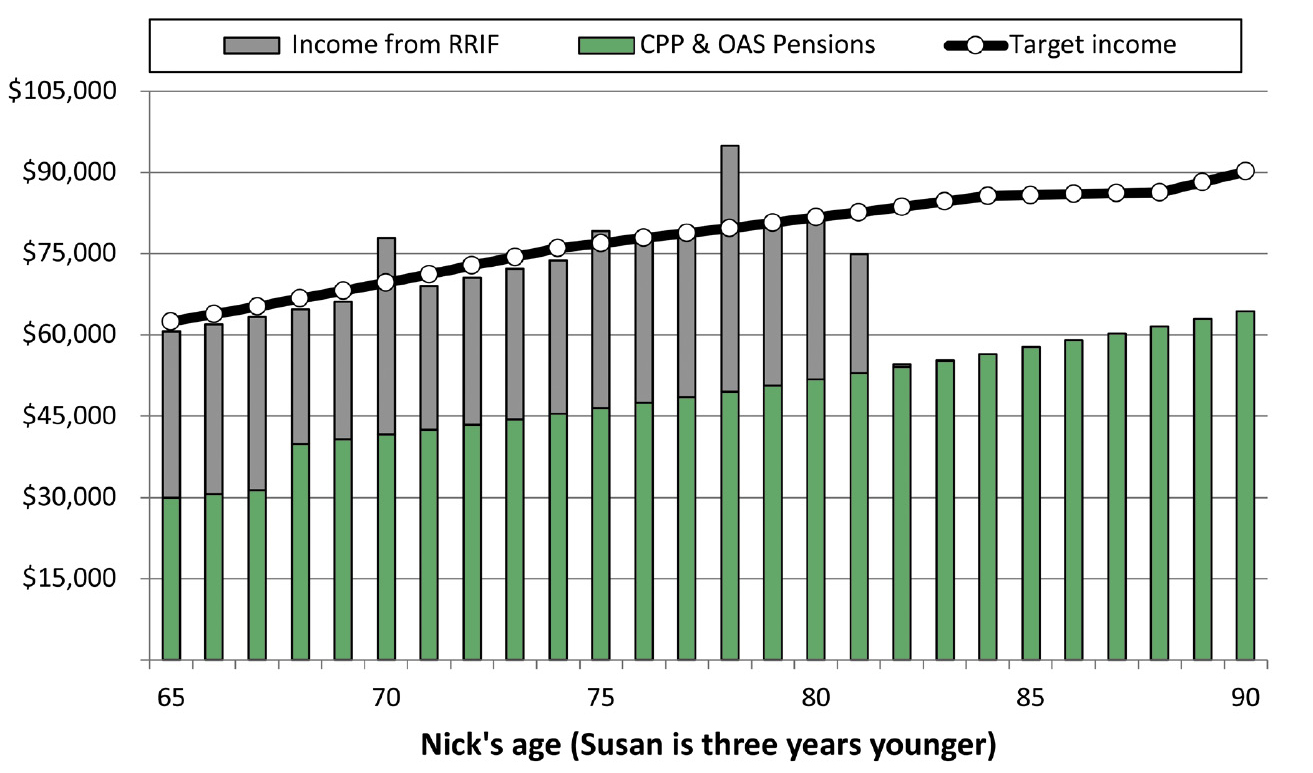
The income gap in the first three years has been filled in, and the reserve fund has softened the impact of the spending shocks. RRIF and TFSA income still run out, however, by age 82.
Takeaway
- Spending by retirees tends to rise more slowly than inflation, especially between ages 70 and 90. This is true even if they have the financial means to spend more.