Chapter 7
Investment Risk
So far, I have described two of the reasons the Thompsons ran out of money — incurring spending shocks and using the 4-percent rule. But let’s face it: none of this would have mattered much if they had earned decent returns on their investments. Instead, their returns were much worse than average and stayed that way throughout their retirement years. This raises two important questions:
- Just how bad was it?
- Is it better to avoid risk altogether?
Just How Bad Was It?
The Thompsons chose to invest 50 percent of their retirement assets in equities (stocks) and 50 percent in fixed income (bonds). The 50 percent in stocks is assumed to be invested in the S&P/TSX Capped Composite Index and the MSCI World Index. To be clear, this was not the source of their problems, but we will nevertheless take a closer look at their asset mix later in this chapter.
Equity investments have good years and bad years, as do fixed income investments, but in the case of the Thompsons, I assumed that their returns were generally bad year after year. To put it into technical terms, I assumed their overall returns were at the 5th percentile, year in and year out. This means the returns they achieved were better than only 5 percent of all possible outcomes, no matter how many years we are looking into the future.
You may be wondering why I didn’t assume returns closer to historical norms. When it comes to retirement planning, I believe it is wiser to hope for the best but to plan for the worst, and a 5th-percentile scenario is not out of the question. By definition, there is one chance in 20 of realizing a 5th-percentile result.
Percentiles and Monte Carlo Simulations
The brief explanation above of what it means to have 5th-percentile returns may not paint much of a picture, so let me use an analogy. Imagine you want to know how much rainfall Toronto is likely to have next June. It so happens the average rainfall for that month is 89.9 millimetres based on historical records. An average, however, isn’t very descriptive. What are the chances it will rain 150 millimetres in June or less than 30 millimetres?
You would get a better idea of what to expect if you had access to historical records showing June rainfall in each past year. Just to keep things simple, we will retrieve just 20 years of data. The result is shown in Figure 7.1.
You can glean some tidbits of information from Figure 7.1 that you can’t get from just knowing the average. For instance, we now know that the amount of rainfall can vary widely, from as little as 26 millimetres (2016) to as much as 191 millimetres (2010).
We can make this annual data even more useful if we organize it from the least rainfall to the most rainfall, as in Figure 7.2. We no longer bother to show the year underneath each bar since they are no longer sequential. Think of each year as a “trial” with 20 trials in all.
Figure 7.1. Actual rainfall in June 2000–2019 (Toronto)
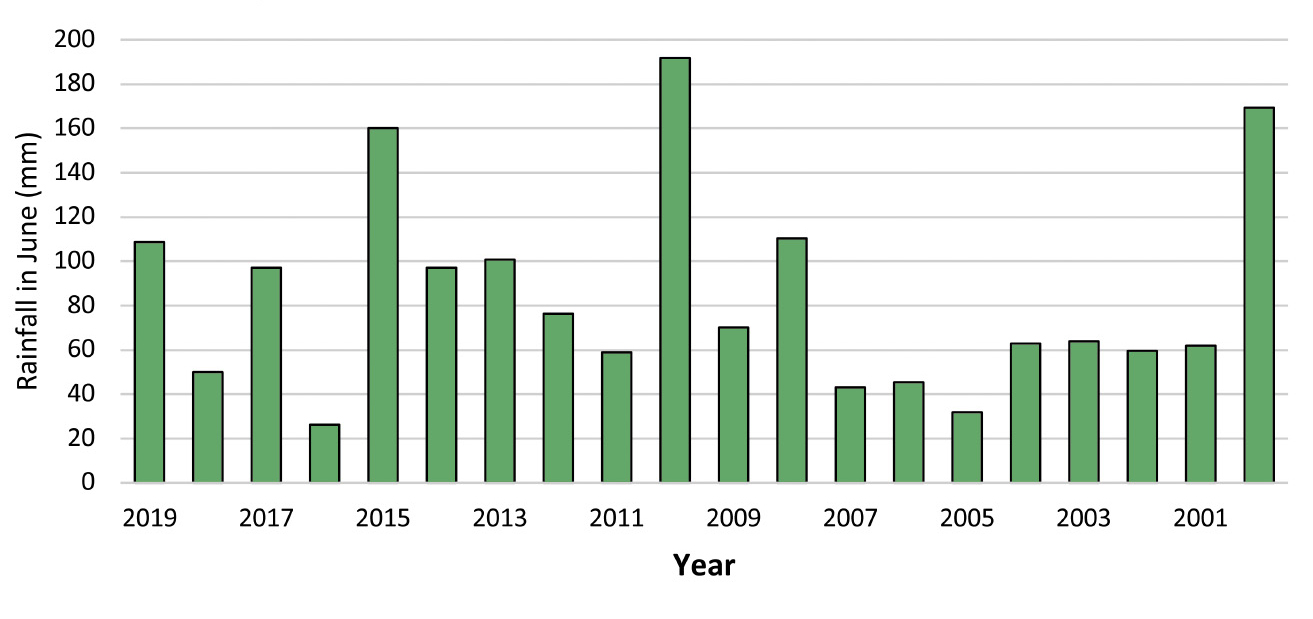
Figure 7.2. June rainfall sorted from least to most
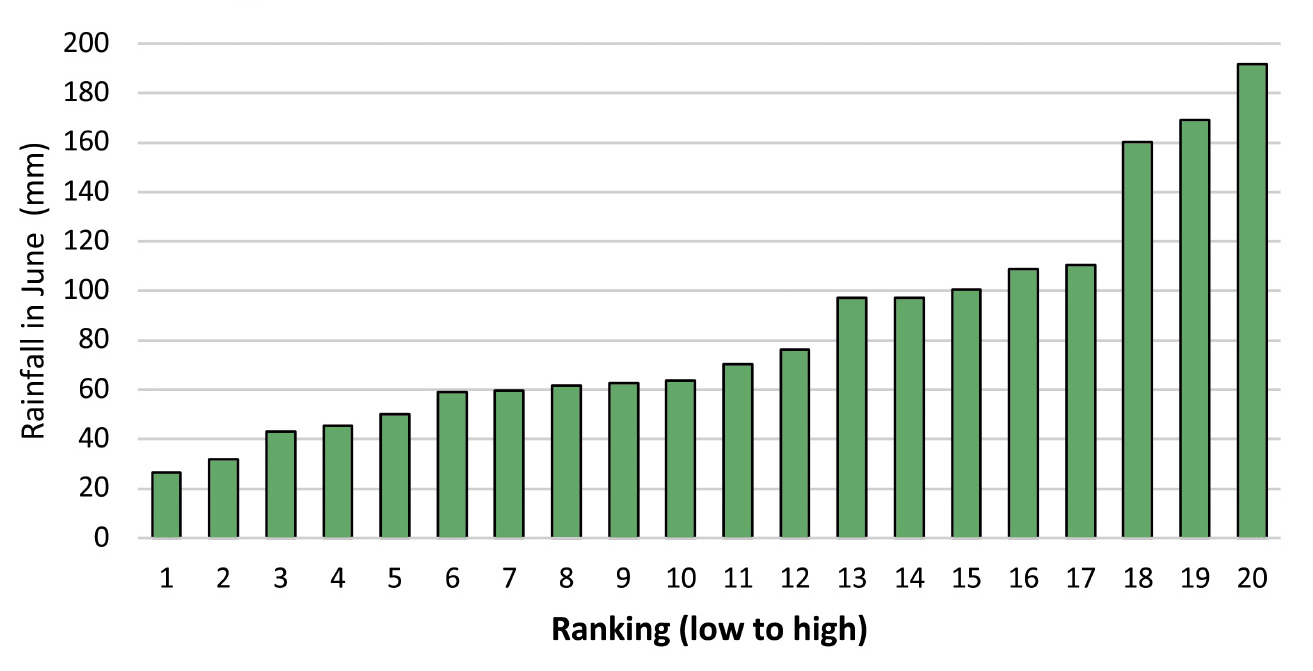
Figure 7.3. Range for June rainfall in Toronto (5th to 95th percentile)

If this 20-year sample was statistically significant (it’s not), then Figure 7.2 tells us there is just one chance in 20 that the amount of rain will be 26.4 millimetres or less. Rounding up, we will consider 27 millimetres to be the 5th percentile. The 95th percentile is about 170 millimetres. The median (the point where half the trials are more and half are less) is between 64 and 70 millimetres, so let’s call it 67 millimetres.
Now, if I threw out the low and high results in the rain data, I’m left with the range from the 5th percentile to the 95th percentile. This is represented by the solid green bar in Figure 7.3 with the black horizontal line being the median.
You’ll note this chart is much more compact than the previous one. Even though it no longer depicts each trial, it still manages to capture the most useful information. For instance, we now know there is a 50 percent chance of more than 67 millimetres of rainfall in June. We also know that there is almost certain to be between 26 millimetres and 191 millimetres. Even though a result outside this range (which would be above or below the bar) is possible, it is unlikely enough that we would ignore it for most decision-making purposes.
This is essentially how a Monte Carlo simulation of investment returns works, but with two differences. First, one needs closer to 2,000 trials rather than 20 to be confident enough that we have really determined the range of possible results and the median. The second difference is that a Monte Carlo simulation for investment returns doesn’t use historical data, or at least not directly. Each trial is based on historically observed behaviour, but it is still an artificial trial, a simulation if you will, one that is produced by using a random number generator.
Running Monte Carlo simulations is a sophisticated mathematical process, and I’m grateful to the Morneau Shepell actuarial team for running the Monte Carlo simulation used in this book.
The analogy to Toronto’s rainfall will help us to understand the limitations of a simulation of investment results. When we established the 5th percentile, the 95th percentile, and the median for rainfall in June, we made the implicit assumption that the last 20 years was a typical period and that the future would be no different than the past. In fact, it could be different in ways we cannot yet quantify — consider the impact of climate change, for example.
Similarly, future investment returns could be different from the past, with a greater or lesser range of results and a higher or lower median. Just like factors such as climate change could make future rainfall patterns different from the past, a factor such as an aging population or diminishing natural resources could change the investment climate, which could in turn affect interest rates for a long time to come.
With these disclaimers in mind, Figure 7.4 shows the range of likely investment returns for a portfolio that is invested 50 percent in stocks and 50 percent in bonds. Each of the bars contains information about the range of returns in much the same way as the bar for rainfall did in Figure 7.3.
Figure 7.4. Range of returns for a 50-50 asset mix
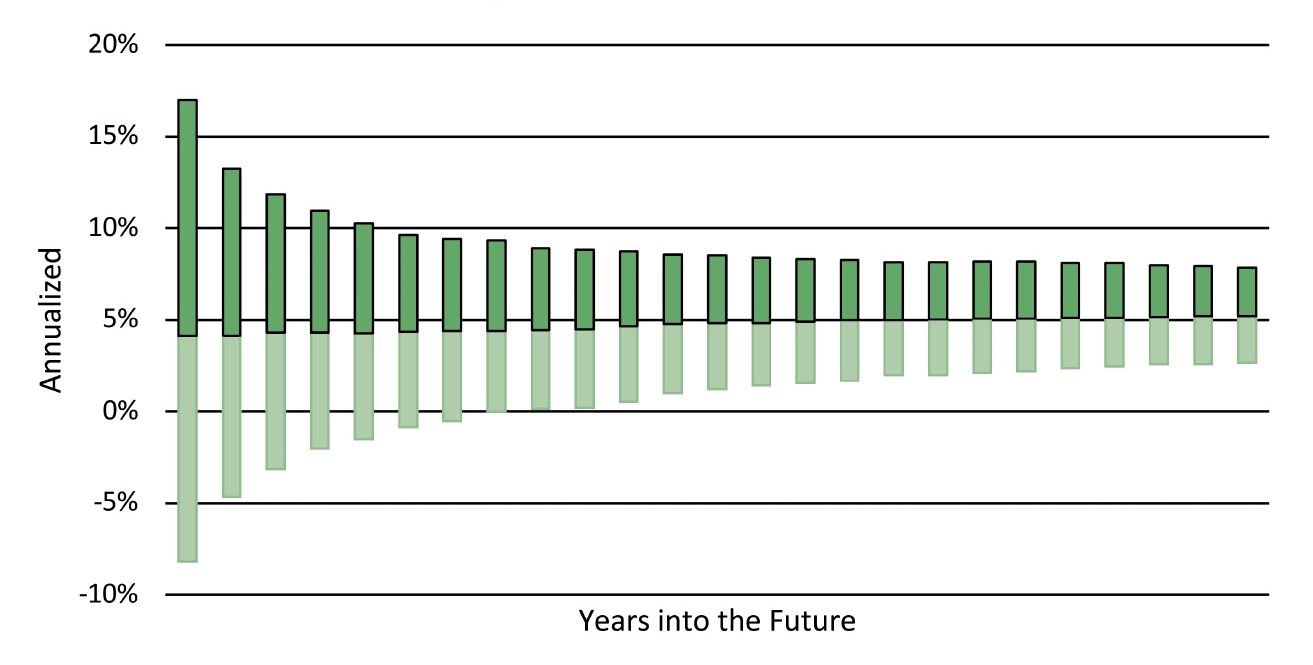
The bottom of each bar shows the 5th-percentile annualized returns. These are the returns, before deducting investment fees, that Nick and Susan are assumed to earn each year in retirement. I am calling this the worst-case scenario, which is a slight misnomer since it doesn’t show the bottom 5 percent of scenarios. The top of each bar is the 95th-percentile return. We can ignore the 95th-percentile scenario or anything better than it for planning purposes since (a) it is unlikely and (b) it would be good news if it happened, not something we either should be or need to be planning for. The junction between the dark green and light green is the median return.
Take a moment to study Figure 7.4, as it captures almost everything we need to know about the risk and opportunity associated with a 50-50 asset mix. For example, the annualized 5th-percentile return is negative until year 9. The median return doesn’t break above the 5 percent level until year 18, and after that it stays there for all future years. As for the 95th-percentile scenario, the annualized return after 25 years is slightly under 8 percent. All figures are before deducting investment fees.
Here are a few observations based on the chart:
- Even under the worst-case scenario, you should expect positive returns if you invest for a long-enough period. The trouble is that much of your retirement nest egg could be gone by the time the market reverses direction in your favour.
- The gap between the annualized returns under the best-case and the worst-case scenarios narrows over time, but the gap between the outcomes grows ever larger thanks to the magic of compound interest.
- The median return is surprisingly low. In the long run, it is expected to be just a shade over 5 percent, and it will be even less after deducting investment fees.
The last point bears emphasizing. A long-term median return in the 5 percent range is a far cry from the 8.6 percent median return that pension fund managers earned between 1960 and 2015. There are several reasons why future stock market returns will be lower than we are used to seeing. One is that inflation will probably be closer to 2 percent rather than the average of nearly 4 percent that has prevailed since 1960. Another is that pension fund managers invest about 60 percent in equities rather than 50 percent. A third reason is that the bond portion of portfolios will not do as well in the future because interest rates are so low. Long-term bonds can achieve high returns when interest rates go from high to low (as they have done since the 1980s) because they are producing capital gains as well as regular interest. For this reason, it is practically impossible to obtain high returns on bonds when the starting point is low interest rates.
Is It Better to Avoid Risk?
If poor investment performance was the main reason why the Thompsons ran out of money, it suggests that risk-averse retirees would be better to shun stocks and long-term bonds and invest their money in something safer, like T-bills or GICs.
To any investment manager, such an idea would seem outlandish and even border on heresy. After all, risky investments have always outperformed safe investments by a wide margin over the long term. A dollar invested in T-bills at the beginning of 1934 would have grown to $37 by the end of 2018. While that may not sound too bad, a dollar invested in long-term Canada bonds over the same period would have grown to $153. As for Canadian stocks, the same one dollar would have soared to $2898!
On the other hand, the investment horizon of a retiree is not all that that long. If they follow my advice in later chapters and spend down their savings in their early years in return for higher government pensions in their later years, their investment horizon could be as little as ten years. Sustained losses, or at least dismal returns, over this length of period are certainly possible. Besides, the reward for taking risk will likely shrink in the future, if Figure 7.4 is any guide. At a minimum, you owe it to yourself to investigate what would happen if the entire nest egg were invested safely, with no chance of a loss of capital.
To test this scenario, I used the interest rate currently offered4 by a Big-5 bank for savings accounts, in which the money is locked in for one year. Such an investment is about as safe as it gets. There is a possibility that interest rates will drop further but it doesn’t seem too outlandish to assume the Thompsons will be able to earn 2 percent in a savings account year in and year out. Figure 7.5 shows what the result would be.
This outcome should give one pause. Instead of running out of money by age 82, which is what happened when they invested in stocks and bonds, the Thompsons now have steady income that continues to grow into their 90s. They can sleep at night knowing they are practically immune from a market crash.
Figure 7.5. The Thompsons put their money in a savings account
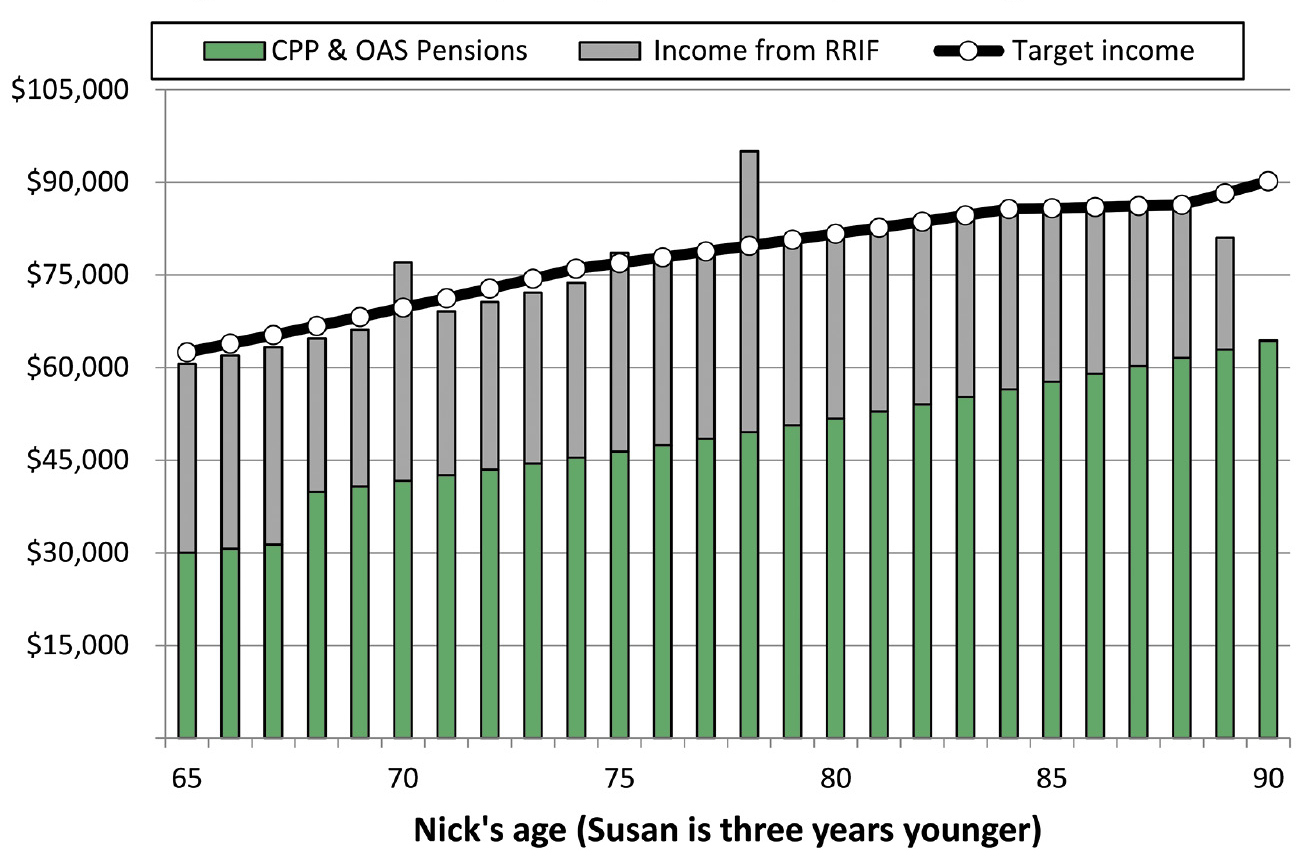
This is the same as Figure 5.2 except the fund now enjoys a 2% annual return in a savings account. The RRIF income now continues to age 89.
In a rare flash of prescience, I first published an article describing this strategy in The Globe and Mail in January 2020. At the time, the idea seemed questionable at best, since the median return on balanced funds in 2019 was 15.78 percent,5 and stocks had generally done well for over the past decade. Then the bear market of 2020 started in early March. Articles started to surface of how people who were getting ready to retire could no longer afford to do so.
The Thompsons do pay a price for all that peace of mind, though. They are giving up the chance to do better. In fact, it is more than just a chance; once the 2020 bear market bottoms out, it is likely they will fare better than the worst-case scenario I have been showing. Nevertheless, I know some risk-averse retirees who would and probably should choose the no-risk alternative if they truly understood the implications of each option.
I should point out that this alternative wouldn’t be too attractive if interest rates on savings accounts fall to 1 percent or lower. Until a few years ago, this wouldn’t have seemed possible, but neither would seeing long-term bond yields below 1 percent!
In Part II, we will find that there are ways to enhance retirement income whether the Thompsons decide to take investment risk or not.
Alternatives to Stocks
If you don’t want to invest in stocks but do want higher returns than what a savings account offers, what options do you have? A popular alternative these days is real estate. Some people buy one or more condo units and rent them out. This can be profitable when the local housing market is doing well, but disparities from one region to another can be wide, and even robust housing markets do not rise in a straight line forever. Condo investors can lose everything if they hold mortgages on their rental properties, have trouble finding a tenant, and the real estate market cools. The consequences are especially painful if interest rates rise at the same time. This is what happened to many people when the Toronto and Vancouver housing bubbles burst in 1989, and there is no reason it can’t happen again.
Real estate might still produce good returns in the future, but you face a host of problems. The first is liquidity. It can take many months to sell a condo, and you cannot afford to be illiquid if a spending shock arises and you need the money to make ends meet.
A second problem is finding a suitable investment property if you have only a smallish amount to invest. In the real estate market, even a few hundred thousand dollars is considered small potatoes.
Third, transaction costs like commissions and land transfer taxes can be considerable and will cut into any capital gain you might hope to realize when you eventually sell.
Finally, don’t underestimate the potential hassles of managing a rental property. You need to maintain the property, find the right tenant, and collect enough rent to make a decent return after property taxes and maintenance costs.
All in all, real estate investing is not for amateurs. My advice is to steer clear of this investment class after you retire (apart from your own home) and stick with stocks for capital gains.
Alternatives to Government Bonds
Almost everyone who invests in bonds does so by buying units in a bond fund rather than holding individual securities. Bonds have traditionally been considered a safe investment, or at least safe compared to stocks, but the Monte Carlo simulations run by Morneau Shepell suggest they will be almost as risky as stocks in the future. Bonds do well when interest rates are high and going lower, but they do badly when interest rates are low and rising. Right now, interest rates are at the lowest they have ever been, lower even than in the Great Depression. If they rise, it will create capital losses that will offset the return from the interest that bonds are currently paying. And if interest rates don’t rise, your return on bonds will consist only of the interest they pay, which isn’t much.
As an alternative to investing in a bond fund, some people lend out money in private transactions in the form of a second mortgage. They do this to get the extra yield compared to bank deposits, but this practice can be quite dangerous. I know of people who have tried it and lost their capital when the borrower couldn’t make the payments.
Instead of a plain vanilla bond fund, you might want to consider a fund that consists of high-yield bonds. High-yield bonds are always corporate bonds rather than government bonds. They are riskier than regular government-issued bonds since there is a much higher chance of default or at least a downgrade in the bond rating, which usually happens at the worst possible time: when the markets are tanking. A downgrade would precipitate a significant drop in the value of the bond. Ideally, you want an investment that isn’t so closely correlated to stocks. When stock markets do especially badly, however, high-yield bonds tend to follow suit. You might put a smallish portion of your overall portfolio in a high-yield bond fund, but I wouldn’t bet the farm.
At the other end of the risk spectrum, you could stay completely liquid and invest only in government T-bills. This strategy is safe but doesn’t provide much of a return. At the present time, the interest rate on T-bills is even lower than in a savings account in which your money is locked in for a year. In fact, the interest rate on T-bills is lower than the current inflation rate (which is about 2 percent) so your investments in T-bills would be slowly losing value in real terms.
T-bill interest rates may eventually rise but don’t count on it. An aging population puts heavy downward pressure on interest rates. In summary, investing heavily in T-bills makes sense only if you have decided to go the super-safe route (see Figure 7.5) and the interest rate you are getting on T-bills is higher than what the banks are paying on savings accounts. Otherwise, consider having only a smallish percentage of your money in T-bills, for the sake of liquidity.
Long-Term Government Bonds
If you’re a new retiree, it is too bad for you that this isn’t 1982. Over the 37-year period from 1982 to 2018, Government of Canada bonds achieved an annualized return of 7.07 percent a year after inflation. This was better than the return on stocks over the same period.
Unfortunately, the stellar performance that bonds achieved cannot be repeated. They were great investments when interest rates were high and trending downward, but it appears that interest rates are about to bottom out, if they haven’t already done so. The 1950s used to be considered a period of exceptionally low interest rates, with long-term government bonds yielding about 3 percent. Now, they yield well under 2 percent. In fact, at the time of writing, bond yields have fallen below 1 percent for the first time ever.
They could go a tiny bit lower, but the more likely scenario in the next few years is for rates to inch upward a little. It may be counterintuitive, but rising interest rates create losses, not gains, if you are holding long-term bonds. For these reasons, traditional long-term government bonds will not be a great investment.
Instead, you might consider real return bonds. These are also long-term bonds issued by the Government of Canada. What makes them different from regular bonds is that they promise to pay you interest at a rate that at least keeps up with inflation, no matter how high inflation might go. Another advantage is that real return bonds can be bought and sold easily. They do, however, have one very serious drawback these days. The real yield on these bonds has fallen very close to 0 percent, a far cry from the 1990s, when the real yield exceeded 4 percent. A low yield is a problem in itself but that is compounded by the fact that you would suffer a capital loss if real interest rates were to rise after you bought the bonds. I have already explained that this is a distinct possibility for nominal yields; that is also true for real yields. As a result, the case for real return bonds in your portfolio has never been weaker than it is now.
In conclusion, the best hope for decent returns in the years to come — by which I mean a return of 5 percent a year, not 8 percent — is to invest in stocks, risky as they are. If you have exceptionally low risk tolerance, you might want to revisit the no-risk savings account option described above.
Exchange-Traded Funds
To the extent you invest in either stocks or fixed income securities of any type, I strongly suggest that you participate in a pooled fund, such as a mutual fund or an index that one can buy in the form of an exchange-traded fund (ETF). I strongly urge you not to become a stock-picker or day trader or to buy some highflier on the tip of a friend. The odds are very much against you. Even a broker’s stock recommendations are unlikely to turn out better than random picking.
I used to research the market on my own and trade in individual stocks. It was hubris to think I was smarter than the crowd and could profit on a consistent basis by taking a contrarian stance. Over time, I did pick a few winners, but I also picked way too many losers. I didn’t beat the market anywhere near often enough to call the experience a success. Today, I invest only in the pooled funds of an institutional manager. I picked an investment manager who is part of a major bank, because they are not apt to “go rogue” on me. There are enough risks out there that cannot be avoided; the least you can do is to steer clear of risks that are totally avoidable.
60-40 vs. 50-50
So far, I have been assuming that the Thompsons invest their RRIF monies 50 percent in stocks and 50 percent in bonds (a 50-50 mix). This is what most people do when they reach retirement age. It is more conservative than 60-40, stocks to bonds, which is what professional pension fund managers have seen fit to maintain for decades. The greater conservatism seemed appropriate, as retirees are more risk-averse than the sponsors of large pension plans. On the other hand, we have just seen that long-term bonds and other fixed income investments don’t appear to be too attractive for the foreseeable future. So maybe 50-50 isn’t better than 60-40 after all?
If we rerun the Monte Carlo simulation using a 60-40 asset mix, the result is a little surprising. Under the worst-case scenario, the Thompsons run out of money at virtually the same time as they did under the 50-50 scenario. In other words, the 5th-percentile return is no worse under a 60-40 mix than it is under 50-50. This is telling us that bonds will be just about as risky as stocks in this current low-interest environment.
Let’s take this analysis a step further and see what would happen if the Thompsons enjoyed median investment returns in all years instead of 5th-percentile returns.6 We find that with either asset mix, the Thompsons now have enough money to meet their income target in all years, but the 60-40 mix is better. As is shown in Table 7.1, the amount of assets left over at age 92 more than doubles by switching to the 60-40 mix.
Table 7.1. Situation with median investment returns
|
Remaining assets at age 92 |
|
|---|---|
|
With a 50-50 mix |
$91,000 |
|
With a 60-40 mix |
$196,000 |
The advantage of the 60-40 mix versus 50-50 grows even larger if one achieves investment returns at the 95th percentile. Table 7.2 summarizes these results.
Table 7.2. How a 60-40 mix compares to 50-50
|
With 5th-percentile returns |
60-40 and 50-50 about the same |
|
With median returns |
60-40 is better |
|
With 95th-percentile returns |
60-40 is much better |
Given these findings, I would recommend a 60-40 asset mix over 50-50 in the case of a recently retired couple, provided they have some tolerance for risk. Unless indicated otherwise, please note that all the case studies shown for the remainder of this book are based on a 60-40 mix.
I concede that in two rather unlikely situations, a 50-50 mix might be preferable. In the first instance, it would be true if bond yields go even lower, although there isn’t much room for this to happen. The Monte Carlo simulation I used to assess the different asset mixes assumed that bond yields will rise slowly in the next few years, and while that is the more likely scenario, it is not a certainty.
The other instance in which a 50-50 mix might be better is if you encounter investment returns even worse than the so-called worst-case scenario I have been using so far. We will delve into this grim prospect in the next chapter.
Takeaways
- Future investment returns will almost certainly be lower than historical returns for many years to come.
- You might be able to avoid 5th-percentile investment returns by putting all your money in a savings account.
- Stay away from investing in second mortgages.
- Real estate investing can be lucrative for long-term investors, but it is not for amateurs and it is not without risks.
- You might invest some of your savings in T-bills or other short-term investments but only a smallish portion.
- Long-term bonds will be especially poor performers, since bond yields have nowhere to go but up, and this would create capital losses. This includes real return bonds.
- Your best bet for a 5 percent annual return is to invest in equity funds, risky as they are.
- A 60-40 asset mix is probably better than 50-50 in the case of retirees with average risk tolerance.