Chapter 14
Na+-Ca2+ Exchange Currents
Chapter Outline
III. Energetics of Na+-Ca2+ Exchange
IV. Methods and Problems Associated with the Measurement of Na+-Ca2+ Exchange Current
V. Isolation of Na+-Ca2+ Exchange Current
VI. Ionic Dependencies of Na+-Ca2+ Exchange Current
VII. Regulation of Na+-Ca2+ Exchange Current
VIII. Structure of NCX and its relationship to function
IX. The Phylogeny of the Na+-Ca2+ Exchanger
X. Isoforms of the Na+-Ca2+ Exchanger
XI. Current–Voltage Relationships and Voltage Dependence of Na+-Ca2+ Exchange Current
XII. Mechanism of Na+-Ca2+ Exchange
XIII. Na+-Ca2+ Exchange Currents during the Cardiac Action Potential
XIV. Na+-Ca2+ Exchange Currents and Excitation–Contraction Coupling
I Summary
At first, study of the Na+-Ca2+ exchange current was impeded because multicellular preparations did not permit adequate control of the driving forces producing exchange. However, methods for isolating single cells, together with the patch-clamp technique, made it possible to isolate exchange current and to provide reliable measurements of its properties. Now that the exchange molecule has been cloned, it is possible to express the mammalian exchanger in other cell types including frog oocytes. Currents may now be measured in these cell types with the giant patch technique or with the whole-cell patch-clamp method. These preparations and methods introduce the possibility of studying mutated forms of the exchanger with a view to understanding the relationship between structure and function.
Studies with isolated giant patches have resulted in significant advances in our understanding of both the regulation and mechanism of exchange activity. The phenomenon of Na+-dependent inactivation of exchange was first identified in isolated patches and our understanding of secondary Ca2+ regulation, as well as regulation by phosphatidylinositol-4,5-bisphosphate (PIP2) and phosphorylation, have been significantly advanced by this technique. Advances in the molecular biology of the Na+-Ca2+ exchanger – which include the elucidation of the primary structure of the exchange molecule together with the development of recombinant DNAs coding for the Na+-Ca2+ exchanger, their expression in systems suitable for current measurement and, finally, the production of various mutations – have already resulted in extensive studies of the relationship between structure and function which we have discussed in this chapter.
Measurements of both whole-cell currents as well as currents in giant patches have produced evidence in favor of the idea that a consecutive mechanism can explain exchange activity. Moreover, at least two laboratories have claimed to have isolated currents associated with partial reactions of the exchanger consistent with the idea that a consecutive (ping-pong) reaction scheme is operative. Preliminary results seem to suggest that much of the voltage dependence of the exchange resides in rate-limiting steps associated with Na+ translocation in NCX1, although not with NCX-SQ1, in which voltage dependence appears to be associated with Ca2+ translocation. With the availability of the techniques of modern molecular biology, it seems likely that we may expect further progress in the study of the relationship between the structure and function of the exchange molecule. Elegant measurements of whole-cell currents have resulted in a plausible model of the behavior of the Na+-Ca2+ exchange during the cardiac cycle. The way that the Na+-Ca2+ exchange contributes to excitation coupling is not completely understood but is an active area of research. The advent of peptide inhibitors like XIP, together with methods for rapidly changing extracellular solutions, suggest that we may soon gain more insight into the contribution of both inward and outward exchange currents to the events of excitation–contraction coupling.
II Introduction
The existence of Na+-Ca2+ exchange was first postulated in 1964 by both Repke (1964) and Langer (1964) as a consequence of their studies on the contractility of heart muscle. Three years later, Baker and his colleagues (Baker et al., 1967) provided the first report documenting Na+-Ca2+ exchange in giant squid axons. Shortly after this, Reuter and Seitz (1968) presented the first complete study describing Na+-Ca2+ countertransport in heart. Based on studies of isotopic fluxes, these authors proposed that two Na+ ions were coupled to the extrusion of a single Ca2+ ion in a modified exchange diffusion process. Blaustein and Hodgkin (1969) then published the results of their studies on squid axons. They recognized that the distribution of free Ca2+ could not be predicted on simple electrochemical principles. However, cyanide (which was expected to block metabolic processes) failed to prevent the efflux of 45Ca, so that it seemed unlikely that a metabolic pump was involved in Ca2+ extrusion. However, this efflux of Ca2+ was (among other things) dependent upon external Na+. Blaustein and Hodgkin therefore concluded that, in unpoisoned axons, some or possibly all of the energy for extruding Ca2+ ions came from the inward movement of Na+ down its electrochemical gradient.
These early studies were seminal and provided impetus for an enormous number of subsequent investigations that have led not only to a study of Na+-Ca2+ exchange currents, but to the molecular cloning and elucidation of the structure of the exchanger molecule itself. This, in turn, introduced the possibility of studying the relationship between molecular structure and function.
This chapter provides a brief description of current knowledge of Na+-Ca2+ exchange currents. The ease with which heart cells can be patch-clamped, together with the presence of a vigorous exchange activity, doubtless explains the fact that most of our information on exchange current comes from this tissue. Na+-Ca2+ exchange currents have been measured in other cell types including the squid giant axon (Matsuoka et al., 1997). Although measurements of exchange current are difficult in many tissues, it is now possible to express Na+-Ca2+ exchangers in other cell types, for example frog oocytes. This, together with the development of giant excised patches that can be voltage-clamped, has made studies of the relationship between structure of the exchanger and function much easier.
III Energetics of Na+-Ca2+ Exchange
Reuter and Seitz in their classic study (Reuter and Seitz, 1968) proposed that two Na+ ions exchanged for a single Ca2+ ion in a modified exchange diffusion process. Based upon this proposal, one would not expect steady-state exchange activity to produce a measurable electric current. However, the existence of exchange currents is a well-established fact and one that can be appreciated by consideration of the energetic and stoichiometric properties of the exchange as they are currently understood. It is convenient (but not necessarily correct) to represent the transmembranous exchange reaction as a sequential (simultaneous) process:

where n is the stoichiometric coefficient of the exchange reaction. If the forward and reverse reaction rates are equal, the exchange reaction is at equilibrium. Even if n is greater than 2, there can be no net charge movement and, hence, no electric current generated at equilibrium. An electric current can only be measured when the exchange is displaced from equilibrium. While the net reaction rate at equilibrium is zero, the unidirectional rates might be substantial (Axelsen and Bridge, 1985). As soon as the forward and reverse exchange rates differ from one another, net ion translocation takes place; provided that the stoichiometric coefficient is appropriate (i.e. n greater than 2) and no ions of opposite charge are co-transported, one can expect to measure an electric current as a consequence of exchange.
If electrochemical forces solely determine net movement of ions through the Na+-Ca2+ exchanger, classical thermodynamics may be used to calculate both the direction of exchange and the conditions under which we may expect equilibrium to occur. Having the capacity to do this is of enormous value when designing experiments to measure exchange currents. The electrochemical potential difference or driving force ( ) producing exchange is the difference between n times the electrochemical potential difference or force producing sodium movement (
 ) and calcium movement (
 ). Driving force can be expressed in terms of membrane potential (Em), Na+ equilibrium potential (ENa) and Ca2+ equilibrium potential (ECa). Thus, we may write:
 (14.1)
At equilibrium, Δ =
= 0, so that:
 (14.2)
 (14.3)
 (14.4)
Substitution yields:
 (14.5)
The exponential form of Equation 14.5 is:
 (14.6)
The driving force Δ on exchange is given as:
 (14.7)
These are the equations that can be used to predict the equilibrium conditions of the exchanger. Before doing so, one needs to know the stoichiometric coefficient (n) of the exchanger. This issue has been the subject of a lengthy debate and numerous investigations. However, there now appears to be broad agreement that three Na+ ions are exchanged for a single Ca2+ ion in most mammalian systems studied (Bridge and Bassingthwaighte, 1983; Reeves and Hale, 1984; Kimura et al., 1987; Bridge et al., 1990; Crespo et al., 1990). There is also good evidence that exchange stoichiometry is 3:1 in barnacle fibers (Rasgado-Flores and Blaustein, 1987).
Besides predicting equilibrium conditions we can, with sufficient information, predict the direction of exchange. Consider a heart cell at rest (or during diastole). If we assume the internal Na+ concentration is 5 mM and Ca2+ is at 100 nM while external Ca2+ is 2 mM and Na+ is 140 mM and, finally, the membrane potential is −80 mV, we can use Equation 14.7 to predict the direction of exchange if we assume n to be three (Fig. 14.1A). Thus the driving force on exchange is 18 mV which produces a net extrusion of Ca2+. The exchange is said to be operating in its forward mode and there is net inward charge movement or a net inward current. If the cell is depolarized to +50 mV, the quantity Δ becomes −112 mV and there is net Ca2+ influx through the exchange (see Fig. 14.1C). The exchange is then said to be operating in reverse mode and there is net outward current. Finally, equilibrium will occur at –62 mV for these ionic concentrations (see Fig. 14.1B). It should be noted that, in a cell like a heart cell, which has a small surface to volume ratio, ion movements through the exchange may alter the intracellular concentrations so that the quantities that we have just calculated will change. For a description of the way that the exchange changes during the phases of a cardiac action potential, we refer the reader to Bers (2001).

FIGURE 14.1 (A) The red arrow represents the rate of the forward exchange reaction which exceeds the rate of the reverse reaction represented by the blue arrow (see the reaction described in section II). This results in net extrusion of Ca2+ and a net inward current (light blue arrow). This is usually referred to as the forward mode of the exchange. The calculations to the right of all figures simply indicate the magnitude and direction of the driving force producing net exchange. (B) The red and blue arrows have the same significance as in (A). In this case, the forward and reverse reactions occur at the same rate so that there is no net reaction and therefore no net current. The exchange is at equilibrium, as the calculation to the right indicates, i.e. there is not net driving force on the exchange. (C) Again red and blue arrows retain their significance. However, the rate of the reverse reaction exceeds the rate of the forward reaction. This results in net influx of Ca2+ accompanied by an outward current. The calculation to the right indicates both the magnitude and direction of the driving force.
An elegant (though somewhat indirect) demonstration of exchange stoichiometry was provided by Reeves and Hale (Reeves and Hale, 1984). This demonstration employed the foregoing principles and equations. Their study not only produced a value for the exchange stoichiometry, but provided an excellent example of the way that the foregoing energetic principles may guide experimental design. These authors took advantage of the fact that exchange equilibrium can be achieved simply by appropriate adjustment of the Na+ and Ca2+ electrochemical gradients. Bovine sarcolemmal vesicles containing Na+-Ca2+ exchanger were equilibrated with solutions of both Na+ and 45Ca. Under these circumstances, the equilibrium may be described by Equation 14.5. After treating the membrane with valinomycin in the presence of KCl, known membrane potentials were established that caused disequilibrium of the exchanger and either Ca2+ entry or exit. By adjusting the Na+ gradient, it was possible to null precisely the tendency of membrane potential to produce Ca2+ movement. Thus, if any of the quantities Em, ENa, and ECa are held constant, the relationship between the other two may be found. The point at which Ca2+ movement was nulled by Na+ gradient is given by:
 (14.8)
By nulling Ca2+ movement over a range of membrane potentials, the value for n that these authors obtained was 2.97±0.03, which is close to the currently accepted value of 3.0.
IV Methods and Problems Associated with the Measurement of Na+-Ca2+ Exchange Current
Several recent techniques have greatly facilitated the isolation of exchange current. First, the whole-cell ruptured patch voltage clamp in conjunction with intracellular dialysis (Hamill et al., 1981) has probably contributed most to the initial isolation of exchange currents. To record whole-cell current with the ruptured patch technique, a microelectrode or patch pipette is pressed onto the cell membrane and suction is applied, usually with a syringe or directly by the experimentalist. This often results in a high-resistance seal that forms between the pipette and the cell membrane. The resistance of this seal is ideally >1010 ohms and it is therefore referred to as a gigaseal. This is usually accompanied by the formation of an Ω structure as the membrane is pulled into the pipette (see Chapter 20). Continued suction ruptures the Ω, and this creates continuity between the cell interior and the pipette solution. By pulling the sealed pipette from the cell one may isolate an outside-out patch. It is also possible with the methods illustrated in Chapter 20 to create an inside-out patch. Hilgemann has refined this technique so that very large membrane patches can be isolated from appropriately treated cell membranes (Hilgemann, 1989).
A simplified arrangement for voltage-clamping heart cells and recording exchange current through a ruptured patch is depicted in Fig. 14.2. Essentially the same arrangement applies to the voltage-clamping of an isolated patch. The micropipette attached to the cell is connected via a (non-polarizable) electrode to the front end of a high-gain amplifier known as a current-to-voltage converter. The most significant feature of this high amplifier is the feedback loop Rf and its branch point (the summing junction). In operational amplifiers (of which this current-to-voltage converter is an example), this branch point has special significance. Negative feedback through the feedback loop tends to cancel the input signal at S. A command potential Vc is applied to the non-inverting input (+). A property of this amplifier is that, as a result of negative feedback through Rf, current always flows so that the voltage at the summing junction is identical to the voltage Vc (the command potential). The potential difference between the summing junction and ground is therefore ideally equal to Vc. This potential difference therefore falls across the electrode resistance (and any other resistances in series with the membrane resistance Rm). Provided that the product of this series resistance (Rs) and the exchange current INa-Ca (Rs INa-Ca) is small, most of the potential difference Vc occurs across the membrane. Feedback through Rf always compensates varying input at the summing junction, thus ensuring that the voltage across the membrane is held constant (i.e. is clamped). Exchange current INa-Ca passing across the membrane produces a potential difference across the membrane. As this potential difference causes the membrane potential to depart from Vc, current (equal in magnitude to the exchange current) flows into the summing junction. In reality, additional circuitry is required to reduce noise in the recording system while increasing its fidelity. This is dealt with in greater detail in Chapter 20.
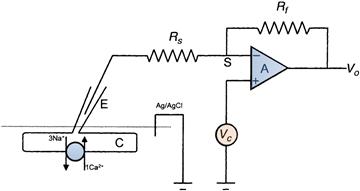
FIGURE 14.2 An arrangement suitable for measuring Na+-Ca2+ exchange current in a ventricular heart cell. Under these circumstances, the exchanger is producing a net outward current across the cell membrane by exchanging three internal Na+ ions with a single external Ca2+ ion. This produces outward movement of one net charge. The voltage-clamp circuit consists of a high-gain amplifier A. Any deviations from the command potential Vc produced by the exchanger are compensated by feedback from the output through the feedback resistor Rf. The amplifier is connected to the cell through the electrode E, which is sealed to a ruptured patch. The output of this amplifier is proportional to the current flowing through the feedback resistor Rf and hence the cell C. The success of this method depends upon minimizing voltage drops across the series resistance Rs. The bath in which the cell is maintained is grounded by an Ag/AgCl electrode connected to a salt bridge (not shown).
The current flowing through a heart cell membrane, Im, consists of two components: a capacity current and an ionic current Ii. The capacity current IC=CdV/dt and the membrane current is denoted Im. Therefore:
 (14.9)
The ionic current consists of ions flowing through ion channels as well as those translocated by ion exchange mechanisms (principally the Na+-Ca2+ exchange and the Na+ pump). For purposes of illustration, the exchange current has been separated from the ionic current in Equation 14.9. Under voltage-clamp dV/dt=0,
 (14.10)
If one can remove or minimize Ii (which includes the Na+ pump current and all contaminating channel currents) without affecting exchange current INa-Ca, one may measure a membrane current that is comprised mainly of INa-Ca.
How will the activity of an electrogenic Na+-Ca2+ exchange affect membrane potential? A convenient equivalent circuit to explain this is depicted in Fig. 14.3. This simplified equivalent resting membrane circuit consists of a membrane capacitance that is in parallel with a battery Em, which is largely responsible for producing the membrane potential. The membrane resistance Rm is modeled as the internal resistance of this battery. Under resting conditions, the reversal potential for the Na+-Ca2+ exchange in heart is approximately −40 mV. At −80 mV the exchange will produce a net inward current, which can be modeled as a current generator that is in parallel with the membrane battery and capacitance (Fig. 14.3). At the steady state, when the resting membrane potential is not changing, C dV/dt=0. Thus, the net membrane potential is composed of contributions from ionic currents (mainly through K+ channels), exchange currents and the Na+ pump current (Equation 14.10). The exchange will produce an IR drop across the membrane resistance so that the contribution of Na+-Ca2+ current to the membrane potential (VNa-Ca) at rest is given by:
 (14.11)
A large inward exchange current produced by elevated intracellular [Ca2+] may be of the order 200 pA. If we assume that the resting exchange current is one-tenth of this value and given a resting Rm of 50 mΩ, the exchange will contribute about 1 mV to the resting membrane potential. In reality, the value is likely to be less than this but cannot be specified with certainty because reliable measurements of resting current are not available.

FIGURE 14.3 A simple equivalent circuit for a resting heart cell. The resting membrane potential Em is typically about −80 mV. This resting membrane potential is modeled as a battery in series with an internal resistance of about 50 M . The membrane capacitance is in series with the battery. The Na+-Ca2+ exchanger may be considered to be a current generator in parallel with the battery and membrane resistance (symbolized by an open circle containing an arrow). At rest, with the exchanger steadily extruding Ca2+, a small depolarizing current INa-Ca causes a small voltage drop across the membrane resistance Rm. The solid arrows indicate the direction of current. The circle containing an arrow indicates a current generator (the Na+-Ca2+ exchange). Thus, for each cycle of the exchanger a single net charge is conveyed from the cell exterior to its interior.
The first observations of exchange current were not published until nearly 20 years after Reuter and Seitz originally reported Na+-Ca2+ exchange activity in heart tissue. It is worth considering some of the problems associated with the measurement of exchange current that might account for this lengthy hiatus.
To stimulate exchange so that it can be measured, one can either change electrochemical gradients (and hence the exchange driving forces) by using a voltage-clamp step or one can abruptly change external ion composition with a rapid switching device. In the case of the voltage-clamp step, the experimentalist must have a complete understanding of what interfering currents will be activated, as well as some means of inhibiting them. If exchange is to be activated by changing ionic gradients, then these changes must be sufficiently rapid that they are not immediately dissipated by the exchange activity. It is difficult rapidly to change or control extracellular ionic composition in multicellular preparations because diffusion distances are large and diffusion may be hindered by a surface structure. In multicellular preparations, voltage-clamp is usually established with small microelectrodes, which are unsuitable for cell dialysis. It is, therefore, very difficult to control the intracellular ionic composition. This doubtless contributed to the difficulty of isolating exchange currents in multicellular preparations. Despite these difficulties, a measurement of exchange currents has been reported in multicellular preparations (Horackova and Vassort, 1979).
Recently, it has proved feasible to use the patch-clamp technique in conjunction with wide-tipped microelectrodes (10-μm diameter) to obtain an isolated patch whose surface area is approximately 75 μm2 (see Fig. 14.2). A conventional isolated patch is of the order 2–3 μm2. These giant patches are sufficiently large to permit the detection of exchange currents (Hilgemann, 1989). Their great virtue is that they permit relatively easy access to either side of the membrane. Thus, solution adjacent to the external surface of the sarcolemma can be changed by changing the pipette solution. The internal surface of the sarcolemma can be changed rapidly by changing the bathing solution. Clearly, this method of voltage-clamp allows the experimentalist considerable control over the forces that drive exchange.
Several other techniques have recently become available that improve exchange current isolation. For example, forward exchange current in intact cells can be activated by abruptly elevating intracellular Ca2+, which is then transported to the cell exterior. This has been accomplished in an elegant fashion by Niggli and Lederer (Niggli and Lederer, 1991). These workers used the compound DM-dinitrophen that is commonly referred to as caged Ca2+. This can be introduced into the cell interior through a patch pipette. Upon appropriate irradiation with UV light, Ca2+ is released from the caged Ca2+ with extremely rapid kinetics. This abruptly elevates cytosolic Ca2+ and transiently stimulates forward Na+-Ca2+ exchange as the released Ca2+ is pumped to the cell exterior.
As we have indicated, to activate exchange it is desirable to change external ionic composition (and the electrochemical gradients driving exchange) extremely rapidly in comparison with the time required for the exchange to dissipate these changes. It is now possible to change external solutions surrounding heart cells or isolated patches with a half-time of about 20 ms (this includes exchange of the unstirred layer). One method consists of placing a cell with attached microelectrodes in one of two adjacent microstreams of solution (Spitzer and Bridge, 1989). The boundary separating these streams is abruptly moved across the cell so that it is placed in the adjacent stream. This rapid switching method has proved valuable in stimulating both inward and outward exchange currents (Chin et al., 1993).
V Isolation of Na+-Ca2+ Exchange Current
VA Whole-Cell Patch-Clamp Studies
The first clear evidence that an electric current was generated by Na+-Ca2+ exchange was provided simultaneously by Kimura and coworkers (Kimura et al., 1986) and by Mechmann and Pott (Mechmann and Pott, 1986). Given the probable stoichiometry of the exchange, electrophysiologists expected to be able to measure a current generated by the exchange. By using the whole-cell patch-clamp technique together with intracellular dialysis, Junko Kimura and her associates were able to isolate the Na+-Ca2+ exchange current. These investigators voltage-clamped guinea pig ventricular myocytes with single microelectrodes. The pipette contained a dialyzing solution completely deficient in Na+ and in which Ca2+ was buffered to a value of 73 nM with EGTA. The superfusing external solution contained no Ca2+. Under these circumstances, no exchange could take place. Very little change in current was observed when external Ca2+ was reapplied and subsequently removed. However, an outward current was generated after changing the pipette solution for one containing 30 mM Na+ and then applying 1.0 mM external Ca2+. Under these circumstances, Ca2+ entered the cell in exchange for internal Na+, which was extruded. This current (Fig. 14.4) is clearly attributable to the operation of electrogenic Na+-Ca2+ exchange. This conclusion was strengthened by several additional observations. Upon removal of external Ca2+, the current was turned off. The current was reduced when lower concentrations of dialyzing Na+ were used and enlarged by increasing external Ca2+. Thus, the current exhibited the expected dependency on both Na+ and Ca2+. The current was blocked by La3+, which is known to block Na+-Ca2+ exchange. The current also exhibited voltage dependence (see Section XI). One might have expected sustained current under these circumstances, but this was not observed (see Fig. 14.4) and the current exhibited a tendency to decay. One plausible explanation for this is that excessive Ca2+ entry displaces protons when it is buffered by the dialyzing EGTA. The resulting acidification in the vicinity of the exchanger should inhibit exchange activity. An alternative possibility is that EGTA fails to buffer incoming Ca2+, which accumulates in the vicinity of the exchanger. The resulting collapse of the Ca2+ gradient would also slow exchange.
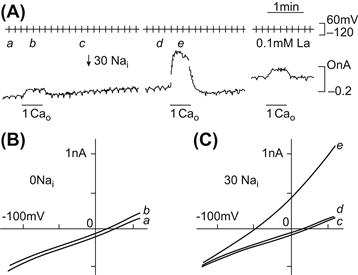
FIGURE 14.4 (A) Voltage-clamp record from a single myocyte showing voltage (upper trace) and current (lower trace). A ramp pulse from +60 mV to −120 mV was given from a holding potential of −30 mV every 10 s at a ramp speed of about 0.2 V/s. Current–voltage relationships were then constructed. An application of 1 mM Ca2+ in the absence of intracellular Na+ (zero pipette Na+) produced a small outward current. To exchange the pipette solution, a piece of tapered polyethylene tube was inserted into the pipette. The arrow indicates when the solution change was started. The holding current shifted outward slightly on loading Na+. The middle current record shows 1 mM Ca2+ superfusion in the presence of 30 mM pipette Na+. The Ca2+-induced outward current appears to decay after reaching a peak. Current undershoot is seen after washing off Ca2+. These phenomena may be due to Ca2+ accumulation immediately below the membrane of acid induced by binding of Ca2+ to EGTA. (B) I-V relations measured before (a) and during (b) 1 mM Ca2+ superfusion in the absence of Nai+. (C) I-V curves before (c) and after (d) loading Nai+ and during subsequent 1 mM Cao2+ application (e). (Reprinted from Kimura et al. (1986) with kind permission of the authors and Journal of Physiology.)
Kimura and colleagues reported the measurement of an outward current corresponding to the entry of Ca2+ and extrusion of Na+ from the cell. Mechmann and Pott demonstrated the existence of an inward exchange current corresponding to Ca2+ extrusion and Na+ entry into a cardiac cell (Mechmann and Pott, 1986). In one experiment, these authors voltage-clamped spherical atrial cells from an adult guinea pig. Transient inward current occurred spontaneously in this preparation. These transient inward currents seemed to depend on intracellular Ca2+ because they were abolished if the cell was dialyzed with 1.0 mM EGTA. Moreover, they could not be elicited in the presence of caffeine, which depletes the SR of Ca2+. Presumably, the transient release of SR Ca2+ activated these currents. The currents also showed a dependence on extracellular Na+ and voltage as expected of a Na+-Ca2+ exchange current. The more negative the voltage, the larger the inward current. This is reasonable and simply indicates that, at more negative potentials, the exchange rate is greater so that Ca2+ released from the SR is removed rapidly from the cell.
Shortly after these early demonstrations of exchange current, Hume and Uehara were able to demonstrate Na+-Ca2+ exchange currents in isolated frog atrial cells by using the whole-cell patch-clamp technique in combination with intracellular dialysis (Hume and Uehara, 1986a,b). It is fair to say that since this time measurement of exchange current has become both reliable and routine. An example of an inward exchange current measured in a ventricular cell is displayed in Fig. 14.5.
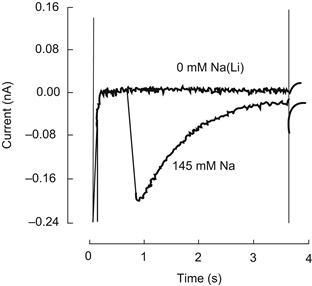
FIGURE 14.5 Transient inward Na+-Ca2+ exchange. To activate this current, a guinea pig ventricular cell was tetanized with voltage-clamp pulses in the presence of ryanodine and in the absence of external Na+. This resulted in an elevation of cytosolic Ca2+ and a sustained contraction (not shown). Abrupt application of 145 mM extracellular Na+ while the cell was held at −40 mV produced mechanical relaxation and activated a transient inward Na+-Ca2+ exchange current. As intracellular Ca2+ declined, the current decayed.
The development of the giant patch technique has also facilitated measurement of the exchange current produced by the squid exchanger NCX–SQ1 (He et al., 1998).
VB Na+-Ca2+ Exchange Current Reversal Potential
It is desirable when studying any ionic current to be able to demonstrate a reversal potential for that current. The existence of reversal potentials is a thermodynamic necessity and provides one of the least ambiguous ways of identifying an ionic current. However, it is not always a straightforward matter to demonstrate reversal potentials. For example, if exchange current were extremely small over a large voltage range in the vicinity of the reversal potential, then the precise potential at which zero current occurred could be extremely difficult to specify. Moreover, subsarcolemmal spaces from which diffusion is restricted can produce changes in ionic concentration that confound measurement of the exchange reversal potential. For the Na+-Ca2+ exchange in heart, the reversal potential is given by Equation 14.8. For the conditions of their experiment, Kimura and coworkers (see Fig. 14.4) calculated that the reversal potential of exchange ought to be −131 mV (Kimura et al., 1986). Their results indicate that exchange current becomes zero at a potential close to this value. Ehara and colleagues extended studies of the exchange reversal potential (Ehara et al., 1989). With the fairly specific exchange inhibitor Ni2+, these authors were able to show that, over a wide range of external Na+ values, the measured exchange reversal potential conformed to theoretical expectation. Moreover, in view of the wide range over which the reversal potential remains constant, the stoichiometry is unlikely to vary.
VI Ionic Dependencies of Na+-Ca2+ Exchange Current
It is of considerable physiological significance that the Na+-Ca2+ exchange current is extremely sensitive to internal Na+. There are two aspects of this sensitivity to consider, one purely thermodynamic and the other kinetic. If we assume that a resting heart cell contains 100 nM free cytosolic Ca2+ and is bathed in 2.0 mM Ca2+ and 140 mM Na+, we can use Equation 14.8 to calculate the way the exchange reversal potential varies with internal Na+. The results are displayed in Fig. 14.6.
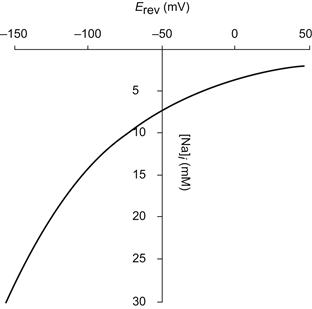
FIGURE 14.6 Calculated variation of exchange reversal potential with intracellular Na+. Intracellular Ca2+ was set at 100 nM and extracellular Ca2+ was 2.0 mM. Extracellular Na+ was 140 mM.
It is apparent that with 7 mM intracellular Na+, 140 mM extracellular Na+, and 100 nM intracellular free Ca2+, the reversal potential for exchange is approximately −50 mV. Since the resting membrane potential is at least 30 mV negative to this, at rest the exchanger will extrude Ca2+. However, a modest increase in intracellular Na+ to 12 mM would change the reversal potential by 14 mV to –64 mV. Were the Na+ to accumulate to 15 mM, then the reversal potential would be −80 mV. Since the resting potential is likely to be close to this value, the exchange would be close to, or at equilibrium and would be incapable of extruding intracellular Ca2+. Further Na+ accumulation would cause the exchange to reverse and transmit Ca2+ into the cell. Na+ accumulation will tend to bring the exchange closer to its equilibrium potential and, therefore, increase the likelihood of Ca2+ entry via the exchanger upon membrane depolarization. Cardiac glycosides which, depending on dose, partially or completely block the sodium pump, tend to produce an accumulation of intracellular Na+ (Sheu and Fozzard, 1982). Part of the basis of their inotropic effect resides in their shifting the reversal potential of the Na+-Ca2+ exchange to more negative values. In extreme cases, this will prevent Ca2+ extrusion which, in the face of continued Ca2+ leak, will lead to Ca2+ accumulation.
The Na+-Ca2+ exchange current also exhibits a physiologically important kinetic dependence upon internal Na+. This issue has been investigated directly by Miura and Kimura, who studied outward exchange current in guinea pig ventricular cells under voltage-clamp (Miura and Kimura, 1989). Intracellular Ca2+ was buffered to 100 nM and intracellular Na+ was varied by varying the pipette Na+ concentration. External Na+ was reduced to zero and a unidirectional exchange reaction was activated by applying 0.2 mM Ca2+ as rapidly as possible to the cell exterior. The results demonstrate that exchange current density exhibits a steep and somewhat sigmoid dependence on internal Na+. The Km for this dependency is approximately 20 mM and Hill plots reveal a Hill coefficient of 1.9. It is notable that an application of rate theory revealed that the voltage dependence of the exchange did not depend on intracellular Na+ (see Section XI). It is clear from these results that at least Ca2+ influx on the exchange will be extremely sensitive to fluctuations in intracellular Na+ produced, for example, by increases in stimulation rate or cardiac glycosides. It is unfortunate that we have no information on the intracellular Na+ dependence of inward exchange current which corresponds to Ca2+ efflux. However, studies with isotopic fluxes reveal that Na+ and Ca2+ compete for transport on the exchanger. For example, Na+ on the same side of the cardiac sarcolemmal membrane as Ca2+ inhibits Ca2+ flux through the exchanger with a Ki of about 15 mM (Reeves and Sutko, 1983). Finally, the net inward exchange current does depend on external Na+. This has been investigated by Kimura and coworkers, who showed that inward current exhibited a sigmoidal dependence on external Na+ with a K1/2 of 87.5 mM and a Hill coefficient of 2.9 (Kimura et al., 1986).
Net inward exchange current (i.e. Ca2+ extrusion in exchange for Na+ entry) is also dependent on intracellular Ca2+. The relationship between Ca2+ concentration and current has been measured in two different ways. Miura and Kimura used whole-cell patch-clamp on guinea pig myocytes to determine Km (Ca2+) (Miura and Kimura, 1989). They controlled intracellular Ca2+ by dialyzing the cell with various EGTA-buffered solutions and determined a Km (Ca2+) to be 0.6 μM. With a different approach, Barcenas-Ruiz and colleagues used guinea pig ventricular myocytes to measure exchange current and intracellular Ca2+ simultaneously (Barcenas-Ruiz et al., 1987). Intracellular Ca2+ was measured with the Ca2+-sensitive indicator Fura–2, introduced through the dialyzing pipette used to voltage-clamp the cells. Heart cells can be tetanized or caused to go into contracture in the presence of ryanodine. Various clamp pulses up to 120 mV in amplitude (holding potential of −80 mV) produced slow and sustained increases in Ca2+. This Ca2+ declined upon repolarization and the decline was accompanied by a Na+-Ca2+ exchange current tail. Plots of current against [Ca2+]i revealed a linear relationship and no sign of saturation (Fig. 14.7). It is not possible to extract a Km value from these data since the relationship between Ca2+ and current does not saturate. However, it is reasonable to conclude that the Km value is well above the 0.6 μM obtained by Kimura and colleagues. Discrepancies of this nature are not easy to resolve. It is, however, worth noting that EGTA has the rather curious effect of increasing the affinity of the exchanger for Ca2+ (Trosper and Philipson, 1984).
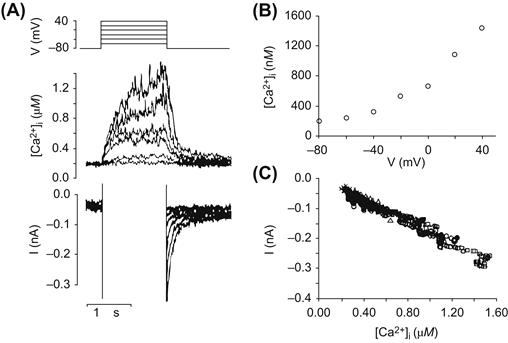
FIGURE 14.7 Changes in [Ca2+]i and membrane current attributed to Na+-Ca2+ exchange in a single guinea pig ventricular myocyte under voltage-clamp. Micropipette [Na+] was 7.5 mM. (A) Simultaneous recordings of [Ca2+]i and membrane current. The holding potential was −80 mV, and depolarizing pulses lasting for 1.5 s were given from −60 mV to +40 mV. Outward currents during the depolarizing pulse are off-scale. (B) Voltage dependence of the change in [Ca2+]i. Values plotted are average [Ca2+]i over the last 200 ms of the depolarizing pulse. (C) The relationship between [Ca2+]i and membrane current after repolarization. The current, I, has been plotted as a function of [Ca2+]i at 2 ms intervals during the first second after repolarization from +40 mV (circles), 0 mV (triangles), −20 mV (diamonds), and −40 mV (crosses). (Reprinted with permission from Barcenas-Ruiz, L., Beuckelmann, D.J. and Wier, W.G. (1987). Sodium-calcium exchange in heart: membrane currents and changes in (Ca2+)i. Science. 238, 1720–1722. Copyright 1987 American Association for the Advancement of Science).
VII Regulation of Na+-Ca2+ Exchange Current
The regulation of Na+-Ca2+ exchange current has largely been studied in NCX1. We will consider five types of regulation. First, intracellular Ca2+ regulates the exchange current. The exchange current also exhibits a regulatory phenomenon known as Na+-dependent inactivation. Thus, the exchanger not only transports Na+ and Ca2+, but these ions are capable of regulating its function as well. Exchange current is also known to be regulated by phosphatidylinositol-4,5-bisphosphate (PIP2), phosphorylation and, finally, the XIP region of the exchanger in the cytosolic loop appears to be involved in the regulation of the NCX (see Section VIII). In addition, a great deal has been learned about regulatory function and its relationship to the structure of the exchanger.
VIIA Regulation by Na+ and Ca2+
There are two Ca2+-binding sites on the cytoplasmic loop of NCX (see Section VIII). It is now apparent that Ca2+ influx in exchange for internal Na+ cannot occur if intracellular Ca2+ is reduced below a certain critical level. Dipolo provided the first evidence that Ca2+ was required to activate NCX (DiPolo and Beauge, 1987b). However, in isolated patches from cardiac cells, the KD appears to be from 0.1 to 0.3 μM (Hilgemann et al., 1992b; Matsuoka et al., 1995). This is reasonable because Ca2+ in junctional regions is thought to rise by as much as 15 μM (Acsai et al., 2011). The possible physiological significance of Ca2+ regulation will be discussed in a later section. Moreover, regions of the NCX molecule involved in Ca2+ regulation are now understood (see section VIII). Na+-dependent inactivation of exchange current is a rather curious regulatory phenomenon first described by Hilgemann and coworkers (Hilgemann et al., 1992b). Outward Na+-Ca2+ exchange currents were activated in giant sarcolemmal patches by increasing Na+ on the cytoplasmic side of the patch. Ca2+ was then transported from the pipette to the cytoplasmic side of the patch in exchange for Na+. This outward current declined with a time constant of approximately 1 s. This decay rate is far too low to represent an initial turnover of exchangers and it appears to be a true regulatory phenomenon. An example of this sort of behavior is displayed in Fig. 14.8. Here, application of 100 mM Na+ to the cytoplasmic surface activated a transient outward current. It is believed that the XIP region of the exchange molecule (see Section VII) is involved in this process.
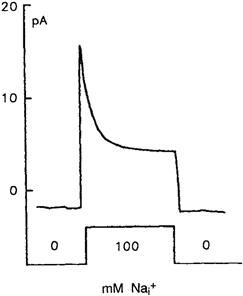
FIGURE 14.8 Secondary modulation of outward Na+-Ca2+ exchange current in giant excised inside-out patches (37°C, 0 mV). Current transients activated with 100 mM Na+ (substituted for 100 mM Cs+). (This figure was kindly provided by Dr Donald Hilgemann.)
VIIB PIP2
Hilgemann has been able to show that outward exchange current in isolated giant sarcolemmal patches is stimulated by MgATP (Hilgemann, 1990). With this preparation, it is possible to control MgATP on the cytoplasmic side of the cell membrane. This stimulation by MgATP appears to be a different process than that described in squid axon. For example, it does not appear to involve a protein-dependent kinase (Collins et al., 1992). Hilgemann has also shown that brief treatment of membrane patches with chymotrypsin abolished modulation of exchange current by MgATP. However, recent evidence has been obtained for a mechanism that seems likely to explain regulation by ATP (Hilgemann and Ball, 1996). It now appears that phosphatidylinositol-4,5-bisphosphate (PIP2) can strongly activate the cardiac Na+-Ca2+ exchanger. Apparently ATP generates PIP2 from phosphatidylinositol (PI). A number of observations suggest that the generation of PIP2 can explain the regulation of Na+-Ca2+ exchange by ATP: (1) PI-specific phospholipase C can abolish the action of ATP which can, in turn, be restored by the addition of exogenous PI. (2) The effect of ATP can be reversed by a PIP2-specific phospholipase C. However, the stimulatory effect of ATP can be mimicked by exogenous PIP2. (3) Aluminum, which binds with high affinity to PIP2, reverses the effect of ATP on the exchanger. It therefore appears that the generation of PIP2 is an important regulator of Na+-Ca2+ exchange activity in heart. A possible mechanism for this is explained in Section VIII.
VIIC Phosphorylation
It has been known for some time that exchange activity in squid giant axons could be regulated by ATP. The main effect of ATP is to increase the affinity of the exchanger for its substrates Na+ and Ca2+. Moreover, recent evidence suggests the involvement of a Ca2+-dependent protein kinase. It appears that, at least in the squid, Na+-Ca2+ exchange that is stimulated by ATP requires intracellular Ca2+ and can be mimicked by hydrolyzable ATP analogs (DiPolo and Beauge, 1987a,b).
It has been difficult to demonstrate regulatory effects of ATP in cardiac tissues. The whole-cell isolated patch technique does not lend itself to studies of this nature because it is extremely difficult, if not impossible, to control intracellular ATP concentrations. However, recent evidence suggests that the molecule may be phosphorylated and regulated by two mechanisms. One which remains controversial is that phophorylation can take place by β-adrenergic/PKA activation. There appears to be stronger evidence that PKC mediated signaling can regulate NCX phosphorylation. We refer the interested reader to the review by Zhang and Hancox (Zhang and Hancox, 2009).
VIID Regulation by the XIP region of the exchanger
The XIP region of the exchanger refers to a stretch of amino acid (Li et al., 1991; Matsuoka et al., 1997) modeled at the N-terminus of the large cytoplasmic loop. This domain, which is well conserved among the exchangers, is autoinhibitory and involved in Na+-dependent inactivation and PIP2 regulation. The mechanisms of action of XIP are unknown. A possible model is that the autoinhibition is accomplished when the site interacts with some other undisclosed region of the exchanger molecule: Na+-dependent inactivation could be explained if high concentrations of Na+ promoted this interaction (Reeves and Condrescu, 2008). PIP2, instead, could exert its effect by interacting with the XIP sequence preventing it to block the exchanger (He et al., 2000). The properties of the XIP region are further discussed in the next section.
VIII Structure of NCX and its Relationship to Function
The cardiac Na-Ca exchanger (NCX1) has been cloned and isolated (Philipson et al., 1988; Nicoll et al., 1990). Besides revealing its primary structure, this has lead to considerable understanding of its regulation and the relationship between its structure and function. These issues will be the focus of this section.
Our current knowledge of the exchanger’s structure principally arises from cysteine accessibility mutagenesis (Nicoll et al., 1999; Iwamoto et al., 2000), epitope mapping (Porzig et al., 1993) and cross-linking studies (Philipson et al., 2002). Although these studies were conducted using the cardiac exchanger isoform, their results are likely to be true for all other isoforms of the exchanger.
The 938 amino acids comprising the primary structure of the exchanger are organized into three regions. The N-terminal region, composed of five transmembrane segments (TMS), a large cytoplasmic loop and a C-terminal group of four TMSs. A schematic drawing of NCX1 is displayed in Fig. 14.9.
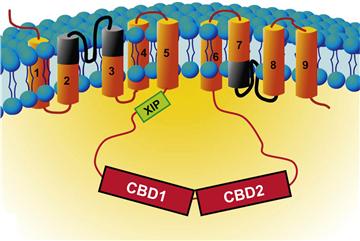
FIGURE 14.9 Secondary structure of the cardiac Na+-Ca2+ exchanger. The exchanger is organized into nine transmembrane segments and a large intracellular loop between TMS5 and 6. The α repeats, which are involved in ion translocation, are indicated in black. The large intracellular loop is involved in NCX regulation. The XIP region, shown in green, is a stretch of residues that controls the Na+-dependent inactivation and the modulation of NCX by lipids. CBD1 and CBD2 are the Ca2+-binding domains. Calcium bound to these sites is not transported but activates the exchanger and rescues it from the Na+-dependent inactivation.
At present, there are no structural data on the exchanger TMSs organization. Nevertheless, extensive disulfide cross-linking studies (Qiu et al., 2001; Ren et al., 2006, 2008, 2010) have provided information on the exchanger TMS packing arrangement. This has enabled Ren and her colleagues to generate a model describing the exchanger TMSs organization (Fig. 14.10).
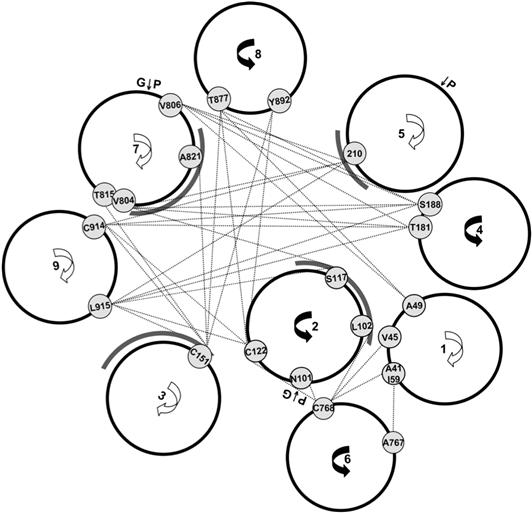
FIGURE 14.10 Computer-generated model of NCX1 helix packing. Pairs of residues that demonstrated cross-linking are indicated with lines. The faces of TMSs that contain residues that have altered activity upon mutagenensis are indicated with gray arcs. (Reprinted from Ren et al. with kind permission of the authors and Biochemistry.)
TMSs 2, 3, 7 and 8 (Qiu et al., 2001) are in close proximity and this is of considerable interest. Within these TMSs are found the α repeats (see Fig. 14.9). These are two stretches of about 40 amino acids each with a similar sequence which are highly conserved among the exchanger family (Schwarz and Benzer, 1997). The α repeats are modeled as spanning TMSs 2 and 3 (α1 repeat) and parts of TMS 7 and the following cytoplasmic loop (α2 repeat). The hydrophilic portions of the α repeats appear to form re-entrant loops (Iwamoto et al., 1999; Nicoll et al., 1999; Shigekawa et al., 2002), similar to P-loops found in ion channels (Hille et al., 1999). This suggests that they are involved in ion translocation. This suggestion has been supported by studying mutations at these sites, which have been shown to affect ion transport (Nicoll et al., 1996; Iwamoto et al., 2000; Ottolia et al., 2005). This provides the first information on regions of NCX that may be crucial for ion translocation. For example, several residues within the hydrophilic region of the α repeats set the sensitivity of NCX for extracellular Ca2+, while two residues within TMS3 (Ala140 and Ile147) of the α1 repeat influence the cytoplasmic affinity of NCX for the transported Na+. To date, the residues that directly coordinate the binding of transported Na+ or Ca2+ have not been found, so that additional studies in this area are required.
Our understanding of the modes of operation of the exchanger has been clouded by new evidence indicating that this secondary transporter exists as a dimer in the plasma membrane. First, cross-linking studies showed that cysteines at position 122 (TMS2) in adjacent exchangers form disulfide bonds (Ren et al., 2008). Similar results were obtained for cysteines introduced at position 40 of TMS1, indicating that NCX exists as oligomers in the plasma membrane. This was then confirmed by fluorescence resonance energy transfer (FRET) studies, which demonstrated the dimeric organization of NCX (John et al., 2011). We will provide a short explanation of this technique shortly. However, how dimerization of NCX affects either its transport or regulatory properties is still unknown.
While transport functions are associated with the transmembrane segments of NCX, the large cytoplasmic loop between TMS 5 and 6 is involved in regulatory mechanisms. This is confirmed by the fact that a mutant lacking this loop still transport Na+ and Ca2+ (Matsuoka et al., 1993). Within this portion of NCX there are several regions of interest. For example, the XIP region is found at the N-terminal side of the loop. This is a stretch of hydrophobic and positive residues (amino acids 219–238) named after a synthetic peptide (exchanger inhibitory peptide) with an identical sequence which potently blocks NCX transport activity (Hilgemann et al., 1991a). This site is mainly known to regulate the Na+-dependent inactivation (see Section VI; Matsuoka et al., 1997) since mutations within it either eliminate this secondary regulation or alter its properties. Also exogenous regulators such as lipids interact with this region to modulate exchanger activity by affecting the Na+-dependent inactivation (He et al., 2000; Riedel et al., 2006).
Two Ca2+-binding domains are downstream of the XIP region (see Figs 14.9 and 14.11). These are indicated as Ca2+-binding domains 1 and 2 (CBD1 and CBD2). In the cardiac exchanger isoform NCX1, CBD1 encompasses residues 371 to 501, CBD2 consists of residues 501–689. Cytoplasmic Ca2+ that binds to these sites is not transported (thereby indicated as regulatory Ca2+) but activates the exchanger and rescues it from Na+-dependent inactivation (Hilgemann et al., 1992a, b).
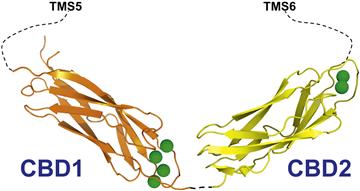
FIGURE 14.11 Structure of the cardiac Na+-Ca2+ exchanger Ca2+-binding domains. Shown is the crystal structure of the first and second Ca2+-binding domains (CBD1 and CBD2). The orientation between the two domains is arbitrary since there is no information about their structure as conjunct domains. CBD1 spans residues 371 to 501, while CBD2 consists of residues 501 to 689 (cardiac isoform, NCX1.1). Calcium ions are shown as green spheres.
Both CBD1 and CBD2 are organized into seven-stranded antiparallel β-sandwiches with Ca2+ ions bound at one end of the β-barrel (Hilge et al., 2006, 2009; Besserer et al., 2007; Johnson et al., 2008; Chaptal et al., 2009; Wu et al., 2009a,b). The structure of the conjunct CBDs is currently unknown. CBD1 binds four Ca2+ ions, however, mutagenesis studies indicate that only the occupancy of sites 3 and 4 is important for Ca2+ regulation (Ottolia et al., 2009). CBD2 coordinates two Ca2+ ions and removal of the primary Ca2+ completely abolishes the sensitivity of NCX to cytoplasmic Ca2+ (Besserer et al., 2007).
While CBD1 does not drastically vary among the exchanger isoforms, CBD2 contains a region of diversity that is the result of alternative exon splicing. Six exons exist within CBD2 which are indicated A to F. While A and B are mutually exclusive, the remaining can mix in different combinations. As a result, CBD2s of different lengths and Ca2+-binding properties are created providing unique biophysical properties to the various NCX products. Generally, exon A-containing exchangers (such as the cardiac NCX) can alleviate the Na+-dependent inactivation at high Ca2+ concentrations while exchangers with exon B (such as NCX1.3, kidney) lack this capability (Dyck et al., 1999; Hilge et al., 2009).
The molecular mechanisms underlying Ca2+ regulation of the exchanger are unexplained. It is reasonable to speculate that the Ca2+-binding domains undergo conformational changes upon Ca2+ binding. This is based on isolated individual and conjoined CBD studies which show the loss of structure of CBD1 in absence of Ca2+ (Hilge et al., 2006). In addition, FRET studies show Ca2+-dependent movements within the isolated CBDs (Ottolia et al., 2004; Xie et al., 2008; John et al., 2011) and the full length exchanger (John et al., 2011).
It has also been proposed that electrostatic interactions occur between CBD1 and CBD2 and that these interactions are disrupted by Ca2+ binding to CBD1 thereby reorienting CBD in respect to CBD2 (Hilge et al., 2009). This model is supported by recent evidence showing that either the orientation or the proximity of CBD1 and CBD2 is important for NCX Ca2+ regulation as is demonstrated by inserting seven alanines between the two CBDs and showing that the resulting ionic currents were less sensitive to cytoplasmic Ca2+ (Ottolia et al., 2010). Subsequently, the kinetic properties of a peptide consisting of the conjunct CBD1 and CBD2 were found profoundly altered by the insertion of the seven alanines (Giladi et al., 2010), consistent with the electrophysiological data.
These results suggest that the two Ca2+-binding domains do not act as separate entities but somehow act synergistically to regulate exchanger activity. Indeed, the apparent affinity of the conjunct Ca2+-binding domains for cytoplasmic Ca2+ (John et al., 2011) and its kinetics (Giladi et al., 2010) are different from those of CBD1 or CBD2. Although synergism between the CBDs has been demonstrated, two puzzles remain. How do the two CBDs interact mechanistically with each other upon Ca2+ binding/unbinding; and, how does this combined entity of CBD1 and CBD2 transmit its information to the remainder of NCX?
Since FRET studies have been useful in detecting movements of these subunits, it is perhaps worth providing a brief description of this technique. Fluorescence resonance energy transfer is the non-radiative transfer of energy from a fluorescent donor to another excitable moiety which can be attached to, for example, different regions of the same molecule (in this case NCX) or to two closely apposed molecules. In FRET, a donor fluorophore in an excited electronic state can transfer its excitation energy to an acceptor chromophore. Although the process does not involve photon emission, usually the donor and the acceptor molecules are fluorescent. Energy transfer quenches donor fluorescence and there is an increase in acceptor fluorescence emission. The efficiency of energy transfer varies in proportion to the inverse sixth power of the distance separating donor and acceptor molecules. Donor and acceptor molecules can be on the same molecules, e.g. NCX, or different molecules. There are two requirements for FRET to occur: first, the emission spectrum of the donor has to overlap the excitation spectrum of the acceptor and, second, the two moieties have to be in close proximity (10 nm). Since the efficiency of energy transfer is strongly dependent on this distance, FRET therefore is a powerful technique to measure the proximity of molecules or their changes in conformation. Labeling the protein, e.g. NCX, can be achieved either chemically, by attaching a fluorophore to the protein, such as maleimide fluorophores dyes, or by molecular biology techniques. Examples of the latter are the cyan (CFP) and yellow (YFP) variants of the green fluorescent protein (GFP), which are popular FRET pairs.
The methods for measuring FRET are several; however, the ratiometric and photobleaching approaches are the mostly widely used. The ratiometric method involves the recording of both acceptor and donor emissions either sequentially or simultaneously. This is because, when FRET occurs, excitation of the donor causes acceptor emission at the expense of donor emission. Hence, the acceptor/donor fluorescence intensity ratio is an estimate of the amount of energy transfer. FRET recording in this manner has the advantage that it can monitor changes in real time. To measure FRET efficiency, which can give estimates of actual distance between fluorescent moieties, the alternative method acceptor photobleaching approach is used. This method relies on the concept that when FRET occurs part of the energy of excited donor is transferred to the acceptor resulting in decreased donor emission. This energy transfer is eliminated by bleaching of YFP and leads to an increase in CFP emission. A cartoon describing the way that this technique can be use to detect the CBD movements is displayed in Fig. 14.12.
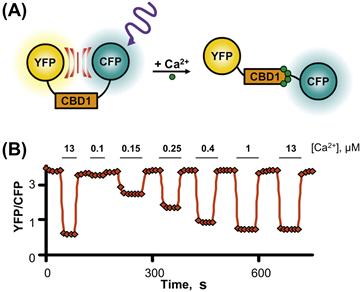
FIGURE 14.12 Example of FRET between CFP and YFP. The yellow and cyan variants of the green fluorescent protein were fused to the N and C termini of the first Ca2+-binding domain (CBD1) of the cardiac Na+-Ca2+ exchanger (A). In absence of cytoplasmic Ca2+, excitation of the CFP caused YFP emission since the two fluorophores are in close proximity. However, as shown in plot (B), addition of cytoplasmic Ca2+ moved the fluorophores apart causing a decrease in FRET (measured as YFP/CFP ratio). For this experiment, the fluorescent CBD1 was anchored to the plasma membrane by fusing to its C terminus a short plasma membrane targeting sequence. The construct was then expressed into Xenopus laevis oocytes to isolated portion of its plasma membrane onto coverslip. This technique allows accessibility to the cytoplasmic surface of the membrane which now are perfused with different Ca2+ concentrations, indicated above the trace. (Reprinted from John et al. with kind permission of the authors and PNAS).
IX The Phylogeny of the Na+-Ca2+ Exchanger
The number of proteins belonging to the exchanger family is increasing. These proteins are defined by the presence of the signature sequence α repeats (see previous sections) and a membrane topology of two clusters of transmembrane segments separated by a cytoplasmic loop of different length. Recent analysis indicates five families of exchangers, which constitute a “superfamily”. This is explained in some detail in the review by Lytton (Lytton, 2007). Among them is the NCX family. These are all mammalian exchangers and include NCX1, the first exchanger to be isolated, as well as NCX2 and NCX3. These exchangers are ubiquitous with NCX1 found in the heart, brain and kidney, NCX2 in the brain and NCX3 in the brain and skeletal muscle. NCX1 is particularly abundant in the heart and it has been the subject of intensive investigations. It is on NCX1 that most studies of currents that are generated by exchange have been performed.
Other exchangers in the NCX family are found, for example, in the nematode C. elegans and also in the fruit fly Drosophila. The NCX family is found in a wide variety of mammalian species including human, dog, rabbit, cow, rat and guinea pig as well as in various non-mammalian species.
The other four members of the Ca2+/cation antiporter gene superfamily are: bacterial exchangers, Ca2+/anion exchanger, Ca2+/cation exchanger and the NCKX family. Discussion of the first three families of exchangers is outside the scope of this chapter. Here we will briefly described the NCKX family.
NCKX are plasma membrane proteins that, at difference from NCX, require K+ for transport exchanging four Na+ for one Ca2+ and one K+ during each cycle. The first member of this family, NCKX1, was cloned from retinal tissue. Here, NCKX1 is associated to the cGMP-gated channel which opens in the dark allowing Ca2+ to enter the cell. As Ca2+ extrusion mechanism, NCKX counterbalance this Ca2+ influx maintaining resting levels of intracellular Ca2+. The physiological impact of the remaining NCKX is less understood but evidence suggests an important role of NCKX2, 3 and 4 in neuronal Ca2+ signaling. The fifth member of this family NCKX 5 is, instead, found in skin and retinal epithelia but its function has yet to be explained. Excellent reviews are available to the reader (Cuomo et al., 2007; Lytton, 2007).
X Isoforms of the Na+-Ca2+ Exchanger
The large intracellular loop of NCX1 can be spliced in different ways to produce a variety of splice variants. The region of alternative splicing is found in the second Ca2+-binding domains (CBD2) (see Section VIII). Six small exons are used in different combinations to produce CBD2 with different properties (Hilge et al., 2006, 2009; Besserer et al., 2007). The resulting exchanger isoforms are tissue-specific (Quednau et al., 1997; Hryshko, 2002) and have different properties such as the ability to overcome Na+-dependent inactivation (Dyck et al., 1999), altered stimulatory effects of Ca2+ (Hilge et al., 2009) and, in the case of the Drosophila NCX (CalX), negative regulation by cytoplasmic Ca2+ (Hryshko et al., 1996). Still, the physiological significance of tissue-specific isoforms is unclear. Presumably they evolved to perform functions required only by those tissues in which they are found.
XI Current–Voltage Relationships and Voltage Dependence of Na+-Ca2+ Exchange Current
The origin of the voltage dependence of Na+-Ca2+ exchange has yet to be explained. However, current–voltage relationships obtained under a variety of ionic conditions can provide a great deal of information that forms a basis for discussing possible mechanisms of voltage dependence. Here we will try to show what can and cannot be concluded about voltage-dependent mechanisms from available current–voltage data. Before interpreting current–voltage relationships, the experimentalist should be confident that he or she is dealing with a pure current. Thus, considerable care in eliminating contaminating currents with appropriate inhibitors and an understanding of which currents (besides exchange current) are activated over the voltage range of interest is essential.
Most Na+-Ca2+ exchange current–voltage relationships that have been measured so far do not show a region of negative slope. This is consistent with the idea that only a single rate-limiting charge translocation step exists in the reaction pathway. Were a second voltage-dependent step to exist in which charge moved in the opposite direction, then one might expect a region of slight negative slope. This is because the increasing voltages that stimulated forward exchange would necessarily begin to retard the movement of exchange in the opposite direction, with resulting decline in net transport and hence current. However, conditions under which a region of negative slope in an exchange current–voltage relationship have been detected. Using the giant patch technique, Hilgemann and coworkers have measured outward exchange current–voltage relationships as a function of extracellular Ca2+ (Fig. 14.13) (Hilgemann et al., 1991b). When extracellular Ca2+ is 0.1 mM, voltage dependence is diminished and, at extreme depolarization, the slope of the current–voltage relationship becomes discernibly negative. It is currently believed that most of the exchange voltage dependence is associated with Na+ translocation. Hilgemann has suggested that the negative slope could be explained if Ca2+ passes through a small fraction of the membrane field before binding to the carrier. This would constitute a second voltage-dependent step associated with Ca2+ translocation in the transport pathway.
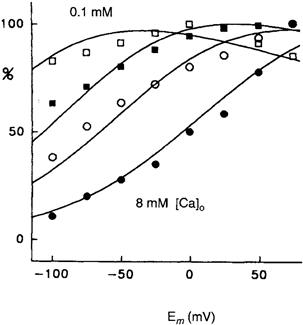
FIGURE 14.13 Ion and voltage dependencies of cardiac Na+-Ca2+ exchange current conform to consecutive exchange model with voltage dependencies at extracellular Na+ release and binding. Flattening and saturation of outward INa-Ca-voltage relations as extracellular [Ca2+] is lowered from 8 mM (closed circles) to 2 mM (open circles) to 0.4 mM (closed squares) to 0.1 mM (open squares). All results are normalized to the largest current occurring in the current–voltage relation. Note the negative slope with strong depolarization at 0.1 mM. (Reprinted with kind permission of the author and Nature.)
A second property expected of current–voltage relationships for electrogenic exchange reactions is that they should saturate at extreme voltages. This is because reaction steps whose rate increases with voltage should become sufficiently rapid that they cease to be rate limiting for the entire reaction sequence. The reaction may then be rate limited by a voltage-independent step, at which point reaction rate will cease to be responsive to voltage. Many current–voltage relationships do show clear evidence of saturation. For example, the measurements of outward current depicted in Fig. 14.13 clearly exhibit saturation. Though not so obvious, measurements of inward current by Bridge and colleagues and by Miura and Kimura also show signs of saturation at extremely negative voltages (Miura and Kimura, 1989; Bridge et al., 1991). In contrast, results (from giant patches) under zero trans conditions suggest little saturation of inward exchange current at very negative potentials (Matsuoka and Hilgemann, 1992). The origin of these discrepancies is not clear, but may be related to whether or not net or unidirectional exchange is producing the inward current. Moreover, current–voltage relationships obtained in whole cells may be complicated by other partial reactions (e.g. Ca2+ dissociation from intracellular buffers) not present in the giant patch experiments.
The way that exchange current–voltage relationships depend on ionic conditions can also yield information about voltage-dependent steps in the reaction sequence that leads to exchange. With voltage-clamped giant patches under zero trans conditions – i.e. Ca2+ in the pipette (extracellular) side and Na+ in the bath solution – that superfuse the cytoplasmic surface, outward current-voltage relationships showed a striking dependence on pipette (extracellular) Ca2+ (see Fig. 14.13). However, when the extracellular (pipette) Ca2+ is reduced to very low values, voltage dependence tends to disappear. An attractive explanation for this result is that as extracellular Ca2+ is reduced, a voltage-independent step or a step with very modest voltage dependence (presumably associated with Ca2+ translocation) starts to become rate limiting, with the result that exchange loses its voltage dependence. However, Ca2+ translocation is not independent of voltage in all species. In the squid Na+-Ca2+ exchanger NCX-SQ1, charge movement accompanies Ca2+ translocation rather than Na+ translocation, as has been shown rather elegantly by He and coworkers (He et al., 1998). These authors examined giant patches from oocytes expressing either NCX1 or NCX1-SQ1. Na+ and Ca2+ were respectively inside the pipette. This forced Na+- and Ca2+-binding sites to the intracellular surface. Rapid application of Na+ or Ca2+ to the intracellular (outside) surface of the patch produces a transient half-reaction which, in turn, was expected to produce a transient charge movement if the half-reaction is electrogenic. It appears that, in NCX1, transient current is produced by application of Na+ but, in the case of NCX1-SQ1, application of Ca2+ produces an electrogenic half-reaction. Thus, it seems that, in the squid, Ca2+ translocation is electrogenic (Fig. 14.14).

FIGURE 14.14 Identification of electrogenic reactions of NCX1 and NCX-SQ1 using concentration jumps. (A) Current transients recorded from NCX1-expressing patch when 40 mM cytoplasmic Na+ is applied and removed in the presence of 20 mM extracellular Na+. (B) Typical lack of current transients recorded from NCX-SQ1-expressing patch when 40 mM cytoplasmic Na+ is applied and removed in the presence of 20 mM extracellular Na+. (C) Inward NCX1 current activated when a solution with 5 μM free Ca2+ is applied as in (A). (D) Inward NCX-SQ1 current activated when a solution with 5 μM free Ca2+ is applied as in (B). (E) Typical lack of current transients for a Ca2+ jump to 5 μM free Ca2+ in NCX1- expressing patch; 50 μM extracellular Ca2+. (F) Current transients recorded from NCX-SQ1-expressing patch when a solution with 5 μM free Ca2+ is applied and removed in the presence of 50 μM extracellular Ca2+. (G) Outward current activated by applying 40 mM Na+ to an NCX1 patch with 50 μM extracellular Ca2+. (H) Outward current activated by applying 40 mM Na+ to an NCX1 patch with 50 μM extracellular Ca2+. (Reprinted from He et al. (1998) with kind permission from the Journal of General Physiology.)
The dependence of outward current–voltage relationships on Na+ is also interesting. Hilgemann and colleagues, using the giant patch technique, have measured outward current–voltage relationships when extracellular Na+ was 100 and 400 mM (Fig. 14.15). At 400 mM, there was a pronounced flattening of the current–voltage relationship (Hilgemann et al., 1991b). There are two possible (and not necessarily unrelated) explanations for this. If we assume that some step in the Na+ translocation pathway is both rate limiting and voltage dependent, it is possible that, as extracellular Na+ increases, this step ceases to be rate limiting because it is accelerated. Were some other voltage-independent step to become rate limiting, one would expect a flattening of the current–voltage relationship as it became dominated by the voltage-independent step, as is in fact observed. Alternatively, if Na+ binding to some external site were voltage dependent, one would expect voltage dependence of this binding to be lost as the site becomes saturated (Lagnado and McNaughton, 1990).
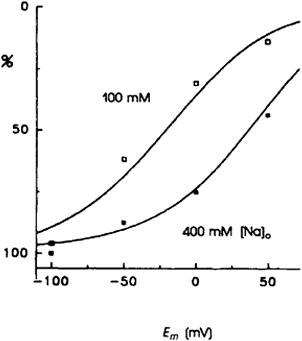
FIGURE 14.15 Flattening and saturation of inward INa-Ca-voltage relationships when extracellular [Na+] is increased from 100 mM to 400 mM. Na+-MES was replaced by Ca2+-MES in the pipette, as osmolarity for all extracellular solutions was equal. 20 μM free [Ca2+] on the cytoplasmic side. INa-Ca magnitudes in each current–voltage relationship were normalized to values at −100 mV. (Reprinted from Hilgemann et al. (1991) with kind permission from the Journal of General Physiology.)
These results seem to suggest that, somewhere in the Na+ translocation pathway, a voltage-dependent (charge translocation) step may be involved. In this regard, the data obtained with giant patches, where ideal zero trans conditions are most likely to be achieved, are particularly compelling.
XII Mechanism of Na+-Ca2+ Exchange
A discussion of the evidence for and against various kinetic schemes to account for Na+-Ca2+ exchange is beyond the scope of this chapter. The interested reader is referred to Khananshvili (Khananshvili, 1991). Here we will simply show the way in which measurement of exchange current can be used to infer mechanism. It should, however, be clearly understood that the measurement of isotopic fluxes and rapid mixing techniques provide indispensable tools to investigate mechanism but will not be discussed here.
For the Na+-Ca2+ exchange, two different basic mechanisms for ion translocation can be considered: the ping-pong or consecutive mechanism and the sequential or simultaneous mechanism. Although it has been difficult to distinguish between these mechanisms, recent data using the patch-clamp technique provide strong evidence in favor of the ping-pong mechanism, diagrammed in its simplest form in Fig. 14.16. There is only one set of binding sites that binds either Ca2+ or Na+ and the translocation of Na+ and Ca2+ are separate events. For example, Ca2+ binds to the carrier E′ at the inner (cytoplasmic) surface and is translocated to the exterior, where it is released. The carrier E′′ then can either bind Na+ or Ca2+ at the external face, which is then transported to the internal surface where it is in turn released. A basic property of the ping-pong mechanism is that Na+-Na+ and Ca2+-Ca2+ exchange are reversible partial reactions of the exchange. As such, it should be possible to isolate them (see Fig. 14.14). These partial reactions do not exist as elementary steps in the simultaneous mechanism.

FIGURE 14.16 Diagram of the ping-pong mechanism of ion translocation.
Partial reactions of the exchanger have been observed (Hilgemann, 1991a). Using giant sarcolemmal patches, rapid application of Na+ to the intracellular surface caused binding and translocation of intracellular Na+ to the pipette side. This produced a transient current which could be blocked by exchange blockers including the exchanger inhibitory peptide (XIP) (Li et al., 1991). Similar currents were measured in giant oocyte patches in which the cloned exchanger had been expressed. Control oocytes did not exhibit this current. It appears that charge translocation is associated with Na+ translocation and that the Na+ translocation step can be isolated, consistent with the idea that a ping-pong mechanism is operative.
Further support for a consecutive model of exchange comes from work by Niggli and Lederer. These authors measured very small transient Ca2+ currents induced by the photo release of caged Ca2+ DM-dinitrophen (Niggli and Lederer, 1991). Insofar as these currents could be inhibited by known blockers of the Na+-Ca2+ exchange, they appear to be associated with exchange. Since they are unaffected by Na+, they are presumably associated with a partial reaction of the exchange. These authors have speculated that this current represents a charge movement associated with Ca2+ binding and the associated conformational change of the exchange molecule. This suggests that (as we have already seen) a voltage-dependent step might be associated in some way with the partial reactions leading to Ca2+ translocation. It is becoming clear that we as yet do not know exactly how many charge-translocating steps are actually in the exchange pathway. However, evidence is accruing that the mechanism is consecutive in nature.
Two additional pieces of evidence suggest that a consecutive mechanism could account for Na+-Ca2+ exchange. First, Hilgemann and colleagues have demonstrated that the apparent affinity of one ion for the exchanger is a function of the concentration of the other (Hilgemann et al., 1991a). This is a requirement of a sequential reaction scheme. Moreover, Kimura has employed classic enzyme kinetics to outward exchange currents under assumed zero trans conditions. Her results suggest that while it is difficult to discriminate between a simultaneous and consecutive reaction, the available evidence favors a consecutive reaction (Li and Kimura, 1991).
XIII Na+-Ca2+ Exchange Currents During the Cardiac Action Potential
During every action potential, a Ca2+ current is activated and a modest quantity of Ca2+ enters the cell. As we shall discuss, it now seems likely that reverse exchange takes place, which also causes some Ca2+ entry. During a steady-state train of action potentials, this continual Ca2+ entry must in some way be compensated. It is therefore likely that forward exchange during the repolarizing phase of the action potential extrudes the Ca2+ entering during the initial phase of the action potential and thus maintains a beat-to-beat homeostasis. Direct evidence that Ca2+ entering the cell through Ca2+ channels can be extruded by the Na+-Ca2+ exchange has been obtained by Bridge et al. (Bridge et al., 1990). Guinea pig ventricular cells treated with caffeine can be tetanized in the absence of extracellular Na+ with a voltage-clamp pulse from −40 mV to +10 mV. During this clamp, an inward Ca2+ current can be measured (Fig. 14.17). Although the SR is depleted by caffeine, the enlarged Ca2+ current can apparently produce sufficient Ca2+ entry to cause contractures. It should be emphasized that in these experiments the pipette contained no Na+ so that in the absence of extracellular Na+, Ca2+ entry by reverse exchange was unlikely. At the peak of the contracture, rapid application of extracellular Na+ produced prompt mechanical relaxation and activated an inward transient current. This current was most likely due to forward Na+-Ca2+ exchange because it could not be activated when intracellular Ca2+ was buffered with EGTA. If the Na+-Ca2+ exchange current extruded all the entering Ca2+ and, if we further assume that three Na+ ions exchange with a single Ca2+ ion, it follows that the integral of the exchange current is one-half that of the Ca2+ current. The relationship between the integrals of exchange current and Na+-Ca2+ exchange current was best explained by assuming that three Na+ ions exchange with a single Ca2+ ion and that the exchange extruded all the entering Ca2+. It seems therefore that the Na+-Ca2+ exchange does have the capacity to extrude all Ca2+ entering during the duty cycle.
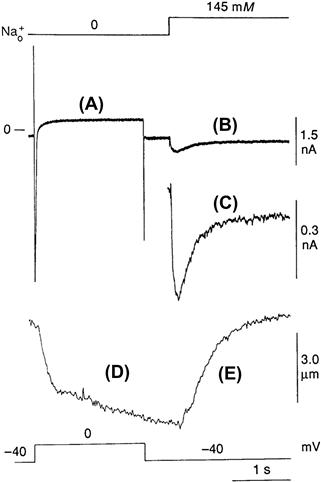
FIGURE 14.17 Two-second voltage-clamp pulses in the absence of Na+o and presence of 10.0 mM caffeine cause contraction. Rapid application of Na+o 500 ms after repolarization causes relaxation. (A) ICa elicited by membrane depolarization. (B) The application of Na+ produces putative transient inward INa-Ca. (C) This current is displayed on an expanded scale. (D) Contraction (cell shortening) activated by ICa recorded in (A). (E) After repolarization to −40 mV, relaxation does not occur until 500 ms after the clamp pulse when Na+ is suddenly applied. (Reprinted with permission from Bridge, J.H.B., Smolley, J.R. and Spitzer, K.W. (1990). The relationship between charge movements associated with/Ca and INa-Cain cardiac myocytes. Science. 248, 376-378. Copyright 1990 American Association for the Advancement of Science.)
It now seems likely that the activity of Na+-Ca2+ exchange is profoundly modified by the cardiac action potential. It is also likely that the exchange current in part determines the duration of the cardiac action potential. The first comprehensive discussion of this topic was made by Mullins (Mullins, 1979). We will consider the behavior of the Na+-Ca2+ exchange during the ventricular action potential. The guinea pig ventricular action potential is approximately 300 ms in duration. During the initial part of this action potential Ca2+ is released from the sarcoplasmic reticulum and this causes a rise of Ca2+ in the cytosol. Peak values for cytosolic free Ca2+ are probably 1–2 μM. The Ca2+ transient rises to a peak in approximately 50 ms, whereas the peak of the upstroke of the action potential occurs in approximately 2 ms. After the upstroke of the action potential, but before intracellular Ca2+ has risen appreciably, the membrane potential becomes positive to the exchange reversal potential, which is about −50 mV. Therefore, an outward exchange current is generated and this will be accompanied by Ca2+ entry and Na+ exit. This current has been implicated in the “triggering” of SR Ca2+ release (Leblanc and Hume, 1990). As the Ca2+ released from the SR begins to rise and the membrane begins to repolarize, the membrane potential will become negative to the reversal potential, the exchange current will reverse its direction and Ca2+ will be extruded in exchange for Na+. As the intracellular Ca2+ begins to decline, inward exchange current will also decline to resting values. The same principles presumably govern the behavior of the atrial cell. Earm and Noble have modeled the time course of Ca2+ current, Na+-Ca2+ exchange current, and the Ca2+ transient during the rabbit atrial action potential (Fig. 14.18) (Earm and Noble, 1990). Other more recent models seek to explain the way exchange current behaves during action potencials (Luo and Rudy, 1994; Iyer et al., 2004). The Na+-Ca2+ exchange current is the main depolarizing current during the plateau. Moreover, the exchange activity required to maintain the late plateau is precisely sufficient to balance Ca2+ influx (Ca2+ current + Na+-Ca2+ exchange) during the early part of the action potential. It should be appreciated that, regardless of the value of intracellular Ca2+, membrane repolarization will tend to stimulate inward exchange current. On the other hand, the decline of the Ca2+ transient will tend to reduce exchange current. Therefore, the relationship between the Ca2+ transient and membrane repolarization will largely determine the time course of inward exchange current and therefore the pattern of Ca2+ extrusion.
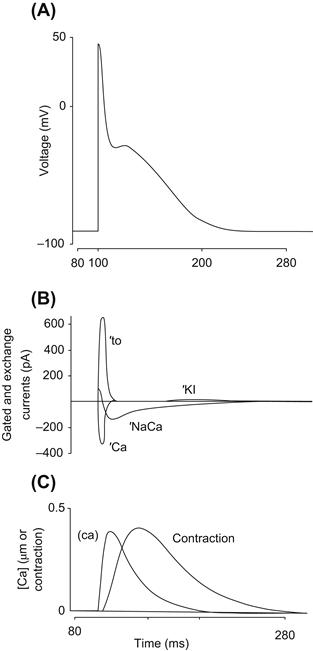
FIGURE 14.18 The Earm–Noble model of the single rabbit atrial cell, based on the multicellular model of Hilgemann and Noble (1987). (A) Computed action potential. (B) Computed currents. (C) [Ca2+]i and contraction (Earm and Noble, 1990). (Reprinted with kind permission of the author and the Royal Society.)
XIV Na+-Ca2+ Exchange Currents and Excitation–Contraction Coupling
Contractions occur in heart cells when Ca2+ released from intracellular stores known as the sarcoplasmic reticulum (SR) activates the contractile elements (for a more detailed account of excitation–contraction the reader is referred to Bers (2001)). This release is coupled to electrical excitation at the surface membrane and the whole process is often referred to as excitation–contraction coupling. The pioneering studies on skinned fibers by Alexander Fabiato led to at least two fundamental findings (for a discussion of these see Stern and Lakatta, 1992). The first was that Ca2+ can be released from the SR when the concentration of Ca2+ in the vicinity of the SR is abruptly increased. This small increase in the concentration of Ca2+ leads to a much larger release of SR Ca2+, so the system is one of inherently high gain. This process is usually referred to as Ca2+-induced Ca2+ release or CICR. A second and important property of CICR is that, under voltage clamp, the release is graded with the size of the Ca2+ increase that induces the release. A priori such a system might be expected to be regenerative since the Ca2+ that is released from the SR ought to stimulate further release. A discussion of why SR Ca2+ release in heart is not normally regenerative is beyond the scope of this chapter. Nevertheless, will discuss some of the evidence that suggests that Na+-Ca2+ exchange currents are involved in CICR.
It is now known that large tetrameric Ca2+-release channels (usually referred to as ryanodine receptors) are embedded in the sarcoplasmic reticulum (Saito et al., 1988). These apparently respond to elevations of Ca2+ in their vicinity by gating the release of Ca2+ from the SR (Stern and Lakatta, 1992). Therefore, a molecular basis for the early observations by Fabiato has been established. A central question for those studying excitation–contraction in heart is, what in intact cells produces the rise in intracellular Ca2+ that gates the SR release channel and triggers SR Ca2+ release?
It is now well established that the L-type Ca2+ current is principally involved in triggering SR Ca2+ release in mammalian ventricular cells (London and Krueger, 1986; Beuckelmann and Wier, 1988; Cheng et al., 1993; Lopez-Lopez et al., 1994). Because Fabiato showed SR Ca2+ release is graded with the size of the increase in Ca2+ concentration that induces the release, it follows that if L-type Ca2+ channels trigger or induce the release of Ca2+, the extent of SR Ca2+ release also should be graded with the size of the L-type Ca2+ current. Since the size of the Ca2+ current has a bell-shaped dependence on voltage, the finding that the rate or extent of SR Ca2+ release (or the magnitude of triggered contractions) is (under appropriate conditions) also bell-shaped lends strong support to the idea that the Ca2+ current is a trigger for SR Ca2+ release. For example, a detailed study by Beuckelmann and Wier has clearly established the bell-shaped relationship between triggered Ca2+ transients and voltage (Beuckelmann and Wier, 1988).
However, a number of studies in ventricular cells have revealed that, under certain circumstances, a more complex relationship between the voltage dependence of triggered contractions and Ca2+ current (Nuss and Houser, 1992; Vornanen et al., 1994; Litwin et al., 1998). In particular, tension measurements did not follow a simple bell-shaped relationship with voltage but rather showed a sigmoid relationship. At positive potentials, shortening did not decline steeply with voltage. The studies by Litwin et al. on guinea pig cells under voltage-clamp and dialyzed with various Na+ solutions indicate that while the shape of the Ca2+ current/voltage relationship was independent of pipette Na+, the triggered shortening-voltage relationship showed a striking dependence on pipette Na+ (Fig. 14.19) (Litwin et al., 1998). At positive potentials the shortening-voltage relationship departed from a simple bell shape and the extent of this departure depended on the concentration of dialyzing Na+.
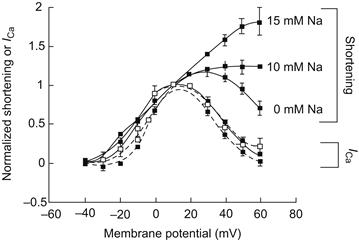
FIGURE 14.19 The relationship between voltage and ICa is bell-shaped regardless of dialyzing Na+ concentration. However, the relationship between triggered shortening and voltage depends upon the concentration of dialyzing Na+. When dialyzing Na+ is nominally zero mM, the relationship between voltage and the extent of shortening approaches a bell shape. (Reprinted with permission of the Proceeding of the New York Academy of Sciences.)
If L-type Ca2+ current is blocked extremely rapidly, triggered contractions are reduced but not abolished (Levi et al., 1996). Thus, if Ca2+ currents are elicited under voltage-clamp, it is possible to record what could be a triggered contraction or a triggered Ca2+ transient. It therefore seems likely that another process besides the Ca2+ current is involved, triggering the release of SR Ca2+. The most likely process is in fact the Na+-Ca2+ exchange. Grantham and Cannell used voltage-clamp pulses shaped like an action potential to infer the magnitude and trajectory of Na+-Ca2+ exchange currents during the initial part of an action potential. They found that the magnitude of the exchange current was somewhat less than 30% of the magnitude of the Ca2+ current that occurred during the initial part of the action potential (Fig. 14.20) (Grantham and Cannell, 1996). As the authors point out, this is not a negligible current and is consistent with the idea that at least some of the triggered SR Ca2+ release could be due to the activity of the Na+-Ca2+ exchange. It is worth mentioning that if the Na+-Ca2+ exchange is capable of contributing part of the trigger for SR Ca2+ release, then this component of the trigger will be extremely sensitive to intracellular Na+. In this regard, it has been proposed that the initial Na+ current might provide enough Na+ accumulation (provided the accumulation takes place in a restricted space) in the vicinity of the Na+-Ca2+ exchangers to enhance triggering by reverse Na+-Ca2+ exchange current (Leblanc and Hume, 1990; Lipp and Niggli, 1994). A difficulty with the idea that exchange can under physiological circumstances trigger significant Ca2+ release is that it is extremely small (Sipido et al., 1997).
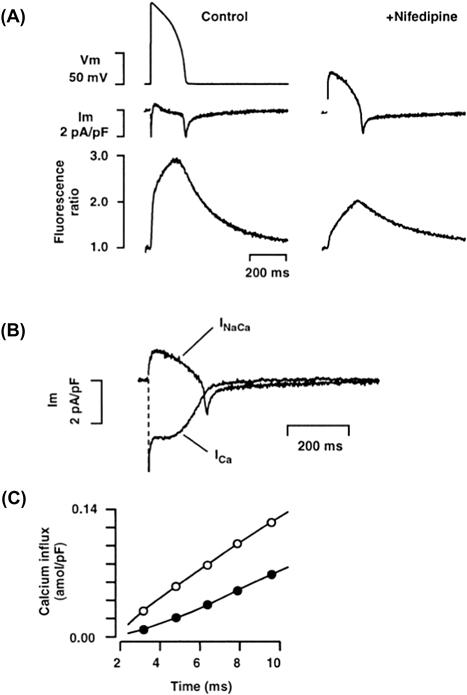
FIGURE 14.20 Membrane currents and Ca2+ influx in a myocyte with intact Na+-Ca2+ exchange and SR release in response to an action potential (AP). The myocyte was at steady state, having been stimulated continuously at 0.2 Hz with a train of at least 20 APs. (A) Top, AP command; middle, membrane current; and bottom, [Ca2+] transient time course in the absence of nifedipine or, on the right, immediately after blockade of ICa by 10 μmol/L nifedipine. (B) Time course of AP-evoked nifedipine-sensitive current (ICa) and calculated INa-Ca. (C) Cumulative Ca2+ influx via ICa (open circles) and the calculated INa-Ca (closed circles) at the beginning of the AP. Cell capacitance, 150 pF. Similar results were obtained in at least four other cells. (Reprinted with permission of Circulation Research from Grantham and Cannell, 1996.)
Litwin et al. have suggested, for example, that the exchange may sum its effects with the Ca2+ current in a highly non-linear way to augment triggering by Ca2+ current (Litwin et al., 1998). It is possible that one function of the exchange is to increase the probability with which a Ca2+ current triggers exchange in a highly non-linear system. It is therefore not yet clear what contribution Na+-Ca2+ exchange currents make to triggering SR Ca2+ release under physiological circumstances. However, since the exchanger is regulated by intracellular Na+, Ca2+ and voltage, it seems likely that its contribution to triggering (either direct or indirect) will be both complex and variable. Recently, the idea that NCX is involved in CICR has been significantly strengthened (Sobie et al., 2008). In both mouse and rabbit cells (Larbig et al., 2010; Torres et al., 2010), inactivation of Na+ currents while applying action potential shaped voltage clamps abolished a significant fraction of the SR Ca release. Between 27 and 34% of the release was eliminated in rabbits and as much as 50% in mice. When this experiment was repeated in mice lacking NCX (mouse NCX knockout), inactivation of the Na+ current had no effect on SR Ca2+ release, which provides additional strong support for the idea that the effect of Na+ current on triggering is mediated by NCX.
A report by Maier et al. indicated that a brain or neuronal type Na+ channel is involved in excitation contraction coupling in heart (Maier et al., 2002). Both neuronal (brain) and skeletal muscle Na+ channels are thought to exist in heart (Sills et al., 1989; Dhar Malhotra et al., 2001; Huang et al., 2001; Maier et al., 2002; Pereon et al., 2003; Haufe et al., 2005a, b; Marionneau et al., 2005; Gershome et al., 2011). These channels are sensitive to TTX, i.e. they are blocked by relative low doses of TTX (100 nM TTX), whereas the cardiac Na+ channel Nav 1.5 is blocked by much higher concentrations of this drug (in the order of micromolar). Torres et al. obtained clear evidence that very low doses of TTX (100 nM) eliminated as much as 27% of the release flux (Torres et al., 2010). This is similar to the effect of voltage dependent inactivation of the Na+ current. It is therefore possible that a rapidly activating TTX-sensitive Na+ current could significantly increase Na+ concentration in junctional regions between the sarcolemma and the sarcoplasmic reticular membranes. This, in turn, could cause the reverse of exchange prior to activation of Ca2+ currents and prime the junction with Ca2+, although the process might not in itself produce much triggering. However, with a primed junction, Ca2+ currents might trigger SR Ca2+ release much more efficiently since they would not first have to fill the junctional regions with Ca2+. In the absence of intracellular Na+, the efficiency of release is extremely low at positive potential (when one would expect it to be high). A process of the type that we have just described might increase triggering efficiently when it is most needed and, in effect, set the efficiency of EC coupling. Such a process is likely to be inherently non-linear and account for the non-linear summation of NCX and Ca currents proposed by Litwin et al. (Litwin et al., 1998).
BIBLIOGRAPHY
1. Acsai K, Antoons G, Livshitz L, Rudy Y, Sipido KR. Microdomain [Ca2+] near ryanodine receptors as reported by L-type Ca2+ and Na+/Ca2+ exchange currents. J Physiol. 2011;589:2569–2583.
2. Axelsen PH, Bridge JHB. Electrochemical ion gradients and the Na/Ca exchange stoichiometry Measurements of these gradients are thermodynamically consistent with a stoichiometric coefficient >3. J Gen Physiol. 1985;85:471–478.
3. Baker PF, Blaustein MP, Hodgkin AL, Steinhardt RA. Effect of sodium concentration on calcium movements in giant axons of loligo forbesi. J Physiol (Lond). 1967;192:43–44.
4. Barcenas-Ruiz L, Beuckelmann DJ, Wier WG. Sodium-calcium exchange in heart: membrane currents and changes in (Ca2+)i. Science. 1987;238:1720–1722.
5. Bers DM. Excitation-contraction Coupling and Cardiac Contractile Force. Dordrecht: Kluwer Academic Publishers; 2001.
6. Besserer GM, Ottolia M, Nicoll DA, et al. The second Ca2+-binding domain of the Na+ Ca2+ exchanger is essential for regulation: crystal structures and mutational analysis. Proc Natl Acad Sci USA. 2007;104:18467–18472.
7. Beuckelmann DJ, Wier WG. Mechanism of release of calcium from sarcoplasmic reticulum of guinea- pig cardiac cells. J Physiol (Lond). 1988;405:233–255.
8. Blaustein MP, Hodgkin AL. The effect of cyanide on the efflux of calcium from squid axons. J Physiol. 1969;200:497–527.
9. Bridge JHB, Bassingthwaighte JB. Uphill sodium transport driven by an inward calcium gradient in heart muscle. Science. 1983;219:178–180.
10. Bridge JHB, Smolley J, Spitzer KW, Chin TK. Voltage dependence of sodium-calcium exchange and the control of Ca extrusion in the heart. Ann NY Acad Sci. 1991;639:34–47.
11. Bridge JHB, Smolley JR, Spitzer KW. The relationship between charge movements associated with ICa and INa-Ca in cardiac myocytes. Science. 1990;248:376–378.
12. Chaptal V, Ottolia M, Mercado-Besserer G, Nicoll DA, Philipson KD, Abramson J. Structure and functional analysis of a Ca2+ sensor mutant of the Na+/Ca2+ exchanger. J Biol Chem. 2009;284:14688–14692.
13. Cheng H, Lederer WJ, Cannell MB. Calcium sparks: elementary events underlying excitation-contraction coupling in heart muscle. Science. 1993;262:740–744.
14. Chin TK, Spitzer KW, Philipson KD, Bridge JHB. The effect of exchanger inhibitory peptide (XIP) on sodium-calcium exchange current in guinea pig ventricular cells. Circ Res. 1993;72:497–503.
15. Collins A, Somlyo AV, Hilgemann DW. The giant cardiac membrane patch method: stimulation of outward Na+-Ca2+ exchange current by MgATP. J Physiol. 1992;454:27–57.
16. Crespo LM, Grantham CJ, Cannell MB. Kenetics, stoichiometry and role of the Na-Ca exchange mechanism in isoleted cardiac myocytes. Nature. 1990;345:618–621.
17. Cuomo O, Pignataro G, Gala R, et al. Involvement of the potassium-dependent sodium/calcium exchanger gene product NCKX2 in the brain insult induced by permanent focal cerebral ischemia. Ann NY Acad Sci. 2007;1099:486–489.
18. Dhar Malhotra J, Chen C, Rivolta I, et al. Characterization of sodium channel alpha- and beta-subunits in rat and mouse cardiac myocytes. Circulation. 2001;103:1303–1310.
19. DiPolo R, Beauge L. Characterization of the reverse Na/Ca exchange in squid axons and its modulation by Cai and ATP Cai-dependent Nai/Cao and Nai/Nao exchange modes. J Gen Physiol. 1987a;90:505–525.
20. DiPolo R, Beauge L. In squid axons ATP modulates Na+-Ca2+ exchange by a Ca2+i dependent phosphorylation. Biochim Biophys Acta. 1987b;897:347–354.
21. Dyck C, Omelchenko A, Elias CL, et al. Ionic regulatory properties of brain and kidney splice variants of the NCX1 Na(+)-Ca(2+) exchanger. J Gen Physiol. 1999;114:701–711.
22. Earm YE, Noble D. A model of the single atrial cell: relation between calcium current and calcium release. Proc R Soc Lond B. 1990;240:83–96.
23. Ehara T, Matsuoka S, Noma A. Measurement of reversal potential of Na+-Ca2+ exchange current in single guinea-pig ventricular cells. J Physiol. 1989;410:227–249.
24. Gershome C, Lin E, Kashihara H, Hove-Madsen L, Tibbits GF. Colocalization of voltage-gated Na+ channels with the Na+/Ca2+ exchanger in rabbit cardiomyocytes during development. Am J Physiol Heart Circ Physiol. 2011;300:H300–311.
25. Giladi M, Boyman L, Mikhasenko H, Hiller R, Khananshvili D. Essential role of the CBD1-CBD2 linker in slow dissociation of Ca2+ from the regulatory two-domain tandem of NCX1. J Biol Chem. 2010;285:28117–28125.
26. Grantham CJ, Cannell MB. Ca2+ influx during the cardiac action potential in guinea pig ventricular myocytes. Circ Res. 1996;79:194–200.
27. Hamill OP, Marty E, Neher E, Sakmann B, Sigworth F. Improved patch-clamp techniques for high resolution current recording from cells and cell-free membrane patches. Pflügers Arch. 1981;391:85–100.
28. Haufe V, Camacho JA, Dumaine R, et al. Expression pattern of neuronal and skeletal muscle voltage-gated Na+ channels in the developing mouse heart. J Physiol. 2005a;564:683–696.
29. Haufe V, Cordeiro JM, Zimmer T, et al. Contribution of neuronal sodium channels to the cardiac fast sodium current INa is greater in dog heart Purkinje fibers than in ventricles. Cardiovasc Res. 2005b;65:117–127.
30. He Z, Feng S, Tong Q, Hilgemann DW, Philipson KD. Interaction of PIP(2) with the XIP region of the cardiac Na/Ca exchanger. Am J Physiol Cell Physiol. 2000;278:C661–666.
31. He Z, Tong Q, Quednau BD, Philipson KD, Hilgemann DW. Cloning, expression, and characterization of the squid Na+-Ca2+ exchanger (NCX-SQ1). J Gen Physiol. 1998;111:857–873.
32. Hilge M, Aelen J, Foarce A, Perrakis A, Vuister GW. Ca2+ regulation in the Na+/Ca2+ exchanger features a dual electrostatic switch mechanism. Proc Natl Acad Sci USA. 2009;106:14333–14338.
33. Hilge M, Aelen J, Vuister GW. Ca2+ regulation in the Na+/Ca2+ exchanger involves two markedly different Ca2+ sensors. Mol Cell. 2006;22:15–25.
34. Hilgemann DW. Giant excised cardiac sarcolemmal membrane patches: Sodium and sodium-calcium exchange currents. Pflügers Arch. 1989;415:1–3.
35. Hilgemann DW. Regulation and deregulation of cardiac Na+-Ca2+ exchange in giant excised sarcolemmal membrane patches. Nature. 1990;344:242–245.
36. Hilgemann DW, Ball R. Regulation of cardiac Na+-Ca2+ exchange and KATP potassium channels by PIP2. Science. 1996;273:956–959.
37. Hilgemann DW, Collins A, Cash DP, Nagel GA. Cardiac Na+-Ca2+ exchange system in giant membrane patches. Ann NY Acad Sci. 1991a;639:126–139.
38. Hilgemann DW, Collins A, Matsuoka S. Steady-state and dynamic properties of cardiac sodium-calcium exchange Secondary modulation by cytoplasmic calcium and ATP. J Gen Physiol. 1992a;100:933–961.
39. Hilgemann DW, Matsuoka S, Nagel GA, Collins A. Steady-state and dynamic properties of cardiac sodium-calcium exchange Sodium-dependent inactivation. J Gen Physiol. 1992b;100:905–932.
40. Hilgemann DW, Nicoll DA, Philipson KD. Charge movement during Na+ translocation by native and cloned cardiac Na+/Ca2+ exchanger. Nature. 1991b;352:715–718.
41. Hille B, Armstrong CM, MacKinnon R. Ion channels: from idea to reality. Nat Med. 1999;5:1105–1109.
42. Horackova M, Vassort G. Sodium-Calcium exchange in regulation of cardiac contractility Evidence for an electrogenic, voltage-dependent mechanism. J Gen Physiol. 1979;73:403–424.
43. Hryshko LV. Tissue-specific modes of Na/Ca exchanger regulation. Ann NY Acad Sci. 2002;976:166–175.
44. Hryshko LV, Matsuoka S, Nicoll DA, et al. Anomalous regulation of the Drosophila Na(+)-Ca2+ exchanger by Ca2+. J Gen Physiol. 1996;108:67–74.
45. Huang B, El-Sherif T, Gidh-Jain M, Qin D, El-Sherif N. Alterations of sodium channel kinetics and gene expression in the postinfarction remodeled myocardium. J Cardiovasc Electrophysiol. 2001;12:218–225.
46. Hume JR, Uehara A. "Creep currents" in single frog atrial cells may be generated by electrogenic Na-Ca exchange. J Gen Physiol. 1986a;87:857–884.
47. Hume JR, Uehara A. Properties of "creep currents" in single frog atrial cells. J Gen Physiol. 1986b;87:833–855.
48. Iwamoto T, Nakamura TY, Pan Y, Uehara A, Imanaga I, Shigekawa M. Unique topology of the internal repeats in the cardiac Na+/Ca2+ exchanger. Febs Lett. 1999;446:264–268.
49. Iwamoto T, Uehara A, Imanaga I, Shigekawa M. The Na+/Ca2+ exchanger NCX1 has oppositely oriented reentrant loop domains that contain conserved aspartic acids whose mutation alters its apparent Ca2+ affinity. J Biol Chem. 2000;275:38571–38580.
50. Iyer V, Mazhari R, Winslow RL. A computational model of the human left-ventricular epicardial myocyte. Biophys J. 2004;87:1507–1525.
51. John SA, Ribalet B, Weiss JN, Philipson KD, Ottolia M. Ca2+-dependent structural rearrangements within Na+-Ca2+ exchanger dimers. Proc Natl Acad Sci, USA 2011.
52. Johnson E, Bruschweiler-Li L, Showalter SA, Vuister GW, Zhang F, Bruschweiler R. Structure and dynamics of Ca2+-binding domain 1 of the Na+/Ca2+ exchanger in the presence and in the absence of Ca2+. J Mol Biol. 2008;377:945–955.
53. Khananshvili D. Mechanism of partial reactions in the cardiac Na-Ca exchange system. Ann NY Acad Sci. 1991;639:85–95.
54. Kimura J, Miyamae S, Noma A. Identification of sodium-calcium exchange currents in single ventricular cells of guinea-pig. J Physiol. 1987;384:199–222.
55. Kimura J, Noma A, Irisawa H. Na-Ca exchange current in mammalian heart cells. Nature. 1986;319:596–599.
56. Lagnado L, McNaughton PA. Electrogenic properties of the Na: Ca exchange. J Memb Biol. 1990;113:177–191.
57. Langer GA. Kinetic studies of calcium distribution in ventricular muscle of the dog. Circ Res. 1964;15:393–405.
58. Larbig R, Torres N, Bridge JH, Goldhaber JI, Philipson KD. Activation of reverse Na+-Ca2+ exchange by the Na+ current augments the cardiac Ca2+ transient: evidence from NCX knockout mice. J Physiol. 2010;588:3267–3276.
59. Leblanc N, Hume JR. Sodium current-induced release of calcium from cardiac sarcoplasmic reticulum. Science. 1990;248:372–376.
60. Levi AJ, Li J, Spitzer KW, Bridge JHB. Effect on the Indo-1 transient of applying Ca2+ channel blocker for a single beat in voltage-clamped guinea-pig cardiac myocytes. J Physiol (Lond). 1996;494.3:653–673.
61. Li JM, Kimura J. Translocation mechanism of cardiac Na-Ca exchange. Ann NY Acad Sci. 1991;639:48–60.
62. Li Z, Nicoll DA, Collins A, et al. Identification of a peptide inhibitor of the cardiac sarcolemmal Na(+)-Ca2+ exchanger. J Biol Chem. 1991;266:1014–1020.
63. Lipp P, Niggli E. Modulation of Ca2+ release in cultured neonatal rat cardiac myocytes: insight from subcellular release patterns revealed by confocal microscopy. Circ Res. 1994;74:979–990.
64. Litwin SE, Li J, Bridge JH. Na-Ca exchange and the trigger for sarcoplasmic reticulum Ca release: studies in adult rabbit ventricular myocytes. Biophys J. 1998;75:359–371.
65. London B, Krueger JW. Contraction in voltage-clamped, internally perfused single heart cells. J Gen Physiol. 1986;88:475–505.
66. Lopez-Lopez JR, Shacklock PS, Balke CW, Wier WG. Local, stochastic release of Ca2+ in voltage-clamped rat heart cells: visualization with confocal microscopy. J Physiol (Lond). 1994;480:21–29.
67. Luo CH, Rudy Y. A dynamic model of the cardiac ventricular action potential I Simulations of ionic currents and concentration changes. Circ Res. 1994;74:1071–1096.
68. Lytton J. Na+/Ca2+ exchangers: three mammalian gene families control Ca2+ transport. Biochem J. 2007;406:365–382.
69. Maier SK, Westenbroek RE, Schenkman KA, Feigl EO, Scheuer T, Catterall WA. An unexpected role for brain-type sodium channels in coupling of cell surface depolarization to contraction in the heart. Proc Natl Acad Sci USA. 2002;99:4073–4078.
70. Marionneau C, Couette B, Liu J, et al. Specific pattern of ionic channel gene expression associated with pacemaker activity in the mouse heart. J Physiol. 2005;562:223–234.
71. Matsuoka S, Hilgemann DW. Steady-state and dynamic properties of cardiac sodium-calcium exchange Ion and voltage dependencies of the transport cycle. J Gen Physiol. 1992;100:963–1001.
72. Matsuoka S, Nicoll DA, He Z, Philipson KD. Regulation of cardiac Na(+)-Ca2+ exchanger by the endogenous XIP region. J Gen Physiol. 1997;109:273–286.
73. Matsuoka S, Nicoll DA, Hryshko LV, Levitsky DO, Weiss JN, Philipson KD. Regulation of the cardiac Na(+)-Ca2+ exchanger by Ca2+ Mutational analysis of the Ca(2+)-binding domain. J Gen Physiol. 1995;105:403–420.
74. Matsuoka S, Nicoll DA, Reilly RF, Hilgemann DW, Philipson KD. Initial localization of regulatory regions of the cardiac sarcolemmal Na(+)-Ca2+ exchanger. Proc Natl Acad Sci, USA. 1993;90:3870–3874.
75. Mechmann S, Pott L. Indentification of Na-Ca exchange current in single cardiac myocytes. Nature. 1986;319:597–599.
76. Miura Y, Kimura J. Sodium-calcium exchange current. J Gen Physiol. 1989;93:1129–1145.
77. Mullins LJ. The generation of electric currents in cardiac fibers by Na/Ca exchange. Am J Physiol. 1979;236:C103–C110.
78. Nicoll DA, Hryshko LV, Matsuoka S, Frank JS, Philipson KD. Mutation of amino acid residues in the putative transmembrane segments of the cardiac sarcolemmal Na+-Ca2+ exchanger. J Biol Chem. 1996;271:13385–13391.
79. Nicoll DA, Longoni S, Philipson KD. Molecular cloning and functional expression of the cardiac sarcolemmal Na(+)-Ca2+ exchanger. Science. 1990;250:562–565.
80. Nicoll DA, Ottolia M, Lu L, Lu Y, Philipson KD. A new topological model of the cardiac sarcolemmal Na+-Ca2+ exchanger. J Biol Chem. 1999;274:910–917.
81. Niggli E, Lederer WJ. Photorelease of Ca2+ produces Na-Ca exchange currents and Na-Ca exchange "gating" currents. Ann NY Acad Sci. 1991;639:61–70.
82. Nuss HB, Houser SR. Sodium-calcium exchange-mediated contractions in feline ventricular myocytes. Am J Physiol Heart Circ Physiol. 1992;263:H1161–H1169.
83. Ottolia M, Nicoll DA, John S, Philipson KD. Interactions between Ca(2+) binding domains of the Na(+)-Ca(2+) exchanger and secondary regulation. Channels (Austin) 2010;:4.
84. Ottolia M, Nicoll DA, Philipson KD. Mutational analysis of the alpha-1 repeat of the cardiac Na(+)-Ca2+ exchanger. J Biol Chem. 2005;280:1061–1069.
85. Ottolia M, Nicoll DA, Philipson KD. Roles of two Ca2+-binding domains in regulation of the cardiac Na+-Ca2+ exchanger. J Biol Chem 2009.
86. Ottolia M, Philipson KD, John S. Conformational changes of the Ca(2+) regulatory site of the Na(+)-Ca(2+) exchanger detected by FRET. Biophys J. 2004;87:899–906.
87. Pereon Y, Lande G, Demolombe S, et al. Paramyotonia congenita with an SCN4A mutation affecting cardiac repolarization. Neurology. 2003;60:340–342.
88. Philipson KD, Longoni S, Ward R. Purification of the cardiac Na+-Ca2+ exchange protein. Biochim Biophys Acta. 1988;945:298–306.
89. Philipson KD, Nicoll DA, Ottolia M, et al. The Na+/Ca2+ exchange molecule: an overview. Ann NY Acad Sci. 2002;976:1–10.
90. Porzig H, Li Z, Nicoll DA, Philipson KD. Mapping of the cardiac sodium-calcium exchanger with monoclonal antibodies. Am J Physiol. 1993;265:C748–756.
91. Qiu Z, Nicoll DA, Philipson KD. Helix packing of functionally important regions of the cardiac Na(+)-Ca(2+) exchanger. J Biol Chem. 2001;276:194–199.
92. Quednau BD, Nicoll DA, Philipson KD. Tissue specificity and alternative splicing of the Na+/Ca2+ exchanger isoforms NCX1, NCX2, and NCX3 in rat. Am J Physiol. 1997;272:C1250–1261.
93. Rasgado-Flores H, Blaustei MP. Na/Ca exchange in barnacle muscle cells has a stoichiometry of 3 Na+/1 Ca+. Am J Physiol Cell Physiol. 1987;252:C499–C504.
94. Reeves JP, Condrescu M. Ionic regulation of the cardiac sodium-calcium exchanger. Channels (Austin). 2008;2:322–328.
95. Reeves JP, Hale CC. The stoichiometry of the cardiac sodium-calcium exchange system. J Biol Chem. 1984;259:7733–7739.
96. Reeves JP, Sutko JL. Competitive interactions of sodium and calcium with the sodium-calcium exchange system of cardiac sarcolemmal vesicles. J Biol Chem. 1983;258:3178–3182.
97. Ren X, Nicoll DA, Galang G, Philipson KD. Intermolecular cross-linking of Na+-Ca2+ exchanger proteins: evidence for dimer formation. Biochemistry. 2008;47:6081–6087.
98. Ren X, Nicoll DA, Philipson KD. Helix packing of the cardiac Na+-Ca2+ exchanger: proximity of transmembrane segments 1, 2, and 6. J Biol Chem. 2006;281:22808–22814.
99. Ren X, Nicoll DA, Xu L, Qu Z, Philipson KD. Transmembrane segment packing of the Na(+)/Ca(2+) exchanger investigated with chemical cross-linkers. Biochemistry 2010.
100. Repke K. Ubersichten uber den biochemischen wirkungsmodus von digitalis [On the Biochemical Mode of Action of Digitalis]. Klin Wochenschr. 1964;42:157–165.
101. Reuter H, Seitz N. The dependence of calcium efflux from cardiac muscle on temperature and external ion composition. J Physiol. 1968;195:451–470.
102. Riedel MJ, Baczko I, Searle GJ, et al. Metabolic regulation of sodium-calcium exchange by intracellular acyl CoAs. EMBO J. 2006;25:4605–4614.
103. Saito A, Inui M, Radermacher M, Frank J, Fleischer S. Ultrastructure of the calcium release channel of sarcoplasmic reticulum. J Cell Biol. 1988;107:211–219.
104. Schwarz EM, Benzer S. Calx, a Na-Ca exchanger gene of Drosophila melanogaster. Proc Natl Acad Sci, USA. 1997;94:10249–10254.
105. Sheu SS, Fozzard HA. Transmembrane Na+ and Ca2+ electrochemical gradients in cardiac muscle and their relationship to force development. J Gen Physiol. 1982;80:325–351.
106. Shigekawa M, Iwamoto T, Uehara A, Kita S. Probing ion binding sites in the Na+/Ca2+ exchanger. Ann NY Acad Sci. 2002;976:19–30.
107. Sills MN, Xu YC, Baracchini E, et al. Expression of diverse Na+ channel messenger RNAs in rat myocardium Evidence for a cardiac-specific Na+ channel. J Clin Invest. 1989;84:331–336.
108. Sipido KR, Maes M, Van de Werf F. Low efficiency of Ca2+ entry through the Na(+)-Ca2+ exchanger as trigger for Ca2+ release from the sarcoplasmic reticulum A comparison between L-type Ca2+ current and reverse-mode Na(+)-Ca2+ exchange. Circ Res. 1997;81:1034–1044.
109. Sobie EA, Cannell MB, Bridge JH. Allosteric activation of Na+-Ca2+ exchange by L-type Ca2+ current augments the trigger flux for SR Ca2+ release in ventricular myocytes. Biophys J. 2008;94:L54–56.
110. Spitzer KW, Bridge JHB. A simple device for rapidly exchanging solution surrounding a single cardiac cell. Am J Physiol Cell Physiol. 1989;256:C441–C447.
111. Stern MD, Lakatta EG. Excitation-contraction coupling in the heart: the state of the question. FASEB J. 1992;6:3092–3100.
112. Torres NS, Larbig R, Rock A, Goldhaber JI, Bridge JH. Na+ currents are required for efficient excitation-contraction coupling in rabbit ventricular myocytes: a possible contribution of neuronal Na+ channels. J Physiol. 2010;588:4249–4260.
113. Trosper TL, Philipson KD. Stimulatory effect of calcium chelators on Na-Ca exchange in cardiac sarcolemmal vessicles. Cell Calcium. 1984;5:211–222.
114. Vornanen M, Shepherd N, Isenberg G. Tension-voltage relations of single myocytes reflect Ca release triggered by Na/Ca exchange at 35 degrees C but not 23 degrees C. Am J Physiol. 1994;267:C623–632.
115. Wu M, Le HD, Wang M, et al. Crystal structures of progressive Ca2+ binding states of the Ca2+ sensor Ca2+ binding domain 1 (CBD1) from the CALX Na+/Ca2+ exchanger reveal incremental conformational transitions. J Biol Chem. 2009a;285:2554–2561.
116. Wu M, Wang M, Nix J, Hryshko LV, Zheng L. Crystal structure of CBD2 from the Drosophila Na(+)/Ca(2+) exchanger: diversity of Ca(2+) regulation and its alternative splicing modification. J Mol Biol. 2009b;387:104–112.
117. Xie Y, Ottolia M, John SA, Chen JN, Philipson KD. Conformational changes of a Ca2+-binding domain of the Na+/Ca2+ exchanger monitored by FRET in transgenic zebrafish heart. Am J Physiol Cell Physiol. 2008;295:C388–393.
118. Zhang YH, Hancox JC. Regulation of cardiac Na+-Ca2+ exchanger activity by protein kinase phosphorylation – -still a paradox?. Cell Calcium. 2009;45:1–10.