Chapter 51
Photosynthesis
Chapter Outline
IV. Biochemistry of Carbon Assimilation
VA. Light-Driven Electron Transport and ATP Synthesis
VB. The Chemiosmotic Hypothesis
VI. Photosynthetic Electron Transport
VIA. The Interaction of Light with Molecules
VIB. The Presence of Two Photochemical Reactions in Chloroplasts
VIC. Primary Electron Donors and Light-Harvesting Pigments
VID. The Structure and Function of the Chloroplast Electron Transport System
I Summary
Plants, algae and photosynthetic bacteria capture the energy of sunlight and store it in molecules such as starch and sucrose. Light is absorbed by light-harvesting pigments such as chlorophyll. The energy is transferred to a special pair of chlorophyll molecules in the photosynthetic reaction center. The energy is converted to chemical energy as the special chlorophyll pair transfers an electron to an acceptor. The electron proceeds along an electron transport chain, ultimately reducing NADP+ to NADPH or cycling back to the reaction center. The electron flow creates a proton concentration gradient across the membrane, which drives the formation of ATP. Plants contain chloroplasts. Chloroplasts have two photosystems, connected in series to form an electron transport system known as the Z scheme. In the System 2 reaction center, electrons are extracted from water, releasing O2. The System 1 reaction center donates electrons to NADP+. The ATP and NADPH are used for the synthesis of carbohydrates in a series of reactions known as the reductive pentose phosphate cycle.
II Introduction
IIA Historical Aspects
It must have been apparent from the earliest times that animals can survive only by eating plants or other animals, whereas plants seem to subsist on nothing but sunshine and a little water and earth. Julius Mayer, who introduced the concept of conservation of energy, suggested in 1845 that green plants can capture the energy of light and store it in a chemical form. His insight was correct. Almost all of the free energy used by living organisms is derived from energy of sunlight, which has been stored in photosynthetically produced molecules.
Clues about how plants might store free energy were obtained early (Loomis, 1960). In 1771, the English philosopher Joseph Priestly began a series of experiments that demonstrated that plants produce a gaseous substance, oxygen, which animals require for respiration. By the end of the 19th century, it was recognized that oxygen is produced only by the green parts of the plant and that its production requires light, carbon dioxide and water. The first visible products of photosynthesis were grains of starch, a polymer of glucose.
We now know that photons are captured by chlorophyll, the green pigment found in leaves, as well as by accessory pigments such as carotenoids (Fig. 51.1). Plants use the energy of the photons to extract electrons from water (leaving oxygen as a by-product) and use them to convert inorganic molecules such as carbon dioxide to organic molecules such as glucose:
 (51.1)
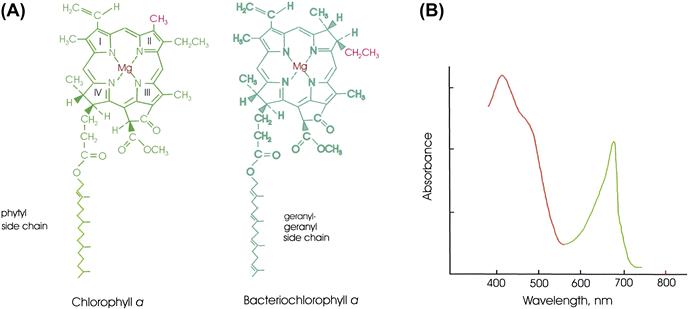
FIGURE 51.1 (A) The structures of chlorophyll a (Chl a) and bacteriochlorophyll a (BChl a). Differences between the structures of the various forms of chlorophyll contribute to differences between the absorption spectra of chlorophyll-containing proteins, allowing them to capture light in different regions of the spectrum. The conjugated system in BChl has one fewer double bond (in ring II) than that of Chl a. Single resonance forms of the conjugated systems of double bonds are shown. In Chl b,-HC=O replaces the red methyl substituent on ring II of Chl a. In BChl b, =CH-CH3 replaces the red substituents on ring II of BChl a. In some bacteria, phytyl rather than geranylgeranyl serves as the side chain of bacteriochlorophyll a or bacteriochlorophyll b. Other forms of chlorophyll are found in some organisms. Pheophytins resemble the respective chlorophylls, but the Mg2+ is replaced by two protons. (B) Absorption spectrum of a typical plant chloroplast. Both Chl a and Chl b absorb light between 400 nm and 500 nm and between 600 nm and 700 nm. In addition, β-carotene absorbs light between 400 nm and 500 nm.
The products of the above process contain more free energy per mole of glucose formed than do the reactants, that is:
 (51.2)
Nitrogen and sulfur also can be fixed, i.e. converted from inorganic to organic form, by the photosynthetic system. Nitrogen and sulfur that are contributed by inorganic starting materials (including dinitrogen (N2), nitrate and sulfate) are incorporated into amino acids and other organic molecules. In this chapter, we discuss in detail only carbon fixation.
A comprehensive discussion of the history of photosynthesis research has been presented by Bacon Ke (2001). A timeline of photosynthesis research by Thomas Brennan (2008) is available on Photobiological Sciences Online. This site, sponsored by the American Society for Photobiology, includes a number of excellent review modules covering various aspects of photosynthesis.
IIB Bacterial Reaction Centers
Higher plants are not the only organisms that perform photosynthesis. Algae also do, as do many bacteria. In all of them, the energy of light is converted to chemical energy in photosynthetic reaction centers. These are membrane-bound oligomeric protein complexes which contain a chlorophyll or bacteriochlorophyll dimer known as a special pair. The special pair donates an electron to an acceptor molecule following absorption of a photon. The reaction centers of plants, algae and photosynthetic bacteria resemble each other surprisingly closely. It has been suggested that they have evolved from a common ancestor. We will begin by describing bacterial reaction centers. Photosynthetic bacteria are described in more detail by Jones (2009) and Hunter et al. (2008) and reaction centers are discussed by Yocum (2008a).
It has been possible to isolate many of the oligomeric protein complexes involved in photosynthesis by dissolving the membranes in detergent and purifying the complexes through chromatography and other techniques. The reaction centers of purple photosynthetic bacteria are embedded in the cell membrane or in the membranes of intracytoplasmic vesicles which are often called chromatophores. Hartmut Michel, Johann Deisenhofer and Robert Huber isolated reaction centers from the green-colored (!) purple bacterium Blastochloris viridis (formerly Rhodopseudomonas viridis), devised a way to crystallize them and determined their structure by x-ray diffraction (Diesenhofer and Michel, 1989). This was the first crystallization of a membrane protein and paved the way for determination of the structures of many prokaryotic and eukaryotic membrane proteins. In addition, the reaction center structure provided important insights into the general properties to be expected of integral membrane proteins. The Blc. viridis reaction center consists of four subunits. Subunits L and M have similar but not identical amino acid sequences. Each comprises five α-helices that cross the membrane. The co-factors that participate in electron transport are bound to the L and M subunits. Their arrangement is sketched in Fig. 51.2. The primary electron donor (known as P985 because a loss of optical density at 985 nm accompanies its photo-oxidation) is indeed a dimer, in this case of bacteriochlorophyll b. The reaction center also includes two additional molecules of bacteriochlorophyll b, two of bacteriopheophytin b, one molecule each of menaquinone, ubiquinone and carotenoid, and a non-heme ferrous iron ion. Bacteriopheophytin is similar to bacteriochlorophyll, but the Mg2+ is replaced by two protons. Surprisingly, the reaction center has approximate twofold symmetry. The electrons leaving P985 move down only the L side of the reaction center. The first electron transfer, to the accessory bacteriochlorophyll b, occurs within a few picoseconds (10−12 s). The electrons move to the bacteriopheophytin b associated with subunit L, to QA (menaquinone) and, finally, to QB (ubiquinone). Upon receiving two electrons (after two photoacts), the ubiquinone binds two protons from the periplasm as it is reduced to ubihydroquinone. The ubihydroquinone dissociates into the membrane and diffuses to a cytochrome bc1 complex, where it is re-oxidized. The reaction center also includes a cytochrome subunit containing four hemes, which is located on the periplasmic surface (facing the outside of the cell) of the membrane. The hemes donate electrons to oxidized P985. There is also an H subunit, which forms a sort of cap on the cytoplasmic side of the L and M subunits and is anchored to the membrane by a single membrane-spanning helix. Its function is not known. Purple bacterial reaction centers are embedded in the cytoplasmic membrane or in the membranes of intracellular vesicles which are often termed chromatophores.
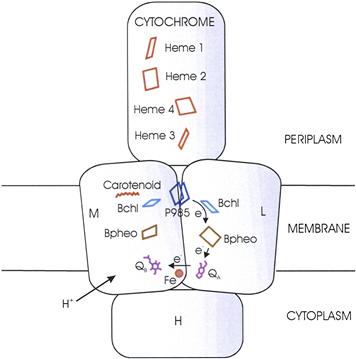
FIGURE 51.2 The arrangement of the co-factors in the Blastochloris viridis reaction center. The reaction center has approximate twofold (C2) symmetry, but electrons move only along the path indicated. After QB accepts two electrons, two protons from the cytoplasmic side of the membrane are bound. P985, the photochemically active bacteriochlorophyll b dimer; Bchl, bacteriochlorophyll b; BPheo, bacteriopheophytin b; QA, menaquinone; QB, ubiquinone; Fe, ferrous iron.
Photosynthetic electron transport systems are capable of transporting electrons much more rapidly than photons of sunlight arrive at the special pairs. Therefore, reaction centers are accompanied by arrays of light-harvesting antenna pigments whose purpose is to capture photons and transfer the excitation energy to the special pairs. Purple bacterial reaction centers are surrounded by a “picket fence” of transmembrane dimers to which are bound bacteriochlorophyll and carotenoid molecules. The monomers, designated α and β, comprise the LH1 (light-harvesting 1) complex (Fig. 51.3). The carotenoids absorb photons in the middle of the visible spectrum and quickly pass the excitation to the bacteriochlorophyll. The bacteriochlorophyll absorbs photons in the blue, red and near-infrared regions of the spectrum. The excitations become delocalized within the circle of bacteriochlorophylls within femtoseconds (10−15 s) and are transferred to the special air in tens of picoseconds, faster than many can be lost as heat or fluorescence. Details of these processes are discussed by Blankenship (2002).
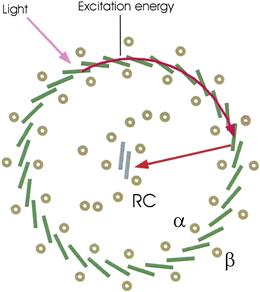
FIGURE 51.3 Light absorption and the transfer and capture of excitation energy. Protein dimers to which BChl and carotenoid molecules are bound form a ring around the reaction center. (Higher plant light harvesting pigments have a quite different structure.) Light is absorbed by any bacteriochlorophyll molecule (dark rectangles). The excitation energy is then delocalized among the bacteriochlorophyll molecules and finally captured by a special bacteriochlorophyll pair in the reaction center (RC). The figure is based on the structure of the bacterial light-harvesting complex reported by Cogdell et al. (1999).
Other purple bacterial reaction centers have the same basic structure, but with variations. Most have bacteriochlorophyll α, bacteriopheophytin α and only ubiquinone. Many lack a bound cytochrome subunit. Observation of their topography by atomic force microscopy has revealed a variety of arrangements of LH1, including reaction centers multimers surrounded by continuous LH1 complexes (Sturgis and Niederman, 2008). Many have peripheral light-harvesting complexes, designated LH2, LH3, etc. Like LH1, they are composed of α and β subunits arranged in cylinders. They transfer absorbed excitations to LH1.
IIC Photosynthetic Bacteria
Photosynthetic bacteria play many important roles in the environment. As much as a third of the earth’s photosynthesis is performed by microorganisms in the oceans. Six bacterial phyla include photosynthetic members (Blankenship, 2002; Jones, 2009; Golbeck, 2010; see Chapter 50). Five of them are termed anoxygenic because they are unable to oxidize water and evolve oxygen. Two of these possess type II reaction centers, which are basically similar to the Blc. viridis reaction center. Their terminal electron acceptors are quinones. Members of two phyla possess type I reaction centers. These have quinone acceptors, but rather than becoming doubly reduced and dissociating, the final quinone acceptor donates an electron to a bound iron-sulfur center (Fig. 51.4). Their core proteins are homodimers (identical monomers), rather than heterodimers like the L and M proteins of purple bacteria; they are flanked by two symmetrical light-harvesting domains. Members of the sixth phylum, the cyanobacteria, have both type I and type II reaction centers, connected in series. They are able to oxidize water and evolve oxygen and are termed oxygenic.
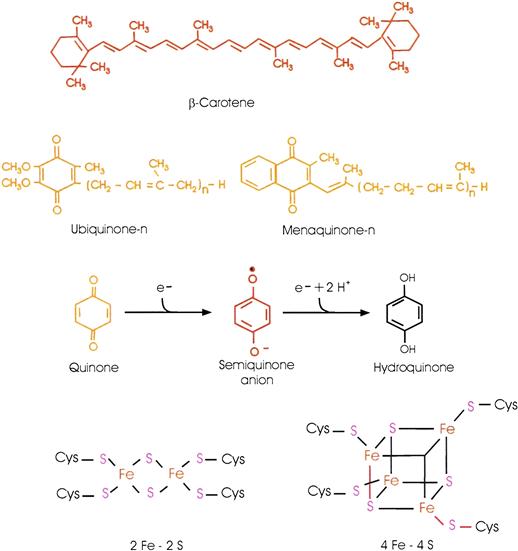
FIGURE 51.4 Structures of some of the molecules and co-factors involved in photosynthesis. Other carotenoids and quinones are found in many photosynthetic organisms. The quinone, semiquinone anion and hydroquinone forms of the quinone six-membered ring are shown.
Purple bacteria belong to the Proteobacteria, along with such bacteria as E. coli. They are found in many terrestrial and aquatic environments, sometimes even in symbiotic associations with eukaryotes. Some are obligate anaerobes; others can grow photosynthetically in the absence of oxygen, heterotrophically (using organic compounds as carbon sources) in its presence, or by fermentation. One group, the aerobic anoxygenic phototrophs or aerobic photosynthetic bacteria, form the photosynthetic system only in the presence of oxygen. Most purple bacteria can fix nitrogen. One, related to Rhodpseudomonas palustris, may have been the ancestor of Bradyrhizobum, which includes the soybean symbiont. The Chloroflexi (green non-sulfur or green filamentous bacteria) have type II reaction centers, although their subunits and co-factors differ somewhat from those of the purple bacteria. They also possess a very large bacteriochlorophyll-containing light-harvesting structure known as a chlorosome (Blankenship, 2002), which allows them to grow in very dim light.
A special issue of Photosynthesis Research is devoted to bacteria having type I reaction centers (see Golbeck, 2010). The Chlorobi (green sulfur bacteria) are obligate anaerobes, use reduced sulfur compounds as electron sources and also contain chlorosomes. The Firmicutes (e.g. heliobacteria) are Gram-positive anaerobes that prefer high light environments, use light energy to fix nitrogen and grow on organic compounds. They are often found in rice fields. Candidatus, belonging to the Acidobacteria, is thought to be aerobic, contains chlorosomes and does not fix carbon or nitrogen. The Cyanobacteria are oxygenic – they can oxidize water and evolve oxygen and possess both type I and type II reaction centers. They have light-harvesting systems known as phycobilisomes whose chromophores (light-absorbing entities) are linear tetrapyrroles known as phycobilins. They are found in many environments, are active nitrogen fixers and are responsible for the toxic blooms that appear in eutrophic waters. The bacterium Halobacterium halobium performs photosynthesis in a quite different way. Rather than chlorophyll, it uses bacteriorhodopsin, a carotenoid-containing protein resembling the visual pigment rhodopsin, to capture the energy of light in a process that does not involve electron transfer (Subramaniam and Henderson, 2000).
IID Evolution of Photosynthesis
It is believed that the earliest photosynthetic bacterium appeared as early as 3.4 billion years ago at a time when the earth’s atmosphere contained almost no oxygen (Blankenship, 2002; Olson and Blankenship, 2004; Blankenship et al., 2007). Its ancestor was presumably a lithotrophic bacterium that used H2 or sulfide as an electron donor and had an electron transport system that included cytochromes. The chlorophyll biosynthesis pathway probably evolved from the heme biosynhesis pathway; the early steps are identical. Substitution of magnesium for iron would have produced a pigment having a much longer-lived excited state, more able to transfer an electron before it decayed. Reductions of some of the double bonds, perhaps by reductases related to the already present nitrogenase, created pigments able to absorb visible or near-infrared light. The first reaction center is thought to have been a monomer. Its structure may have resembled that of cytochrome b, which also binds tetrapyrroles and quinones. Gene duplication would have led to a bacterium having a homodimeric reaction center. Further duplications followed by evolutionary changes would have given rise to all of the contemporary reaction center types. Similarities in structure and amino acid sequence have led to the belief that they share a common ancestor. The evolutionary scenario is complicated by extensive lateral gene transfer.
Then, perhaps as early as 2.7 billion years ago, the cyanobacteria appeared. They possessed both type I and type II reaction centers, connected in series, and in the light could generate an oxidant strong enough to oxidize water. The new bacterium had access to a seemingly limitless source of electrons – water. The cyanobacteria may have arisen when genes for type I or type II reaction centers were transferred to a bacterium having the opposite type of reaction center. Alternatively, gene duplication and evolution may have created two reaction centers in the same bacterium. Loss of one or the other might have led to the appearance of each type of photosynthetic bacterium.
The cyanobactria formed oxygen as the byproduct of water oxidation. At first, the oxygen may have been consumed in chemical reactions with reductants such as Fe2+ but, by 2.3 billion years ago, it was accumulating in the atmosphere. The oxygen gave rise to the ozone layer and so permitted the development of higher organisms by shielding them from ultraviolet radiation.
Once oxygen was present, respiration and oxidative phosphorylation became possible. Using oxygen as an electron acceptor, bacteria could reoxidize photosynthetically synthesized molecules and regain some of the energy stored in them:
 (51.3)
 (51.4)
Many of the proteins photosynthetic bacteria used for photosynthesis could also be used for oxidative phosphorylation. Several lines of evidence suggest that purple photosynthetic bacteria might have been the ancestors of non-photosynthetic bacteria that perform oxidative phosphorylation and that the mitochondria of eukaryotic cells evolved from such bacteria which had formed symbiotic associations with primitive eukaryotic cells (Woese, 1987). Thus, it is no coincidence that the mechanisms of photosynthesis and respiration are similar in many respects. Much of our understanding of oxidative phosphorylation has come from studies of photosynthesis, which have exploited the experimental advantages of a system that can be driven by light.
In algae and higher plants, photosynthesis takes place in organelles known as chloroplasts. There is evidence that chloroplasts evolved from a cyanobacterium or Prochloron, which had formed a symbiotic association with a eukaryote about 1.5 million years ago. This eukaryote was the progenitor of the glycophyte, red and green algae (Margulis, 1970; Hackett et al., 2007). The green algae were the ancestors of the land plants. Secondary endosymbioses occurred when some of these algae were incorporated by other eukaryotes, leading to the appearance of still other types of algae.
III Chloroplasts
In higher plants, most chloroplasts are found in the mesophyll cells of leaves (Fig. 51.5). The chloroplast contains a collection of flattened membranous vesicles called thylakoids which are enclosed in an envelope formed by a double membrane (Fig. 51.6). The outer membrane contains channels formed by the protein porin and is freely permeable to substances whose molecular mass is below about 10 kDa. The inner membrane is selectively permeable and contains a number of metabolite transporters which mediate the interaction between metabolism in the plant cytosol and within the chloroplast. The volume surrounding the thylakoids is known as the stroma. The thylakoid membranes contain the pigments that capture light and, like the cristae of mitochondria, they contain an electron transport system coupled to an adenosine triphosphate (ATP) synthase. The soluble enzymes responsible for carbon dioxide assimilation are found in the stroma. In many chloroplasts of land plants and green algae, the thylakoid membranes are stacked tightly together in some regions to form structures called grana, which look like green grains under the light microscope. The grana are connected by non-stacked thylakoid extensions, the stroma lamellae.
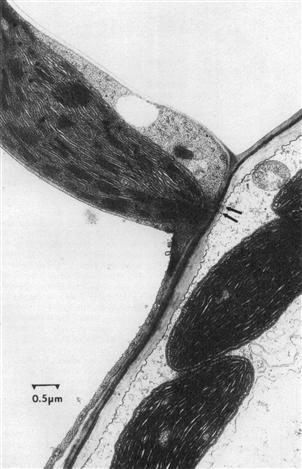
FIGURE 51.5 Transmission electron micrograph of corn (Zea mays) chloroplasts. Upper left: chloroplast within mesophyll cell. Lower right: chloroplast within bundle sheath cell. Arrows indicate plasmodesmata through which metabolites are exchanged between the cells. The mesophyll cells lie near the leaf surface. The bundle sheath cells lie near the leaf vascular bundles. Note the grana in the mesophyll chloroplast. (Micrograph courtesy of Iain M. Miller.)
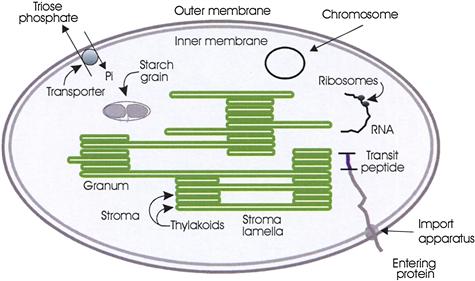
FIGURE 51.6 Diagram of a chloroplast.
Chloroplasts still retain genes, which are located on a chromosome found in the stroma, for many of the proteins involved in photosynthesis and for transfer and ribosomal RNA. Proteins coded by chloroplast genes are synthesized on ribosomes located in the stroma. Genes for other chloroplast proteins are now located on nuclear chromosomes of the plant cell. Remarkably, many multisubunit proteins of the chloroplast thylakoid, including the ATP synthase, contain both subunits coded on nuclear genes and synthesized on cytosolic ribosomes and subunits coded on chloroplast genes and synthesized on stromal ribosomes. Blankenship (2002) summarizes the emerging understanding of how the plant coordinates the synthesis of these subunits. Regulation of the translation of chloroplast-coded mRNA by nucleus-coded proteins that are imported into the chloroplast and degradation of excess subunits that are not incorporated into complexes play major roles. Chloroplast proteins that are synthesized in the plant cytosol are initially formed with amino terminal extensions, termed transit peptides, which allow them to bind to receptors on the membranes and then enter the chloroplast. The process requires GTP, ATP and molecular chaperones. After the proteins have entered the chloroplast stroma, the transit peptides are removed by a highly specific protease. Proteins destined for the membrane or lumen of the thylakoid are formed with an additional presequence, which is proteolytically cleaved after it has allowed the protein to enter the thylakoid membrane or lumen.
IV Biochemistry of Carbon Assimilation
IVA The Reductive Pentose Phosphate Cycle
To determine the sequence of reactions involved in the conversion of carbon dioxide to sugars, in the early 1950s, Melvin Calvin and his associates exposed algae to 14CO2 and light for different periods. After treatment with boiling alcohol, the carbon compounds that had been formed were separated by paper chromatography. The manner in which the distribution of 14C among the carbon atoms of the various carbon compounds changed with time revealed the operation of a cyclic process, which has become known as the reductive pentose phosphate cycle, or Calvin cycle (Fig. 51.7).
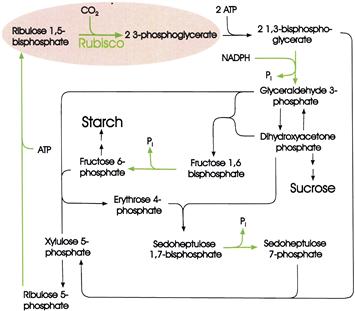
FIGURE 51.7 The reductive pentose phosphate or Calvin cycle. Stoichiometries are shown only for the first two steps. Erythrose, xylulose and sedoheptulose are sugars that contain 4, 5 and 7 carbons, respectively. Green arrows indicate steps catalyzed by light-regulated enzymes (Schurmann and Buchanan, 2008).
In the first step, CO2 combines with ribulose 1,5-bisphosphate to form two molecules of 3-phosphoglycerate. The reaction is catalyzed by ribulose 1,5-bisphosphate carboxylase/oxygenase, often referred to as rubisco. This enzyme has a rather low affinity for CO2. To compensate, it is present in extremely high concentrations in the chloroplast and is probably the most abundant protein on earth. Next, the 3-phosphoglycerate is phosphorylated to form 1,3-bisphosphoglycerate which, in turn, is reduced to glyceraldehyde 3-phosphate by nicotinamide adenine dinucleotide phosphate (NADPH). In the remaining steps of the cycle, ribulose 1,5-bisphosphate is regenerated by a pathway that includes a complicated series of rearrangements catalyzed by transketolases and aldolases.
Intermediates in the cycle, including fructose 6-phosphate, glyceraldehyde 3-phosphate and dihydroxyacetone phosphate, serve as precursors for the starch, sucrose and amino acids that are the final products of photosynthesis.
ATP is required for the conversion of 3-phosphoglycerate to 1,3-bisphosphoglycerate and for the conversion of ribulose 5-phosphate to ribulose 1,5-bisphosphate. NADPH is required for the reduction of 1,3-bisphosphoglycerate to glyceraldehyde 3-phosphate. For each molecule of CO2 fixed, three molecules of ATP and two molecules of NADPH are needed. It is the function of the light-driven reactions in the thylakoid membranes to furnish this ATP and NADPH.
IVB Photorespiration and C4 Plants
Not only does ribulose 1,5-bisphosphate carboxylase/oxygenase have a low affinity for CO2, it also catalyzes a competing reaction in which O2 rather than CO2, is added to ribulose-1,5-bisphosphate. The products are 3-phosphoglycerate and phosphoglycolate.
 (51.5)
This reaction seems to serve no useful purpose. Many plants grow much faster in a CO2-enriched atmosphere in which the carboxylation reaction can compete more effectively with the oxygenation reaction. It appears that in the 2 billion years since plants began to fill the atmosphere with oxygen while removing CO2 from it, they have been unable to modify the enzyme so that its affinity for CO2 is increased or its affinity for O2 is decreased significantly. Molecular biologists are now trying to accomplish that task.
Part of the carbon appearing in phosphoglycolate is rescued. In a series of reactions occurring in peroxisomes and in mitochondria, two molecules of phosphoglycolate are converted to one molecule of glycerate, which is returned to the chloroplast and re-phosphorylated. But one carbon atom is lost as CO2 and ATP and O2 are consumed. This process is known as photorespiration. It is not coupled to ATP formation and the net result is waste of ATP and fixed carbon.
A number of plants, including corn, sugarcane and crabgrass, partially avoid photorespiration by concentrating CO2 in the cells that contain the Calvin cycle enzymes, so that carboxylation can compete more effectively with oxygenation. In these plants, the Calvin cycle enzymes are located in the chloroplasts of the bundle sheath cells, which surround the vascular bundles deep within the leaves (see Fig. 51.5). CO2 is first captured in the mesophyll cells, which lie near the leaf surface, by carboxylation of phospho-enolpyruvate (PEP):
 (51.6)
The carboxylation is catalyzed by PEP carboxylase, an enzyme that has a high affinity for CO2 and does not catalyze an oxygenation reaction. Oxaloacetate is next reduced to malate (or transaminated to form aspartate in some plants). The malate or aspartate is transferred to the bundle sheath cells through fibers known as plasmodesmata. Some of these can be seen at the arrows in Fig. 51.5. Malate is oxidatively decarboxylated to pyruvate in the bundle sheath cells in a reaction that also generates NADPH. The CO2 that is released enters the Calvin cycle in the bundle sheath cells (Fig. 51.8). Pyruvate returns to the mesophyll cells where it is again transformed to PEP. The net result is the transfer of CO2 and NADPH to the bundle sheath cells.
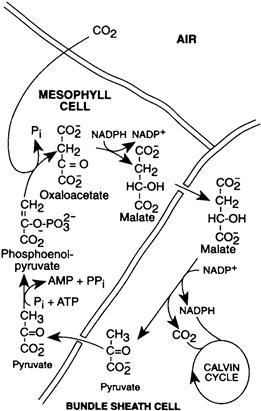
FIGURE 51.8 The mechanism used by C4 plants to concentrate CO2 and NADPH in bundle sheath cells. CO2 is captured in the mesophyll cells by carboxylation of phosphoenolpyruvate. Malate is transferred to the bundle sheath cells where CO2 is released and NADPH is formed to enter the Calvin cycle. Pyruvate returns to the mesophyll cells.
The CO2-concentrating mechanism consumes energy, since ATP is converted to adenosine monophosphate (AMP) and phosphate. Nevertheless, plants that use it are often referred to as efficient plants because avoidance of photorespiration more than compensates for this expense. Such plants are usually known as C4 plants because of the involvement of four-carbon acids. Many C4 plants are native to tropical areas, where the C4 pathway is especially advantageous since high temperatures and bright sunlight encourage photorespiration.
V Formation of ATP
VA Light-Driven Electron Transport and ATP Synthesis
Carbon dioxide fixation requires ATP and NADPH. It seemed reasonable to suspect that the role of light is to provide the energy necessary for their formation. Photosynthetic membranes contain electron transport chains much like those of mitochondria, and light can drive electron transport along the chains (see Figs. 51.4 and 51.9). As in mitochondria, ATP formation is coupled to the electron transport.
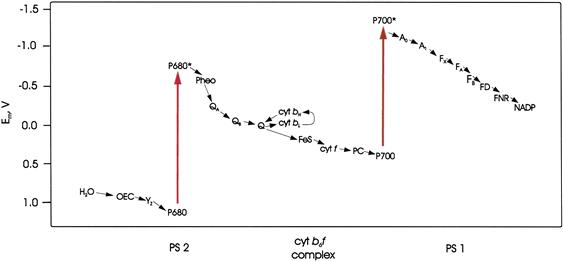
FIGURE 51.9 The electron transport system of higher plant chloroplasts. Midpoint redox potentials (Em) of the components are indicated. P680 and P700 are chlorophyll a dimers which, when excited by light (large arrows), transfer an electron to the acceptors pheophytin a (Pheo) and chlorophyll a (A0), respectively. Typical electron transfer times are shown for the electron transfer steps, which are indicated by arrows. ps: picoseconds; μs: microseconds; ms: milliseconds; OEC, a complex containing four manganese nuclei, a calcium ion and a chloride ion that accepts electrons from water; YZ, tyrosine; QA, QB and Q, plastoquinone; cyt bH and cyt bL, the high and low potential hemes, respectively, of cytochrome b; FeS, the 2Fe–2S center of the Rieske protein; cyt f, cytochrome f; PC, plastocyanin, a water-soluble copper-containing protein; A1, phylloquinone; FX, FA, FB, 4 Fe-4 S clusters; FD, ferredoxin, a water-soluble protein containing a 4 Fe–4 S cluster.
How can electron flow through the electron carriers shown in Fig. 51.4 cause ATP formation? Mitchell (1979) suggested that electron transport and ATP formation are both coupled to the movement of protons across membranes. His chemiosmotic hypothesis helps us understand the reason for the arrangement of the electron carriers within photosynthetic membranes.
VB The Chemiosmotic Hypothesis
It was known that electron transport in mitochondria and chloroplasts is accompanied by the movement of protons across the cristae or thylakoid membranes. Mitchell suggested that the transmembrane pH difference (often called a proton gradient) that is formed is an intermediate in phosphorylation. Electron transport would drive proton translocation and the proton gradient in turn would drive ATP synthesis.
Two experiments involving photosynthetic material played a critical role in convincing scientists that the chemiosmotic hypothesis must be taken seriously. Chloroplasts will synthesize ATP even if they are illuminated in the absence of ADP and Pi and then left in the dark for several minutes before these substrates are added. A relatively stable “high energy intermediate” has been formed in the light and can later drive ATP formation in the dark. Andre Jagendorf and Ernest Uribe (1966) learned that the illumination step was most efficient when the pH of the medium was about 4, while the ATP synthesis step was most efficient at pH 8. Therefore, they routinely illuminated the chloroplasts in medium buffered at pH 4 with succinate, then increased the pH to 8 before adding ADP and Pi. But ATP was formed by this procedure even if the chloroplasts were not illuminated! The quick increase in pH had created a proton gradient across the thylakoid membranes; the lumen pH had remained near 4 while the external pH had increased to 8. The simplest explanation was that the proton gradient had driven the ATP formation.
Halobacterium halobium is a red bacterium found in lakes that have a high salt content. It can form ATP in the light in a quite unusual way. The membrane of the bacterium contains purple domains in which molecules of the transmembrane protein bacteriorhodopsin are packed together in a hexagonal lattice. Each molecule of bacteriorhodopsin contains a molecule of all-trans-retinal attached as a Shiff base to a lysine residue. Upon absorbing light, the retinal is isomerized to the 13-cis isomer, initiating a cycle of events resulting in the translocation of a proton from the inside to the outside of the cell and regeneration of all-trans-retinal (Subramaniam and Henderson, 2000). The electrochemical proton gradient that is established is used to drive ATP formation.
ATP synthesis in mitochondria is catalyzed by a membrane-associated ATP synthase. Photosynthetic ATP formation is catalyzed by a similar protein. Ephraim Racker and Walter Stoeckenius (1974) incorporated purified bacteriorhodopsin into artificial phospholipid vesicles. When the vesicles were illuminated, protons were pumped into the vesicles. Protons were pumped inward rather than outward because the bacteriorhodopsin is incorporated into the membranes in an orientation that was opposite to that in the bacterial membrane. When purified mitochondrial ATP synthase was also incorporated into the vesicles, light caused ATP to be formed from ADP and Pi. This experiment showed that the mitochondrial ATP synthase can catalyze ATP formation in the absence of any other mitochondrial protein, including those of the electron transport chain. Only an electrochemical proton gradient is required.
How might the pH gradient be established? Some electron carriers, such as cytochromes and iron–sulfur proteins, cannot cross membranes. Others, such as quinones, are soluble in membranes and, as illustrated in Fig. 51.4, may bind protons after they have accepted electrons.
Mitchell (1979) proposed that the electron carriers are arranged asymmetrically in the membrane. The principle is illustrated in the upper part of Fig. 51.10. Carriers that bind protons would alternate in the electron transport chain with those that do not. Electron transfers that result in H+ binding (A → B) would occur on one side of the membrane (the stromal side in Fig. 51.10), while electron transfers that result in H+ release (B → C) would occur on the opposite side (the luminal side). In one direction (from the stromal side to the luminal side), electrons and protons would always move together across the membrane. In Fig. 51.10, BH serves as the carrier of an electron and a proton. Electrons would always move alone across the membrane in the opposite direction (C → D). In this way, the net transfer of protons would accompany electron transport across the membrane. Such electron transport is sometimes described as vectorial, since it has a defined direction within the membrane, unlike electron transfer that occurs in solution. As we will see, proton translocation is coupled to electron transport in other ways as well.
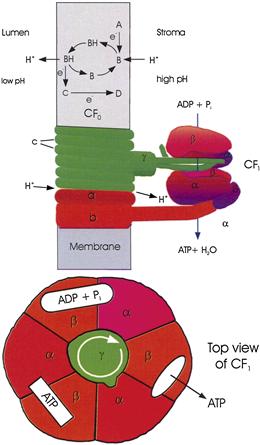
FIGURE 51.10 An illustration of how electron transport and ATP formation might be coupled. Top: Example of how electron and proton transport might be coupled. A, B, C and D are electron carriers that cannot move through the membrane. B is a molecule, such as a quinone, which becomes protonated when it accepts an electron, diffuses across the membrane and releases the proton when it is reoxidized. Center: The ATP synthase, illustrating current conceptions of how proton transport might be coupled to ATP formation. The α and β subunits of CF1 are held fixed, while H+ flow through CF0 causes rotation of the c and γ subunits. As projections of γ contact each αβ pair in succession, they cause conformational changes that allow binding of ADP and phosphate, ATP formation and ATP release. CF1 is shown as a section through the γ subunit. Bottom: top view of CF1, illustrating how rotation of the γ subunit may induce successive steps in ATP formation.
Protons would flow back across the membrane through the ATP synthase. This proton flow would drive ATP formation. How it does so will be discussed in Section VD.
VC Storage of Free Energy in an Electrochemical Gradient
When an uncharged molecule moves from a region where its concentration is C1 to a region where its concentration is C2 there is a free energy change:
 (51.7)
per mole transferred. Since:
 (51.8)
this free energy change is due to the change in entropy, ΔS, that accompanies the change in distribution of the molecules. When a charged particle such as a proton moves between regions whose electrical potentials differ, there is an additional free energy change per mole transferred:
 (51.9)
where z is the number of charges on the molecule, F is Faraday’s constant (23 kcal/V mol) and Δψ is the electrical potential difference in volts. Such a difference in both concentration and electrical potential is often called an electrochemical gradient. There can be an electrochemical proton gradient between the chloroplast stroma and the thylakoid lumen. This gradient is created by the transfer of protons and electrons across the membrane during electron transport. For the transfer of protons (z = +1) from the stroma to the lumen:
 (51.10)
This free energy difference is sometimes known as protonmotive force and abbreviated Δp, ΔμH+, or pmf. Protons can be transported across the thylakoid membrane against their electrochemical gradient because the transfer is coupled to exergonic electron transfer. The proton translocation shown in Fig. 51.10 can occur if the sum of ΔG for proton translocation and ΔG of electron transfer from A to D is less than zero.
VD ATP Synthase
The chloroplast ATP synthases are found in the stroma lamellae and in the unappressed membranes of the grana, but rarely in appressed granal membranes (see Fig. 51.6). The synthase has a structure similar to that of the mitochondrial ATP synthase (see Fig. 51.10). It consists of a transmembrane domain (CF0) and a catalytic domain (CF1) located on the stromal surface of the thylakoid membrane. Each includes several kinds of subunit.
Biochemical (Boyer, 1997) and crystallographic (Abrahams et al., 1994) studies of the ATP synthase have suggested that proton efflux through F0 may be coupled to ATP formation in the following way. CF1 includes three α and three β subunits, which form a ring of αβ dimers (see Fig. 51.10, bottom). Each β subunit contains a catalytic site. At each of the three catalytic sites, the following steps occur. (1) ADP and phosphate bind loosely. (2) After a conformation change, the binding becomes tight and ATP is formed. (3) After a second conformation change, ATP is released. It is this step, rather than ATP formation, that requires the greatest energy input. (4) After a third conformational change, the site is ready to bind ADP and phosphate loosely again. The steps occur at each catalytic site in sequence and cooperatively, e.g. as one site is binding ADP and phosphate, another is converting them to ATP and the third is releasing ATP. What then causes the conformational changes? F0 includes 9–15 copies of subunit c, a small transmembrane protein. The c subunits form a ring in the membrane. Each subunit may be able to bind a proton from the luminal side of the membrane; the proton may then be released on the stromal side, but only after the c-ring has rotated. Thus, rotation of the c-ring is coupled to proton flow much like rotation of a water wheel is coupled to water flow. The proton translocation is thought to occur at the interface of the c-ring and another transmembrane subunit, the a subunit. The c-ring is attached to the γ subunit, a rod-shaped protein that extends into the hole formed by the αβ ring. Proton efflux through the c-ring would thus cause the γ subunit to δ subunit). As projections on the γ ring contact each αβ dimer in turn, they would induce the conformational changes that lead to ATP formation. Translocation of 9–15 protons and formation of three ATPs would accompany each full rotation of the c–γ complex, consistent with the observation that translocation of three to four protons is required for each ATP formed (Feniouk and Junge, 2009). Thus, ATP formation is thermodynamically possible when μH+ is more than one-third or one-fourth of ΔG of ATP formation.
The ATP synthase is intricately regulated, presumably to prevent the reversal of ATP synthesis in the dark. It is activated by the presence of a sufficiently large ΔμH+. Until it is activated, it will neither synthesize nor hydrolyze ATP. Reduction of a CF1 disulfide bridge by reduced thioredoxin, which is formed when chloroplasts are illuminated, enhances the efficiency of the activated ATP synthase when ΔμH+ is small.
VI Photosynthetic Electron Transport
VIA The Interaction of Light with Molecules
A light wave consists of an electric field and a magnetic field whose directions are perpendicular to each other. The wave moves through space at a velocity:
 (51.11)
where n is the refractive index of the medium through which the light is moving and c is the speed of light in a vacuum, 3.0 × 08 m/s. The wavelength of the light, λ, is the distance between the crests of the waves. Visible light has a wavelength between 400 and 700 nm. The frequency of the light, v, is the frequency with which crests of the waves pass a given point in space, and:
 (51.12)
According to the principles of quantum theory, light can be absorbed or emitted only in discrete units called quanta. The energy, E, of such a quantum depends upon the frequency of the light according to the equation:
 (51.13)
where h is Planck’s constant, 2.86 × 10−37 kcal s.
Just as the electrons of atoms occupy atomic orbitals having discrete energies, the electrons in molecules occupy molecular orbitals having discrete energies. Molecular orbitals may extend over several nuclei. Each molecular orbital can contain two electrons of opposite spin. Absorption of light can promote (excite) an electron to an orbital of higher energy (Fig. 51.11) if the energy difference between the orbitals is equal to the energy of a quantum of the light. Several competing processes may occur after light is absorbed. The excited electron may drop back to its ground molecular orbital. As it does so, the excitation energy may be re-emitted as light (fluorescence), it may be lost as heat, or it may be transferred to a neighboring molecule, causing excitation of one of the neighbor’s electrons to a higher orbital. Finally, the excited electron may be transferred to an empty orbital of a neighboring molecule. When this occurs, part of the energy of the absorbed light is conserved as chemical free energy of the electron donor–acceptor pair.
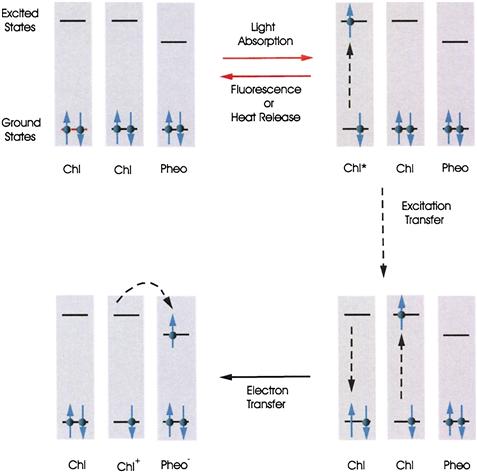
FIGURE 51.11 Light absorption and emission, excitation transfer and photochemical electron transfer. Chlorophyll (Chl) and pheophytin (Pheo) molecules are used as examples. Circles with upward and downward arrows represent electrons having opposite spins. Molecules have many ground and excited orbitals. Only one of each is shown. Chl∗, electronically excited Chl; Chl+, oxidized Chl; Pheo−, reduced Pheo.
The tendency of a biological molecule to donate electrons is usually expressed as its midpoint redox potential at pH 7, Em7· The midpoint potential, Em, is the electrical potential difference that would exist between the standard hydrogen half cell and a solution in which the oxidized and reduced forms of the molecule are present in equal concentrations. In the standard hydrogen half-cell, the pH is 0 and the partial pressure of H2 is 1 atm. The Em7 values for members of the chloroplast electron transport system are indicated in Fig. 51.9. A molecule in which an electron has been excited to a higher orbital has a more negative Em than does the molecule in its ground state, by an amount about equal numerically to the energy difference between the ground and excited orbitals (in electron volts). Thus, it is a better electron donor. Note the difference between the Ems of P680 and P680∗ (and between P700 and P700∗) in Fig. 51.9.
The standard free energy change of an electron transfer is related to the difference between the Em values of the electron donor and acceptor:
 (51.14)
where n is the number of electron equivalents transferred per mole. Thus, excitation of a molecule lowers the free energy change accompanying the transfer of an electron to another molecule. This equation can be used to calculate the free energy changes accompanying the light-induced charge separations and the subsequent electron transfers shown in Fig. 51.9.
Especially lucid explanations of the photochemical processes involved in photosynthesis have been given by Clayton (1970, 1980).
VIB The Presence of Two Photochemical Reactions in Chloroplasts
The most careful measurements of the quantum yield of oxygen evolution indicate that at least eight light quanta must be absorbed for each molecule of oxygen that is evolved. Because the oxidation of two water molecules to form one O2 molecule requires the removal of only four electrons,
 (51.15)
it appeared that two quanta are necessary for the extraction of each electron from water. Robert Emerson illuminated the green alga Chlorella with light of different wavelengths and observed the rates of O2 evolution. He found that when light of wavelength less than 680 nm and light of wavelength greater than 680 nm were given together, the rate of O2 evolution was greater than the sum of the rates observed when the algae were illuminated with light of each wavelength separately; i.e. the two wavelengths acted synergistically (Emerson et al., 1957). This phenomenon, which has come to be known as Emerson enhancement, suggested that efficient O2 evolution requires the cooperation of a system which absorbs long-wavelength light and a system which absorbs short-wavelength light. L.N.M. Duysens found that 680-nm light caused the oxidation of cytochrome f, whereas 562-nm light caused its re-reduction (Duysens et al., 1961). In 1960, R. Hill and F. Bendall (1960) suggested the Z scheme, in which a photosystem driven by short-wavelength light (photosystem 2, PS 2) and a photosystem driven by long-wavelength light (photosystem 1, PS 1) are connected in series. Light absorbed by PS 2 would cause the transfer of an electron from H2O to a chain of electron carriers between the photosystems (cytochrome f is one of these). Light absorbed by PS 1 would cause the transfer of the electron from this chain to NADP+ to form NADPH:
 (51.16)
Absorption of two quanta, one by each photosystem, would be required for the transfer of an electron all the way from H2O to NADP+. Cytochrome f would be reduced by PS 2 and oxidized by PS 1. The complete Z-scheme as it is now understood is presented in Fig. 51.9.
The light-absorbing pigments associated with PS 1 and PS 2 have somewhat different absorption spectra. The PS 2 pigments have very little absorption beyond about 680 nm, so light in this wavelength region drives PS 1 almost exclusively.
VIC Primary Electron Donors and Light-Harvesting Pigments
The absorption spectrum of a typical chloroplast is shown in Fig. 51.1. Bessel Kok noticed that when chloroplasts are illuminated, there is a small decrease in their optical absorbance (“bleaching”) at 700 nm. He suggested that the change was due to the light-induced oxidation of a chlorophyll molecule, resulting in the loss of its optical absorbance at that wavelength (Kok and Hoch, 1961). It was suggested that the primary light reaction is the transfer of an electron from a special chlorophyll molecule, named P700, to an electron acceptor (see Fig. 51.9). In bacteria, illumination caused cytochrome oxidation (detected as a change in optical absorbance at wavelengths where cytochrome absorbs light) as well as bacteriochlorophyll oxidation. To determine whether bacteriochlorophyll or cytochrome oxidation occurs first, William Parson illuminated bacteria with very short flashes from a Q-switched laser. Immediately after the flash, he observed oxidation of bacteriochlorophyll. The bacteriochlorophyll became reduced again in a few milliseconds and, as it did, the cytochrome became oxidized. The bacteriochlorophyll had been oxidized first; the cytochrome had then donated an electron to the oxidized bacteriochlorophyll (Straley et al., 1973).
The laser flash had been so brief that it ended before the electron lost by the bacteriochlorophyll had been replaced by an electron from the cytochrome, so the flash had caused the transfer of only a single electron from the bacteriochlorophyll. Such single turnover flashes have been a powerful tool for the study of photosynthetic electron transport. Lasers capable of producing flashes femtoseconds (10−15 s) in duration have made it possible to measure the rates of very early electron transfer steps, some of which occur in picoseconds (10−12 s).
P700 is the primary electron donor in PS 1. The primary donor of PS 2 absorbs at 680 nm and is known as P680. Oxidized chlorophyll contains an unpaired electron (see Fig. 51.11). Such molecules can be studied by the technique of electron paramagnetic resonance spectroscopy, in which the absorption of microwaves by the unpaired electrons is measured. Study of P680 and P700 by this technique, as well as other experiments, suggested that they are dimers of chlorophyll a. After they have lost an electron, the remaining unpaired electron is shared between the two chlorophyll molecules that comprise the dimers.
The details of many biophysical techniques, including optical spectroscopy and magnetic resonance, which are employed in photosynthesis research are described in Amesz and Hoff (1996).
Most of the chlorophyll in cells serves only to capture light and does not participate in photochemistry. Each photochemically active chlorophyll dimer (P680, P700) is associated with an aggregate of several hundred light-harvesting chlorophyll molecules, known as a photosynthetic unit. After any chlorophyll molecule in the unit absorbs a quantum of light, the excitation energy migrates among the chlorophyll molecules in the aggregate (see Fig. 51.11). When the excitation reaches the photochemically active dimer, electron transfer occurs. A typical photosynthetic unit contains about 300 chlorophylls molecules. Beta-carotene and other carotenoids also serve as light-harvesting pigments, as do tetrapyrrole pigments known as phycobilins in cyanobacteria and some algae. The pigments are attached to protein molecules. Such accessory pigments allow the capture of light in regions of the spectrum where chlorophyll does not absorb light strongly.
VID The Structure and Function of the Chloroplast Electron Transport System
We can now summarize the way the chloroplast electron transport system is believed to operate (see Figs. 51.9 and 51.12). The components have redox potentials that allow electrons to move forward along the chain; they are arranged in the membrane and oriented in such a way that forward electron transfer is fast and electron flow results in translocation of protons across the membrane.
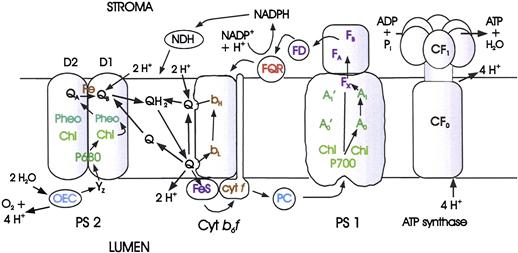
FIGURE 51.12 Electron and proton transport and ATP formation in chloroplasts. FNR, ferredoxin-NADP+ oxidoreductase; NDH, NADPH dehydrogenase; FQR, ferredoxin-plastoquinone oxidoreductase. Other symbols are defined in the legend of Fig. 51.9.
Photosystem 2 particles from a thermophilic cyanobacterium have been isolated and crystallized (Ferreira et al., 2004; Loll et al., 2005). The PS 2 reaction center contains two subunits, D1 and D2, whose amino acid sequences partially resemble those of purple bacterial reaction center subunits L and M. Like the L and M subunits, D1 and D2 bind the electron transport cofactors. PS 2 contains several additional proteins that are not discussed here.
Formation of one O2 molecule requires the removal of four electrons from two molecules of H2O. Kok suggested that each photochemical act removes one electron from an oxygen-evolving complex (OEC) (Kok et al., 1970). When four electrons have been removed, oxygen molecules are released. The OEC contains four manganese nuclei, a calcium ion and a chloride ion. Its structure and function have been reviewed by Yocum (2008b). The following sequence of events is now believed to occur (see Fig. 51.9). Upon excitation, P680 transfers an electron to a special pheophytin a molecule. An electron is then transferred to P680+ from YZ, a tyrosine residue, which is part of D1. Next, Yz+ receives an electron from the OEC, leaving a positive charge stored in the OEC. This sequence of events is repeated until four positive charges have been stored in the OEC and O2 is released. During the process, four protons are released into the chloroplast lumen. The oxidation states of the manganese cluster are known as S states. Yocum (2008c) represents the series of events as follows:
 (51.17)
where the open arrows represent light-driven electron extractions. All of the S states relax to S1 in the dark, so in practice O2 is evolved after the third flash.
The first electron that had been transferred to pheophytin a moves to QA (plastoquinone) and then to QB (also plastoquinone) to form a plastosemiquinone anion. After a second photon is absorbed, a second electron moves down the chain to QB, reducing it to  then binds two protons from the stroma to form plastohydroquinone. The structures of quinone, semiquinone anion and hydroquinone are shown in Fig. 51.4. At this point, two protons have been taken up from the stroma and four protons have been released into the lumen.
The herbicides atrazine and diuron act by competing with plastoquinone for binding to the QB site on D1.
The plastohydroquinone is released from its binding site on PS 2 and diffuses within the membrane (as QH2 in Fig. 51.12) until it reaches the cytochrome b6f complex. Here it binds to a site (Qo) near the luminal surface of the membrane.
At this point, a series of reactions is initiated that will result in the transfer of additional protons across the membrane. A possible mechanism of the proton translocation, which was suggested by Mitchell, is known as a Q cycle (Crofts, 2004). The bound QH2 donates an electron to a 2 Fe–2 S center known as the Rieske Fe–S center. The electron moves from there to cytochrome f. The cytochrome b6f complex also contains two cytochrome b-type hemes, bH and bL. QH2 as a reductant is not strong enough to donate an electron to these hemes, but the plastosemiquinone that was formed when QH2 transferred the electron to the Fe–S center is, and does so. In effect, the transfer of the first electron from QH2 to the Fe–S center has driven the transfer of the second electron to bL. QH2 has been oxidized to Q, releasing two protons into the lumen. A second QH2 molecule is oxidized by a similar mechanism and a second electron is donated to the hemes. The two heme electrons are then donated to a plastoquinone (Q) molecule, which is bound near the stromal surface. It then binds two protons from the stroma. In the net process occurring at the cytochrome b6f complex, one QH2 has been oxidized, two protons have been removed from the stroma and four protons have been released into the lumen.
The electrons that were transferred to cytochrome f move to plastocyanin, a soluble, copper-containing protein. The plastocyanin diffuses within the lumen until it reaches the PS 1 complex, where it transfers the electron to P700+. P700 is a chlorophyll a dimer.
The x-ray structure of PS1 crystals has been determined (Ben-Shem et al., 2003; Nelson and Yocum, 2006). Along with several other proteins, PS 1 contains a protein dimer, the PsaA and PsaB proteins, to which electron transfer co-factors and a large number of light-harvesting chlorophylls are bound. The PsaA-PsaB dimer has approximate twofold rotational symmetry, as does the purple bacterial reaction center dimer. Excited P700 donates an electron to A0, a chlorophyll a monomer (remember that the acceptor in PS 2 is pheophytin a. From A0, the electron moves to A1, which is phylloquinone, then through the [4Fe–4S] cluster FX to the [4Fe–4S] clusters FA and FB and, finally, to ferredoxin, a soluble [4Fe–4S] protein. From ferredoxin the electron is transferred to (NADP+) by way of the flavoprotein ferredoxin-NADP oxidoreductase, FNR. On reduction the NADP binds a proton in the stroma. Protons return from the lumen to the stroma through the ATP synthase and ATP is formed.
Some of the ferredoxin molecules may transfer their electrons back to oxidized quinone in the membrane to generate more ATP when cellular metabolism requires a higher ATP/NADH ratio than is provided by linear electron transport. This process is known as cyclic photophosphorylation. It may occur by an antimycin A-sensitive pathway from ferredoxin or, as shown in recent studies (Livingston et al., 2010), from NADPH in a process mediate by NADPH dehydrogenase.
VII Regulation of Photosynthesis
Virtually every step in the photosynthetic process is tightly regulated. The precision of this regulation was illustrated in experiments with spinach (Servaites et al., 1989). During illumination of spinach leaves with light whose intensity was varied sinusoidally, the net rate of CO2 fixation perfectly paralleled the light intensity except between hours 4 and 10, when it was saturated. As the light intensity changed, the rates of the reactions leading to CO2 uptake changed in such a way that efficiency of the use of the light remained constant. The final output of photosynthesis, export of fixed carbon from the leaves, remained almost perfectly constant throughout the cycle.
If photosynthesis is to work efficiently, PS 1 and PS 2 must transfer electrons at the same rate. Chloroplasts regulate the rates of the photosystems by regulating the transfer of excitation energy to P680 and P700. Both PS 1 and PS 2 contain chlorophyll molecules bound to proteins that are a permanent part of the PS 1 and PS 2 complexes. CP 43 and CP 47 are part of PS 2 and LHC I is part of PS 1. Chlorophyll is also bound to the PsaA and PsaB proteins of PS 1. Such chlorophyll is known as antenna chlorophyll. In addition, chloroplasts thylakoids contain a protein, known as LHC II (for light-harvesting complex II), to which are typically attached eight molecules of chlorophyll a, seven of chlorophyll b and one or two of xanthophyll per peptide. Under some conditions, LHC II is tightly attached to PS 2 to which it transfers excitation energy. If PS 2 is working faster than PS 1, the quinone pool between PS 2 and PS 1 becomes overreduced. When this happens, a kinase is activated in response to plastohydroquinone binding to the Qo site of the cytochrome b6f complex (Lemeille and Rochaix, 2010). The kinase catalyzes the phosphorylation of some of the LHC II. The phosphorylated molecules dissociate from PS 2. As a result, they no longer transfer excitation energy to PS 2 and so its rate slows. Some of the phosphorylated LHC II associates with PS 1, which is found predominantly in the stroma lamellae, and transfer excitation energy to it instead. Once the quinone pool between PS 2 and PS 1 are no longer overreduced, the kinase is inactivated and a phosphatase removes the phosphate from the LHC II. LHC II returns to the grana lamellae and reassociates with PS 2, most of which is located in the grana. These processes, known as state transitions, are accompanied by changes in the structures of the grana and stroma lamellae (Chuartzman et al., 2008).
A regulatory mechanism that deserves special mention involves the protein thioredoxin, which serves a signal that it is daytime. Thioredoxin contains a disulfide bridge which can be reduced by ferredoxin in a reaction catalyzed by ferredoxin–thioredoxin reductase. In the light, ferredoxin is reduced by PS 1 and, in turn, reduces thioredoxin. Thioredoxin then activates a number of Calvin cycle enzymes and increases the sensitivity of the ATP synthase to ΔμH+ by disulfide exchange. As a result, the Calvin cycle and the ATP synthase are active when there is enough light to drive electron transport (Schurmann and Buchanan, 2008).
BIBLIOGRAPHY
1. Abrahams JP, Leslie AGW, Lutter R, Walker JE. Crystal structure at 2.8-angstrom resolution of F1 ATPase from bovine heart mitochondria. Nature. 1994;370:621–628.
2. Amesz J, Hoff AJ, eds. Biophysical Techniques in Photosynthesis. Dordrecht: Kluwer Academic Publishers; 1996.
3. Ben-Shem. A, Frolow F, Nelson N. The crystal structure of plant photosystem I. Nature. 2003;426:630–635.
4. Blankenship RE. Molecular Mehanisms of Photosynthesis. Oxford: Blackwell Science Ltd.; 2002.
5. Blankenship RE, Sadekar S, Raymond J. The evolutionary transition from anoxygenic to oxygenic photosynthesis. In: Falkowski PG, Knoll AH, eds. Evolution of Primary Producers in the Sea. San Diego: Elsevier; 2007;:21–35.
6. Boyer PD. The ATP synthase: a splendid molecular machine. Annu Rev Biochem. 1997;66:717–749.
7. Brennan T. Photosynthesis timelines. In: Smith KC, ed. Photobiological Sciences Online American Society for Photobiology. 2008;In: http://www.photobiology.info/; 2008.
8. Chuartzman SG, et al. Thylakoid membrane remodeling during state transptions in Arabidopsis. Plant Cell. 2008;20:1029–1039.
9. Clayton RK. Light and Living Matter, Volume 1: the Physical Part. New York: McGraw-Hill Book Company; 1970.
10. Clayton RK. Photosynthesis: Physical Mechanisms and Chemical Patterns. Cambridge: Cambridge University Press; 1980.
11. Cogdell RJ, et al. How photosynthetic bacteria harvest solar energy. J Bacteriol. 1999;181:3869–3879.
12. Crofts AR. The cytochrome bc1 complex: function in the context of structure. Ann Rev Physiol. 2004;66:689–733.
13. Deisenhofer J, Michel H. The photosynthetic reaction centre from the purple bacterium Rhodopseudomonas viridis. EMBO J. 1989;8:2149–2169.
14. Duysens LNM, Amesz J, Kamp. BM. Two photochemical systems in photosynthesis. Nature. 1961;190:510–511.
15. Emerson R, Chalmers R, Cederstrand C. Some factors influencing the long-wave limit of photosynthesis. Proc Nat Acad Sci USA. 1957;43:133–143.
16. Feniouk BA, Junge W. Proton translocatin and ATP synthesis by the F0F1-ATPase of purple bacteria. In: Hunter CN, Daldal F, Thurnauer MC, Beatty JT, eds. The Purple Photosynthetic Bacteria. Springer Science Business Media BV 2009;:475–493.
17. Ferreira KN, Iverson TM, Maghlaoui K, Barber J, Iwata S. Architecture of the photosynthetic oxygen-evolving center. Science. 2004;303:1831–1838.
18. Golbeck JH. Editorial. Photosynth Res. 2010;104:101–102.
19. Hackett JD, Yoon HS, Butterfield NJ, Anderson MJ, Bhattacharya D. Plastid endosymbiosis: sources and timing of the major events. In: Falkowski PG, Knoll AH, eds. Evolution of Primary Producers in the Sea. San Diego: Elsevier; 2007;:109–132.
20. Hill R, Bendall F. Function of two cytochrome components in chloroplasts: A working hypothesis. Nature. 1960;1186:136–137.
21. Hunter CN, Daldal F, Thurnauer MC, Beatty JT, eds. The Purple Phototrophic Bacteria, Advances in Photosynthesis and Respiration, 28. Dordrecht, The Netherlands: Springer; 2008.
22. Jagendorf AT, Uribe E. ATP formation caused by acid-base transition of spinach chloroplasts. Proc Nat Acad Sci USA. 1966;55:170–177.
23. Jones M. Photosynthetic bacteria. In: Smith KC, ed. Photobiological Sciences Online American Society for Photobiology. 2009;In: http://www.photobiology.info/; 2009.
24. Ke B. Photosynthesis: Photobiochemistry, and Photobiophysics. Dordrecht: Kluwer Academic Publishers; 2001.
25. Kok B, Hoch G. Spectral changes in photosynthesis. In: McElroy WD, Glass B, eds. Light and Life. Johns Hopkins Press 1961;:397–416.
26. Kok B, Forbush F, McGloin M. Cooperation of charges in photosynthetic O2 evolution: A linear four step mechanism. Photochem Photobiol. 1970;11:457–475.
27. Lemeille S, Rochaix J-D. State transitions at the crossroad of thylakoid signalling pathways. Photosynth Res. 2010;106:33–46.
28. Livingston AK, Cruz JA, Kohzuma K, Dhingra A, Kramer DM. An Arabidopsis mutant with high cyclic electron flow around photosystem I (hcef) involving the NADPH dehydrogenase complex. Plant Cell. 2010;22:221–233.
29. Loll B, Kern J, Saenger W, Zouni A, Bies J. Toward complete cofactor arrangement in the 3.0 A resolution structure of photosystem II. Nature. 2005;438:1040–1044.
30. Loomis WE. Historical introduction. In: Ruhland W, ed. Encyclopedia of Plant Physiology, Vol V. Berlin: SpringerVerlag; 1960;:85–114.
31. Margulis L. Origin of Eukaryotic Cells. New Haven, Connecticut: Yale University Press; 1970.
32. Mitchell P. Keilin’s respiratory chain concept and its chemiosmotic consequences. Science. 1979;206:1148–1159.
33. Nelson N, Yocum DF. The structure and function of photosystems I and II. Ann Rev Plant Biol. 2006;57:521–565.
34. Olson JM, Blankenship RE. Thinking about the evolution of photosynthesis. Photosynth Res. 2004;80:373–386.
35. Racker E, Stockenius W. Reconstitution of purple membrane vesicles catalyzing light-driven proton uptake and adenosine triphosphate formation. J Biol Chem. 1974;249:662–663.
36. Schurmann P, Buchanan BB. The ferredoxin/thioredoxin system of oxygenic photosynthesis. Antioxid Redox Signal. 2008;10:1235–1274.
37. Servaites JC, Fondy BR, Li B, Geiger DR. Source of carbon for export from spinach leaves throughout the day. Plant Physiol. 1989;90:1168–1174.
38. Straley SC, Parson WW, Mauzerall DC, Clayton RK. Pigment content and molar extinction coefficients of photosynthetic reaction centers from Rhodopseudomonas sphaeroides. Biochem Biophys Act. 1973;305:597–609.
39. Sturgis JN, Niederman RA. Atomic force microscopy reveals multiple patterns of antenna organization in purple bacteria; implications for energy transduction mechanisms and membrane modeling. Photosynth Res. 2008;95:269–278.
40. Subramaniam S, Henderson R. Molecular mechanisms of vectorial proton translocation by bacteriorhodopsin. Nature. 2000;406:653–657.
41. Woese CR. Bacterial evolution. Microbiol Rev. 1987;51:221–271.
42. Yocum C. Photosynthetic reaction centers. In: Smith KC, ed. Photobiological Sciences Online American Society for Photobiology. 2008a;In: http://www.photobiology.info/; 2008a;.
43. Yocum CF. The Ca2+ and Cl- requirements of the O2-evolving complex. Coordination Chem Rev. 2008b;252:296–305.
44. Yocum CF. Oxygen evolution. In: Smith KC, ed. Photobiological Sciences Online American Society for Photobiology. 2008c;In: http://www.photobiology.info; 2008c;.