Chapter 6
New Query Processing Features
In This Chapter
 SQL Server 2016 Service Pack 1
Wait Statistics on Execution Plans

Chapter 5 provided an introduction to SQL Server query tuning and optimization. This material is required reading for all SQL Server professionals and was intended to serve as a foundation for the contents of this chapter. The information in Chapter 5 is applicable to all the previous versions of SQL Server.
In this chapter, I will cover what is new in query processing in SQL Server 2017. In addition, a lot of new features were released early with SQL Server 2016 Service Pack 1. I don’t remember a previous SQL Server service pack bringing so many changes and new features, so I will cover some of them briefly here as well.
Undoubtedly, the most important change brought by SQL Server 2016 Service Pack 1 was that, for the first time in SQL Server history, it provided a consistent programmability surface area for developers across all SQL Server editions. As a result, previously Enterprise Edition–only features, such as columnstore indexes, In-Memory OLTP, always encrypted, compression, partitioning, database snapshots, row-level security, and dynamic data masking, among others, were made available on all SQL Server editions, such as Express, Web, Standard, and Enterprise.
Most of this chapter, however, will focus on the most important query processing innovations in SQL Server 2017: adaptive query processing and automatic tuning. Adaptive query processing offers a new generation of query processing features that enable the query optimizer to make runtime adjustments to statistics and execution plans and discover additional information that can lead to better query performance. Several features were released with SQL Server 2017, and more are promised to be released in the future. Automatic tuning is a very ambitious feature that offers automatic detection and fixes for plan regressions. Another feature, automatic index management, which is available only in Azure SQL Database, lets you create recommended indexes automatically or drop indexes that are no longer used.
In addition to these features, SQL Server 2017 includes other benefits, such as the ability to resume online index rebuild operations; new DMVs such as sys.dm_db_stats_histogram, sys.dm_os_host_info, and sys.dm_db_log_info; support for LOB columns on clustered columnstore indexes; and improvements on In-Memory OLTP, the query store, and the Database Engine Tuning Advisor (DTA) tool. Resumable online index rebuilds can be useful to resume online index rebuild operations after a failure or to pause them manually and then resume for maintenance reasons. The sys.dm_db_stats_histogram DMV returns the statistics histogram for the specified database object, similar to the DBCC SHOW_STATISTICS statement. The sys.dm_os_host_info DMV has been added to return operating system information for both Windows and Linux. Finally, the sys.dm_db_log_info can be used to return virtual log file (VLF) information similar to the DBCC LOGINFO statement.
This chapter will also cover a few other query processing features released in SQL Server in the last few months, including some that are included in SQL Server 2016 Service Pack 1.
Adaptive Query Processing
Adaptive query processing provides a new generation of query processing improvements for SQL Server that enables the query optimizer to make runtime adjustments to statistics and execution plans and discover additional information that can lead to better query performance. For the SQL Server 2017 initial release, adaptive query processing includes the following algorithms:
Batch mode adaptive joins
Batch mode adaptive memory grant feedback
Interleaved execution for multistatement table value functions
Microsoft has also mentioned that more features will be added in the future, including adaptive memory grant feedback for row mode, which was announced recently.
As mentioned in Chapter 5, the estimated cost of a plan is based on the query cardinality estimation, as well on the algorithms or operators used by the plan. For this reason, to estimate the cost of an execution plan correctly, the query optimizer needs to estimate the number of records returned by a given query. During query optimization, SQL Server explores many candidate plans, estimates their relative costs, and selects the most efficient one. As such, incorrect cardinality and cost estimation may cause the query optimizer to choose inefficient plans, which can have a negative impact on the performance of your database.
In addition, cost estimation is inexact and has some known limitations, especially when it comes to the estimation of the intermediate results in a plan. Errors in intermediate results in effect get magnified as more tables are joined and more estimation errors are included within the calculations. On top of all that, some operations are not covered by the mathematical model of the cardinality estimation component, which means the query optimizer has to resort to guess logic or heuristics to deal with these situations. For example, some SQL Server features such as table variables and multistatement table-valued user-defined functions have no support for statistics, and the query optimizer will use a fixed estimate of 100 rows, or 1 row on versions previous to SQL Server 2014.
Traditionally, if a bad cardinality estimation contributed to a suboptimal execution plan, no additional changes were allowed after that and the plan was used to execute the query anyway. So if the estimates were incorrect, the created plan was still used despite the fact that it may be a suboptimal plan. Adaptive query processing offers some improvements to this traditional query optimization model. Let us cover next the first three adaptive query processing algorithms available with SQL Server 2017.
Batch Mode Adaptive Joins
As hinted at in Chapter 5, choosing an incorrect join type due to cardinality estimation errors could seriously impact the performance of queries. Batch mode adaptive joins help with this problem by allowing a plan to select the physical join algorithm dynamically at execution time based on the real number of rows flowing through the join.
The current release of batch mode adaptive joins works only for hash joins or nested loops joins and assumes the join type will initially be a hash join. The adaptive join reads the build input and, if a calculated threshold is met, will continue as a hash join; otherwise, it will use the same input to execute as a nested loops join. The nested loops join will then use the rows already read by the hash join build input, which also means that even if a nested loops join is finally selected, the memory requested is that of a hash join.
Batch mode adaptive joins, as the name may suggest, are currently limited to queries accessing tables with columnstore indexes, although as indicated later, a known workaround could be to create a dummy columnstore index to encourage the use of the adaptive joins on row store structures, too. In any of these cases, the execution plan using adaptive joins will be cached and used for additional executions in which the join algorithm selection will happen at runtime depending on the original calculated threshold.
There are a few limitations with adaptive joins in the current release. First, batch mode adaptive joins currently work only for SELECT statements that are not used on data modification operations. In addition, as suggested earlier, an adaptive join always requires memory for the build phase, which would not be required for a nested loops join. Finally, this build phase is a blocking (or stop-and-go) operation, which will not allow any other processing in the plan until it is completed.
There are a few conditions for batch mode adaptive joins to be considered in a plan:
The query must benefit from either a hash join or a nested loops join. This means that if the third kind of physical join, merge join, is a better choice, the adaptive join will not be used.
The query must use a columnstore index, or, at least, a columstore index must be defined on any of the tables referenced by the query.
The generated alternative solutions of the hash join and the nested loops join should have the same first input, called build input or outer reference, respectively.
Let’s now try the batch mode adaptive joins by creating a columnstore index on the AdventureWorks database. For this and the following exercises, make sure your database is in compatibility level 140 by running the following statement:

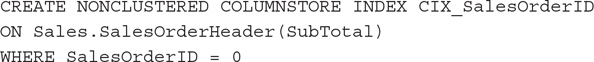
Create the columstore index on the SalesOrderHeader table:

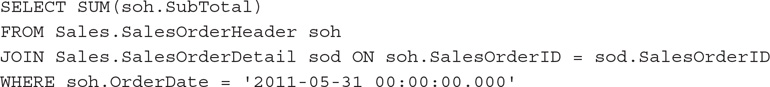
Try the following query:

We get the plan shown in Figure 6-1, which uses the Live Query Statistics feature to help visualize the number of rows read on each executed branch.
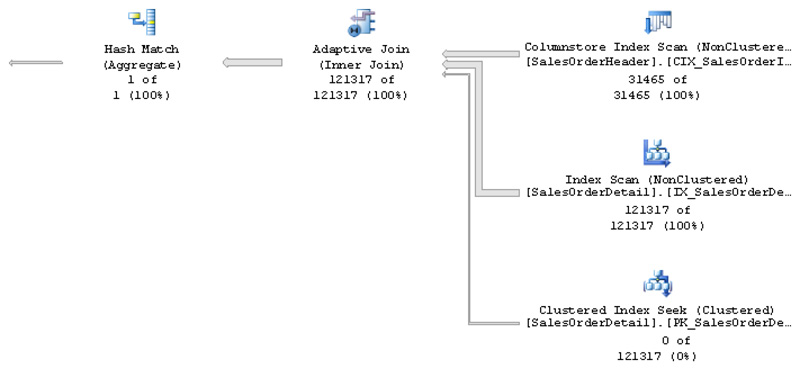
Figure 6-1 Adaptive join query plan
Live Query Statistics is a new query troubleshooting feature introduced with SQL Server 2016, which can be used to view a live query plan while the query is still in execution, enabling you to see query plan information in real time without the need to wait for the query to complete. Since the data required for this feature is also available in the SQL Server 2014 database engine, it can also work in that version if you are using SQL Server 2016 Management Studio or later. There are several ways to enable this feature in SQL Server Management Studio, including selecting Include Live Query Statistics on the SQL Editor toolbar or using similar choices on the Tools menu or Activity Monitor.
Among the items to notice in the plan is the new adaptive join operator. Different from the join operators we know so far, the adaptive join has the following three inputs:
The first or top branch is the build input.
The second or middle branch is the input used if the hash join is selected. Notice that live query statistics shows 121317 of 121317 rows, meaning the branch was executed.
The third or bottom branch is the input used if the nested loops were selected. In this case the branch shows 0 of 121317 rows, meaning it was not executed.
Let us look at the properties of the adaptive join operator, which is shown in Figure 6-2.
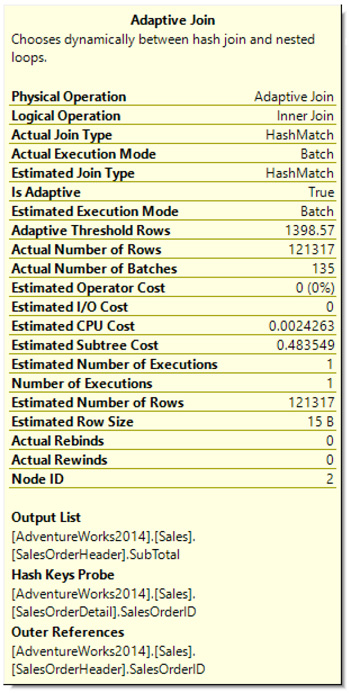
Figure 6-2 Adaptive join operator properties
Several interesting new properties are available. One of them, Adaptive Threshold Rows, shows the number 1398.57. An estimation at or over this value will keep the hash join. An estimation lower will select the nested loops join. Adaptive join operator properties also show the Estimated Join Type and the Actual Join Type.

NOTE
Figure 6-2 shows the operator information from the actual execution plan. If you followed the live query statistics plan, you will see the estimated properties only.
Let us try a second example running the following query:
The live query statistics plan is shown in Figure 6-3.
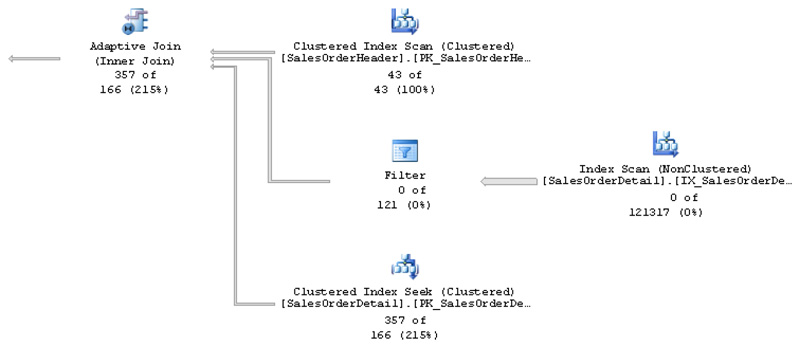
Figure 6-3 Adaptive join query plan using nested loops
As you can see, this time, the third branch was executed, showing 357 of 166 rows. Also notice that a new threshold was calculated. The threshold will depend on the query, and obviously this query is considered different from the previous one. The threshold is based on the estimated number of rows and the cost of using a hash join or a nested loops join for that number of rows. The adaptive threshold rows is now 107.307, (which you can see at the properties of the adaptive join operator as indicated earlier) and since only 43 rows qualified on the build input, the actual join type is nested loops, which can be verified on the actual execution plan.
As mentioned, a current limitation of this feature is that it requires a columnstore index, a limitation that hopefully can be removed in a future release. A workaround to this limitation is to create a dummy columnstore index so the query optimizer can consider using an adaptive join. To test this, drop the current columnstore index:

Now create a dummy columnstore index, in this case, using a filter predicate in which no rows qualify:
You can now run the last SELECT statement again. Using this workaround will obviously not provide the performance benefit of the columnstore index, so the query optimizer will use an adaptive join if using the row stores provides performance benefit measured, as usual, by cardinality and cost estimation. Figure 6-4 shows the plan selected for this query.
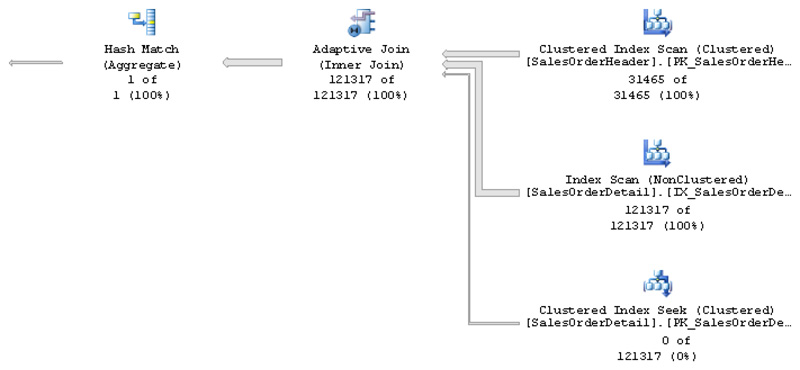
Figure 6-4 Adaptive join query plan using row stores
Batch Mode Adaptive Memory Grant Feedback
Although every query submitted to SQL Server requires some memory, sorting and hashing operations require significantly larger amounts of memory, which, in some cases, can contribute to performance problems. The buffer cache, which keeps data pages in memory, is different from a memory grant, which is a part of the server memory used to store temporary row data while a query is performing sort and hashing operations and is required only for the duration of the query. The memory grant is required to store the rows to be sorted or to build the hash tables used by hash join and hash aggregate operators. In rare cases, a memory grant may also be required for parallel query plans with multiple range scans.
The memory required by a query is estimated by the query optimizer when the execution plan is assembled, and it is based on the estimated number of rows and the average row size in addition to the type of operation required, such as a sort, a hash join, or a hash aggregate. Although this process usually correctly estimates the required memory, in some cases, some performance problem may occur:
A plan underestimating the required memory could lead to additional data processing or to the query operator to use the disk (spilling).
A system running multiple queries requiring sorting or hashing operations may not have enough memory available, requiring one or more queries to wait.
In the first case, usually due to bad cardinality estimations, the query optimizer may have underestimated the amount of memory required for the query and, as a result, the sort data or the build input of the hash operations may not fit into such memory. In the second case, SQL Server estimated the minimum memory needed to run the query, called required memory, but since there is not enough memory in the system, the query will have to wait until this memory is available. This problem is increased when, again due to a bad cardinality estimation, the amount of required memory is overestimated, leading to wasted memory and reduced concurrency.
As mentioned, bad cardinality estimations may happen for several different reasons, and there is no single solution that can work for all the possible statements. For example, some features such as table variables or multistatement table-value functions have a fixed and very small cardinality estimate. In other cases, you may be able to fix the problem, improving the quality of the statistics, for example, by increasing the sample size.
Batch mode adaptive memory grant feedback was designed to help with these situations by recalculating the memory required by a query and updating it in the cached query plan. The memory grant feedback may get information from spill events or from the amount of memory really used. Although this improved memory estimate may not help the first execution of the query, it can be used to improve the performance of the following executions. The batch mode adaptive memory grant process is in fact learning and getting feedback from real runtime information.
Finally, the batch mode memory grant feedback may not be useful and will be automatically disabled if the query has a very unstable and high variation on memory requirements, which could be possible, for example, with parameter-sensitive queries.
Let’s try an example to see how the batch mode memory grant feedback works. We are using a table variable on purpose, which as you know will have a low fixed estimate of 100 rows to help us to create a low memory estimate. Run the following code and request the execution plan:
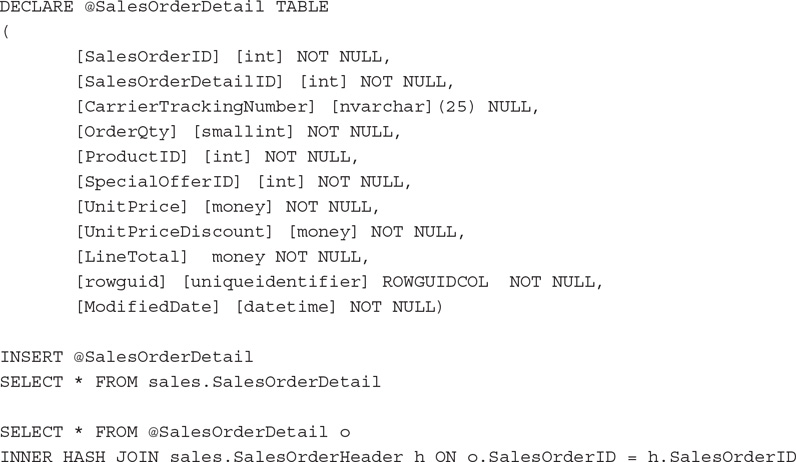
Figure 6-5 shows the created plan.
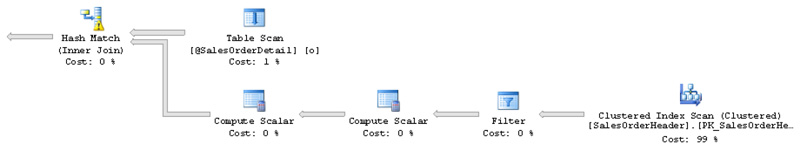
Figure 6-5 Batch mode memory grant feedback plan
Notice the following warning on the hash join operator (you may need to look at the hash join operator properties or hover over the operator in the graphical plan): “Operator used tempdb to spill data during execution with spill level 2 and 1 spilled thread(s).” If you run the query a few more times, the hash join warning may not appear and query execution may be faster. In my system, the duration average went from 10 seconds to 3 seconds.
This was the original memory grant information from the original XML plan:
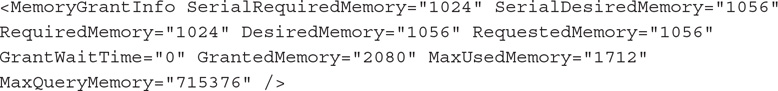
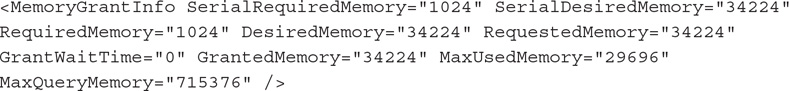
Next is the revised memory grant information later in the same execution plan. As you can see, RequestedMemory and GrantedMemory went from 1056 and 2080, respectively, to 34,224. Values are in kilobytes (KB).
Optionally, you can use some extended events to get more information about how the process works. The spilling_report_to_memory_grant_feedback event will fire when batch mode iterators report spilling to the memory grant feedback process. In my case, the spilled_data_size field showed 6,744,890, which is the spilled data size in bytes.
The memory_grant_updated_by_feedback event occurs when the memory grant is updated by feedback. In my test, the event showed the following values for some of its fields:
history_update_count 2 (number of memory grant updates in update history)
ideal_additional_memory_before_kb 9920 (ideal additional memory grant before update in KB)
ideal_additional_memory_after_kb 21,080 (ideal additional memory grant after update in KB)
Interleaved Execution for Multistatement Table-Value Functions
The previous two algorithms for adaptive query processing work in a different way. One uses a row threshold to decide the join type at runtime, and the second improves the memory grant size based on execution feedback. Interleaved execution for multistatement table-value functions works yet in a different way. I mentioned earlier that traditional query optimization creates a plan and, even if it is based on bad estimates, the created plan is executed anyway. For interleaved execution, the query processor engine will in fact pause query optimization, execute the multistatement table-value function, and use the new accurate cardinality to continue the optimization process. For the current release, interleaved execution works only with multistatement table-value functions, but more constructs will be added in the future.
Let’s start with an example. Create a multistatement table-valued function:
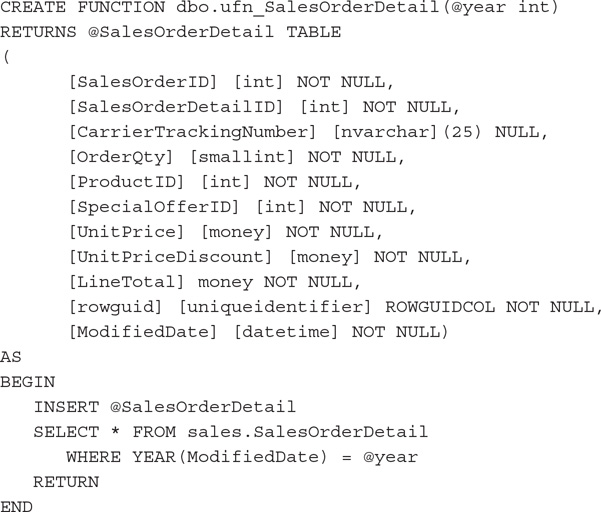
NOTE
This is not the best way to write such a function, but it is good enough to show the concept.
First let us look at the behavior before SQL Server 2017 by changing the database compatibility level to 130:

Now we are ready to run our query:

The resulting execution plan is shown in Figure 6-6.
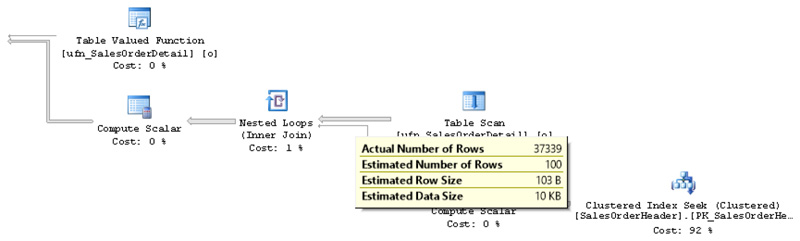
Figure 6-6 Plan without interleaved execution
Notice that, with a default estimated 100 rows from the multistatement table-valued function, the query optimizer decides to use a nested loops join, when in reality there are 37,339 rows. Obviously, in this case, a nested loops join was not the best choice for such a large number of rows, because it was required to execute the inner or bottom input 37,339 times. In addition, this incorrect estimation early in the plan could potentially create many problems, as decisions may be incorrect as data flows in the plan. Performance problems are likely in cases where these rows are used in downstream operations. A related example was shown earlier in the chapter, where a bad estimation on a table variable impacted a memory grant later in the plan.
Let’s switch back the database compatibility level to 140 to test the SQL Server 2017 behavior:

Running the same query again returns the plan shown in Figure 6-7. You can see that it now reflects an accurate cardinality estimate.
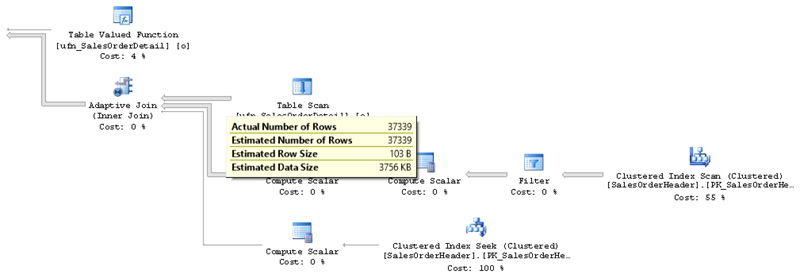
Figure 6-7 Plan using interleaved execution
Since we left the columnstore index created in the previous exercise, we also have an adaptive join. Let’s take a look at an alternative plan that drops the columnstore index:

Now we have the plan shown in Figure 6-8, which also has a correct estimate, but this time using a merge join.
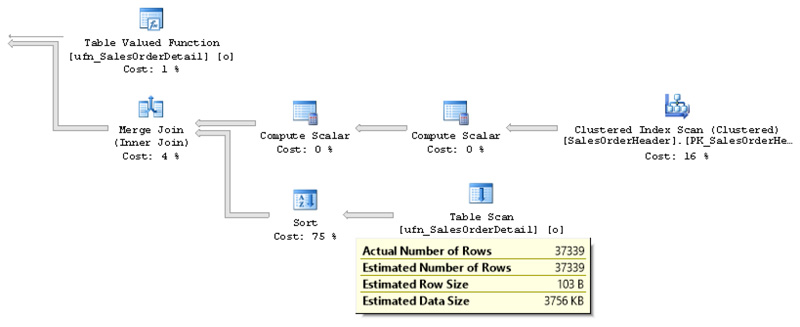
Figure 6-8 Plan using interleaved execution version 2
The extended events interleaved_exec_status and interleaved_exec_status_update can be used to track when interleaved execution is occurring and to track the cardinality estimates updated by it, respectively. In addition, an execution plan can show the properties ContainsInterleavedExecutionCandidates and IsInterleavedExecuted to detect whether there are interleaved execution candidates in the query and if the query was successfully executed, as shown in the following XML fragment example:
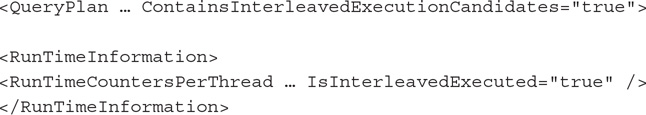
Finally, in the current release, multistatement table-value functions must be read-only and cannot be part of a data modification operation to be candidates for interleaved execution. In addition, they cannot be used inside a CROSS APPLY operator.
Automatic Tuning
Automatic tuning is a new feature, which according to the SQL Server 2017 documentation, is intended to “provide insight into potential query performance problems, recommend solutions, and automatically fix identified problems.” Although this may sound extremely broad and optimistic, and it has created a lot of hype in the SQL Server community, at the moment its only released feature is to help with plan regressions of queries, which were originally performing optimally. No announcements have yet indicated whether it will cover any additional features in a future release, or what those additional features could be. Although automatic tuning’s current benefits are extremely limited, we hope they could be extended in the near future to cover additional query performance problems.
Automatic tuning also has a second feature, automatic index management, which is available only on Azure SQL Database. This feature is intended to automatically create recommended indexes or remove indexes that are no longer used by any query. I do not cover Azure SQL Database in this book, but you can get more details about this feature by looking at the online documentation at https://docs.microsoft.com/en-us/sql/relational-databases/automatic-tuning/automatic-tuning.
Automatic plan regression consists of automatically switching to the last known good plan of a query in case a regression is detected. The database engine will automatically force a recommendation only when the estimated CPU gain is better than 10 seconds, or when both the forced plan is better than the current one and the number of errors in the new plan is higher than the number of errors in the recommended plan. These thresholds currently cannot be changed.
In addition, the automatic plan regression process does not end at forcing that last known good plan, because the database engine continues to monitor the changes and can roll them back if the new plan is not performing better than the replaced plan.
Note that you could also implement this process manually, identifying the query and plan on the query store and running the sp_query_store_force_plan procedure. This process requires that you manually monitor the information on the query store to find the performance regression, locate the last known good plan, apply the required script to force the plan, and continue to monitor the performance of the changes. All of this functionality is available by using the query store, so it can be implemented starting with SQL Server 2016. A disadvantage of this manual process, as hinted, is that you also have to monitor the changes continually to see if they continue to bring performance benefits or otherwise decide to unforce the execution plan.
Finally, note that forcing a plan should be used only as a temporary fix while you look into a permanent solution. Forcing a plan is like a collection of hints, which, as discussed in Chapter 4, basically disables the work of the query optimizer. Finding a permanent solution may require applying standard query tuning techniques.
Let’s try an example to see how the technology works by looking at automatic plan correction. (Automatic index management will not be covered here because it is implemented on Azure SQL Database only.)
Sometimes trying to create a real performance problem with AdventureWorks can be a challenge, because it is a very small database. Although one option could be to create tables with millions of rows, instead I can show the concept using the same scripts I showed in Chapter 5 while demonstrating parameter sniffing. So let’s start by restoring a fresh copy of the AdventureWorks database.
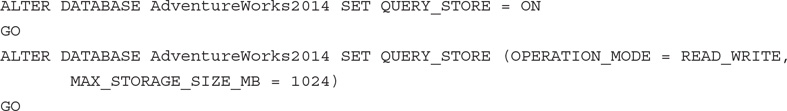
In this case, let’s assume that the desired plan is the one using an index seek and a key lookup, and if we suddenly have a table scan, we can consider it a regression. If you have not already done so, enable the query store on AdventureWorks by running the following statements:
If you already have the query store enabled, you can just run the following statement to purge its data and start clean:

Create the following stored procedure:

Again, for this example, assume the following is the desired or optimal plan, using an index seek/key lookup combination:

Execute it a few more times so it can be captured by the query store:
Performance and plan information about these procedure executions are now recorded in the query store. Now suppose that, for some reason, the plan is evicted from memory and a new nonoptimal plan is created instead. To simulate the plan being removed from memory, you can clear the plan cache for the AdventureWorks database by running the following statement:

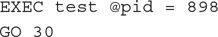
Now run the following version of the stored procedure, which for the specified parameter will create a plan using a table scan:

At this point, we have a bad plan in memory that scans the entire table for any provided parameters. Since most of the provided parameters would return a small number of rows, they would instead benefit from the original plan with the index seek and key lookup operators.
Run the stored procedure again for the parameter returning nine rows:

At this point, the database engine should be able to see the performance regression and make such information available using the sys.dm_db_tuning_recommendations DMV. Running the following statement will return one row (make sure you are connected to the database you want, in this case, AdventureWorks):

The DMV sys.dm_db_tuning_recommendations returns detailed information about tuning recommendations based on the query store. Some of the columns at this point are interesting:
name Unique name of the tuning recommendation. In our case, returned PR_1.
type Type of automatic tuning recommendation. At this point, the only choice available in SQL Server could be FORCE_LAST_GOOD_PLAN.
reason Reason why this recommendation was provided. I got the value “Average query CPU time changed from 0.9ms to 22.26ms,” which means that my index seek plan was using 0.9ms and the regressed plan using a table scan switched to 22.26ms. Once again, this is not a big difference because AdventureWorks is a very small database.
valid_since The first time the tuning recommendation was generated.
last_refresh The last time the tuning recommendation was generated. In our case, they are both the same because it is the first recommendation.
state State of the tuning recommendation as a JSON document. Currently only two fields are available: currentValue, which is the current state of the recommendation, and reason, which is the reason the tuning recommendation is in such a state. My values were

In this case, the meaning of these values is that the recommendation is still active as the automatic tuning feature is not enabled. Later I will show you how to enable it.
Note that JSON (JavaScript Object Notation) is a popular open-standard textual data format used for exchanging data in web and mobile applications. SQL Server provides JSON support starting with SQL Server 2016.
details Details about the tuning recommendation, which is also a JSON document with multiple fields. In this case, you can take a look directly at the details column output or use SQL Server JSON capabilities to extract specific field information. My demo returned the following JSON document:
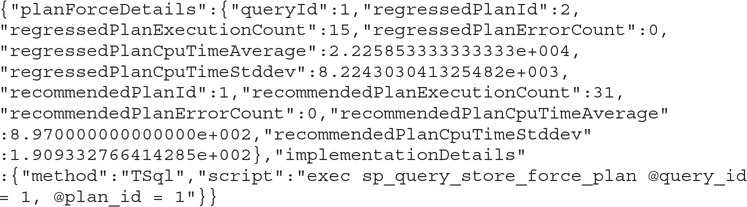
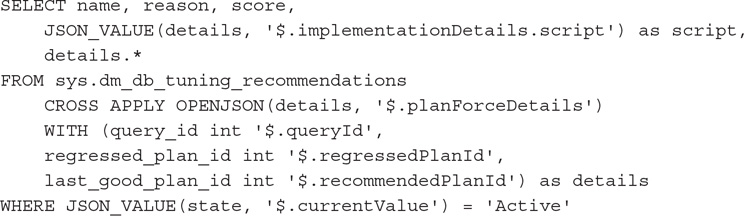
For example, you can use the following script to get some of the details fields, including the script that can be used to force the plan:
NOTE
Running this query requires the use of the SQL Server 2017 compatibility level, so make sure your database is set to COMPATIBILITY_LEVEL 140.
The query returns some of the information discussed earlier, plus the fields <script>, which is the script to execute in case you decide to force a plan manually; <queryId>, which is the query_id of the regressed query; <regressedPlanId>, which is the plan_id of the regressed plan; and <recommendedPlanId>, which is the plan_id of the recommended plan. For this example, my created script was the following, which basically will force the plan with plan_id 1 for the query with query_id 1.

So far I have covered how to force a plan manually. This requires that I manually monitor the information on the query store to find the performance regression, find the last known good plan, apply the required script to force the plan, and continue to monitor the performance of the changes. All of this functionality is available by using the query store, however, so it can be implemented starting with SQL Server 2016. What is new in SQL Server 2017 is the ability to enable the database engine to implement these changes automatically. The sys.dm_db_tuning_recommendations DMV is also new in SQL Server 2017.
In addition, the new sys.database_automatic_tuning_options DMV can help you track the automatic tuning options for a specific database. Run the following statement to inspect the current configuration:

You will get the following output:

To enable the automatic plan regression feature, run the following statement using the new AUTOMATIC_TUNING option and the FORCE_LAST_GOOD_PLAN choice

This changes the sys.database_automatic_tuning_options DMV output as follows:

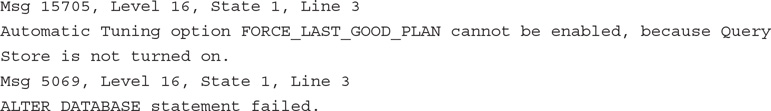
Notice that this automatic tuning option requires the query store. Trying to enable it without the query store will generate the following error message:
Finally, it is important to remember that SQL Server will automatically force a recommendation only where the estimated CPU gain is better than 10 seconds, or both the forced plan is better than the current one and the number of errors in the new plan is higher than the number of errors in the recommended plan. Earlier, I showed how to see the difference in CPU performance information using the reason column of the sys.dm_db_tuning_recommendations DMV. The number of errors is available using the following fields of the details column of the same DMV:
regressedPlanErrorCount Number of errors detected during the execution of the regressed plan
recommendedPlanErrorCount Number of errors detected during the execution of the recommended plan
SQL Server 2016 Service Pack 1
As mentioned, SQL Server 2016 Service Pack 1 brought a consistent programmability surface area for developers across SQL Server editions. Starting with this release, features such as columnstore indexes, In-Memory OLTP, always encrypted, compression, partitioning, database snapshots, row-level security, and dynamic data masking, among others, are now available on all SQL Server editions such as Express, Web, Standard and Enterprise.
SQL Server 2016 Service Pack 1 also brought a variety of new query processing–related features including the following:
CREATE OR ALTER statement New CREATE OR ALTER statement can apply to stored procedures, triggers, user-defined functions, and views.
USE HINT query option New query option provides the ability to enable the behavior of some trace flags at the query level without using QUERYTRACEON and requiring sysadmin credentials.
Ability to programmatically identify whether the Lock Pages in Memory privilege and Instant File initialization are in effect at SQL Server service startup This information is available on the sys.dm_os_sys_info and sys.dm_server_services DMVs, respectively.
Additional diagnostics information on execution plans Information such as top waits, enabled trace flags, and additional performance information is available on execution plans.
New EstimatedRowsRead attribute Attribute can be used to troubleshoot and diagnose query plans with pushdown predicates.
For more details about SQL Server 2016 Service Pack 1, refer to the online article at https://blogs.msdn.microsoft.com/sqlreleaseservices/sql-server-2016-service-pack-1-sp1-released/.
USE HINT Query Option
Available for the first time in SQL Server 2016 Service Pack 1, the new USE HINT query option remains a highly unknown feature. USE HINT can be used to get the behavior of some trace flags at the query level without using the QUERYTRACEON hint. As you may know, the QUERYTRACEON hint lets you enable a plan-affecting trace flags for a single-query compilation.
A problem with using some of this functionality in the past is that QUERYTRACEON was only partially documented and required sysadmin privileges. By partially documented, I mean that you could use a large number of trace flags with QUERYTRACEON, but only a small portion was supported and documented. Using USE HINT, you can alter the query optimizer behavior by using any of the supported query hints listed in Table 6-1 without requiring sysadmin permissions. Table 6-1 lists the new hint names, the trace flag that provides a similar behavior, and, if available, the database option that can provide the same behavior at the database level.
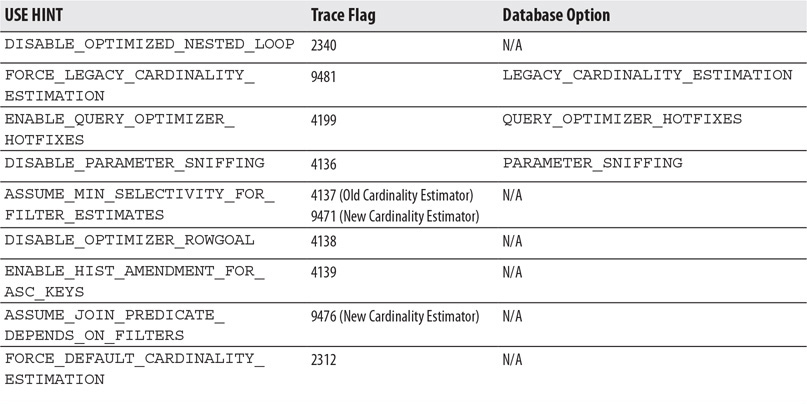
Table 6-1 Hint Names
NOTE
A list of supported QUERYTRACEON trace flags is available at https://support.microsoft.com/en-us/help/2801413/enable-plan-affecting-sql-server-query-optimizer-behavior-that-can-be.
The following hint names are supported:
DISABLE_OPTIMIZED_NESTED_LOOP Disables a batch sort operation for optimized nested loops joins.
FORCE_LEGACY_CARDINALITY_ESTIMATION Enables the old cardinality estimator when a performance regression has been found.
ENABLE_QUERY_OPTIMIZER_HOTFIXES Enables query optimizer hotfixes released on service packs and cumulative updates.
DISABLE_PARAMETER_SNIFFING Disables parameter sniffing.
ASSUME_MIN_SELECTIVITY_FOR_FILTER_ESTIMATES Creates execution plans using minimum selectivity when estimating AND predicates for filters to account for correlation.
ASSUME_JOIN_PREDICATE_DEPENDS_ON_FILTERS Creates execution plans using the simple containment assumption instead of the default base containment assumption for joins on the old cardinality estimator.
ENABLE_HIST_AMENDMENT_FOR_ASC_KEYS Enables automatically generated quick statistics for any leading index column for which a cardinality estimation is needed.
DISABLE_OPTIMIZER_ROWGOAL Creates execution plans that do not use row goal adjustments with queries that contain TOP, IN, EXISTS, or OPTION (FAST N) keywords.
FORCE_DEFAULT_CARDINALITY_ESTIMATION Enables the new cardinality estimator where the database is configured to use the old cardinality estimator.
Let’s take a look at a couple of examples. First of all, run the following query not as a system administrator:

Trying to run the query without sysadmin permissions will produce the following error message:

However, the following statement results in exactly the same behavior without the need of sysadmin credentials:

Following on our parameter sniffing example in Chapter 4 and earlier in this chapter, create the test stored procedure:
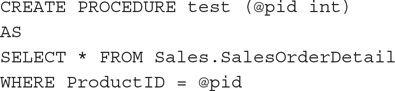
Running the procedure with the following parameter will get an estimated nine rows and a plan using an index seek and a key lookup operator. This execution uses parameter sniffing to inspect the value of the passed parameter and estimates the number of returned rows using the histogram of the statistics object (as covered in Chapter 5):

As you saw in Chapter 5, in a limited number of cases, we may want to disable parameter sniffing. We can accomplish this in different ways, including using trace flag 4136, as shown next. Remember that using QUERYTRACEON hint requires working with sysadmin privileges again.
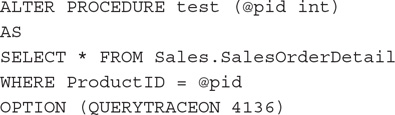
In this case, running the test stored procedure as before will get an estimation of 456.079 and a new plan using a table scan.
NOTE
Chapter 5 also covered using the OPTIMIZE FOR UNKNOWN hint to obtain exactly the same behavior.
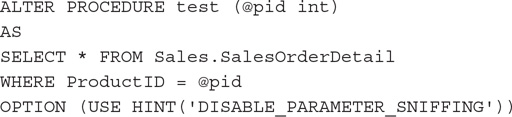
The following example will produce exactly the same behavior using the DISABLE_PARAMETER_SNIFFING hint name without requiring elevated privileges:
There is also a DMV, sys.dm_exec_valid_use_hints, which returns the supported USE HINT hint names:

SQL Server 2017 returns the following hint names, which are also listed in Table 6-1:
DISABLE_OPTIMIZED_NESTED_LOOP
FORCE_LEGACY_CARDINALITY_ESTIMATION
ENABLE_QUERY_OPTIMIZER_HOTFIXES
DISABLE_PARAMETER_SNIFFING
ASSUME_MIN_SELECTIVITY_FOR_FILTER_ESTIMATES
ASSUME_JOIN_PREDICATE_DEPENDS_ON_FILTERS
ENABLE_HIST_AMENDMENT_FOR_ASC_KEYS
DISABLE_OPTIMIZER_ROWGOAL
FORCE_DEFAULT_CARDINALITY_ESTIMATION
Finally, Table 6-1 also covered three database scoped configuration options that you can use to get the same behavior as the trace flag or name hint but at the database level. For example, to disable parameter sniffing at the database level, you could run the following statement:

Now you can run the original version of our test stored procedure and get the behavior of parameter sniffing disabled without any hint:
Running the procedure will get the estimate of 456.079 and the plan using a table scan. Don’t forget to enable parameter sniffing again if you tried the previous examples:

NOTE
It is also possible to disable parameter sniffing at the server level, enabling the trace flag 4136 mentioned earlier for the entire SQL Server instance. Keep in mind, however, that doing this at the server level may be an extreme solution and should be tested carefully.
CXPACKET and CXCONSUMER Waits
SQL Server can use parallelism to help some expensive queries execute faster by using several logical processors simultaneously. However, even if a query gets better performance by using parallel plans, it may still use more resources than a similar serial plan. Parallel plans may show CXPACKET waits, also called parallel processing waits. Having these waits does not necessarily mean that there is a problem, and, unfortunately, some wrong advice online shows otherwise, which sometimes gives parallelism a bad reputation. As a consequence, a bad reaction to this wait type can be to disable parallelism. The reality is that we may need to do additional research to see if, in fact, parallelism is the problem. Traditionally, to troubleshoot CXPACKET waits, we should start by looking at the waits on the additional child parallel threads.
Starting with SQL Server 2017 Cumulative Update 3 (and SQL Server 2016 Service Pack 2), Microsoft is planning to split parallelism CXPACKET waits into two different waits: CXPACKET and CXCONSUMER, which will allow easier troubleshooting.
The concept of the change is basically the separation between producer waits and consumer waits. In parallel operations, producers push data to consumers, and these are the waits that require attention. Consumers may simply have to wait for data from the producers, so a delay on the producers will impact them as well. Starting with this SQL Server change, producer waits will be reported as CXPACKET waits and consumer waits as CXCONSUMER waits. CXPACKET waits will be the actionable waits, and you will not have to worry much about the CXCONSUMER waits. As with any other waits, they will be visible on the usual places such as the sys.dm_os_wait_stats or the sys.dm_exec_session_wait_stats DMVs.
NOTE
SQL Server 2017 Cumulative Update 3 was not yet available at the time of this writing, although according to the announcement, CXPACKET and CXCONSUMER waits are already implemented on Azure SQL Database.
Wait Statistics on Execution Plans
Another very interesting recent development is the ability to see wait statistics on an actual execution plan, a feature that was also released with SQL Server 2016 Service Pack 1. The information is limited to the top 10 waits, and most common sleep and idle waits are not included in the plan.
You can try one of the queries we used earlier in this chapter while requesting the actual execution plan:

You can see the information in the WaitStats section of the graphical plan. Next is an XML fragment of the same information I got on my test execution:
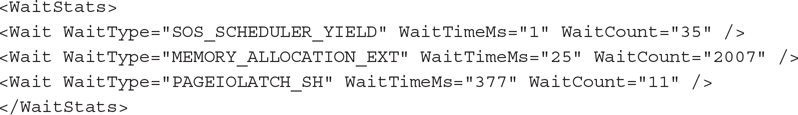
The information shows the wait type, the wait time in milliseconds, and the wait count or times the wait occurred for the duration of the query.
Finally, there was been some discussion on the SQL Server community and a Microsoft connect request was submitted indicating that not all the important waits are reported on the execution plan. The request is still open, and you can read the details online at connect.microsoft.com/SQLServer/feedback/details/3137948.
Recent Announcements
Another of the major changes in SQL Server 2017 is the new servicing model. Although service packs will still be used for SQL Server 2016 and previous supported versions, no more service packs will be released for SQL Server 2017 and later. The new servicing model will be based on cumulative updates (and General Distribution Releases, or GDRs, when required).
Cumulative updates will be released more often at first and then less frequently in the new servicing model. A cumulative update will be available every month for the first 12 months and every quarter for the remainder 4 years of the full 5-year mainstream lifecycle. You can read more details about the new servicing model online at https://blogs.msdn.microsoft.com/sqlreleaseservices/announcing-the-modern-servicing-model-for-sql-server/.
Finally, as of this writing, there have been a few new releases and announcements coming in SQL Server. First, SQL Operations Studio is available for preview. SQL Operations Studio is a new tool for database development and operations intended to work with SQL Server on Windows, Linux and Docker, Azure SQL Database, and Azure SQL Data Warehouse. SQL Operations Studio can run on Windows, Mac, or Linux operating systems. For more details and to download, visit https://blogs.technet.microsoft.com/dataplatforminsider/2017/11/15/announcing-sql-operations-studio-for-preview/.
Microsoft also recently announced some improvements to the database engine, which will be included in a future release:
Table variable deferred compilation This feature would help to get better cardinality estimation for table variables, instead of the default fixed estimate of 100.
Batch mode for row store Batch mode execution, as introduced with SQL Server 2012, has been available only for the columnstore indexes technology.
Scalar UDF inlining This feature will provide better performance for scalar user-defined functions.
Adaptive query processing row mode memory grant feedback As explained earlier, this would be the adaptive query processing memory grant feedback for rowstores.
Summary
This chapter covered what is new in query processing in SQL Server 2017, and it also included some SQL Server 2016 features released recently. The most important query processing innovations on SQL Server 2017 are adaptive query processing and automatic tuning.
Adaptive query processing is a very promising collection of features that for the current release include three algorithms: batch mode adaptive joins, batch mode adaptive memory grant feedback, and interleaved execution for multistatement table-valued functions. A future feature, adaptive query processing row mode memory grant feedback, has been announced as well.
Automatic tuning is also a new collection of features that seems to be in its infancy, with only one feature available in SQL Server—automatic plan correction—plus another one, automatic index management, available only on Azure SQL Database.
The chapter also covered a few SQL Server 2016 Service Pack 1 enhancements. This service pack change indicated the first time in the history of SQL Server in which a consistent programmability surface area was available for developers across SQL Server editions. Starting with this groundbreaking release, features such as columnstore indexes and In-Memory OLTP, among others, are now available for all editions of SQL Server.