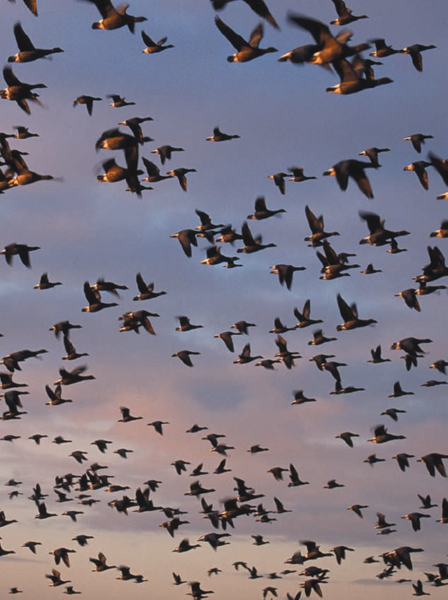
POPULATION DYNAMICS CONCERNS the fluctuating size and composition of any given population of animals or plants in space and time, and the factors that regulate these changes. There are four key issues that are part of the regulatory process, and in the case of wildfowl these can be defined as follows: recruitment refers to the number of birds born into the population and departing from the breeding grounds in good condition; mortality means the number of birds dying in the population; immigration is the number of birds arriving into the population from another geographic area; and emigration is the number of birds moving out of the population and going elsewhere (Fig. 125).
In a stable population the mortality rate is balanced by the number of births, rather than the other way around as formerly thought. If recruitment exceeds mortality then the population will increase. Conversely, if mortality exceeds recruitment the population declines. The mechanisms that control these processes are extremely complex, often not well understood, despite more information being available on wildfowl populations than for most other groups of animals.
For long-lived birds such as swans and geese, small shifts in adult survival rates have a far greater impact in reducing or increasing numbers in a population than a decline or increase of breeding success. Because of this, the impact of shooting and hunting as a key regulator of numbers has long been debated. One school of thought claims that shooting is a form of compensatory mortality, taking out mainly immatures, inexperienced adults, the weak and the sick that would have died anyway under natural circumstances. If this were not the case, and shooting of a particular species ceased, then numbers in that population should increase. In such cases shooting is an additive form of mortality. Evidence to support additive mortality is provided by the numerical performance of several different populations of geese. The Svalbard population of barnacle geese wintering on the Solway Firth numbered some 300 birds in the late 1940s. The geese were partly protected from shooting in the UK from 1954 and in Svalbard the next year, and the Caerlaverock National Nature Reserve was established three years later. Shooting in Norway and Svalbard was prohibited in 1961/62. The population responded by steadily increasing each year to reach 29,815 birds counted in the Solway Firth in November 2007.1 This dramatic population growth was due to reduced adult mortality following the shooting ban rather than to any change in the recruitment rate.2 The Greenland white-fronted goose population responded in a similar manner. In 1982 there were some 16,000-17,000 birds in the population. Shooting moratoria were introduced in Scotland (1981) and Ireland (1982), and by the spring of 1999 numbers had more than doubled to 35,573 birds, a direct response to the decline in adult mortality brought about by the cessation of shooting. Adult mortality rates were high, at 30-40 per cent in the 1940s and 1950s,3 compared with 21.5 per cent today (2002).4 However, since peaking in 1999 numbers have declined to 24,804 birds in spring 2006, almost certainly due to reduced breeding success rather than increased mortality rates.

FIG 125. Dark-bellied brant geese, Langstone Harbour, Hampshire. The number of birds in the population is regulated by recruitment, mortality, immigration and emigration. This is a classic ‘boom or bust’ species, with wild swings of productivity ranging from total breeding failure some years to over 50 per cent young birds in the winter flocks in other years. (Guy Edwardes/NHPA)
Swans and geese respond markedly to small shifts in adult mortality rates because of their biological and demographic characteristics – they are long-lived, have delayed sexual maturity, and generally lay small clutches of eggs. In many species only a small proportion of adults breed successfully in any given year, so that the number of young in the autumn flocks may comprise 5-10 per cent of the population. Ducks, on the other hand, especially the dabbling ducks, are shorter-lived, breed generally the year after hatching, and lay large clutches and produce large numbers of young – which may comprise up to 50 per cent of the autumn population. Thus the impact of shooting as a factor elevating adult mortality rates is quite different in ducks compared with geese and swans, because of the different biological characteristics.
Natural populations are frequently held in check by the availability of a particular resource, generally food. As a population increases, the numbers of individuals begin to exceed the capacity of the resource. Increased mortality occurs, disproportionately among young birds, with the result that fewer are recruited into the breeding population and numbers then decline if mortality rates exceed recruitment levels. This type of mortality is density-dependent, severest when numbers are highest and least when numbers are low. Immigration and emigration to and from the population from other geographically separated populations can provide some alleviation, but these options are much reduced if the population is already occupying its entire available habitat.
In order to better understand the way the four basic factors control population dynamics one needs to know more about the underlying issues that affect recruitment and mortality rates, as well as those that have an effect on the movements of birds in and out of the population.
Within the lifetime of a swan, goose or duck there are critical moments when the birds need to successfully complete certain actions to enable them to reproduce successfully, to survive and avoid mortality – body conditioning of females in late spring; spring migration; incubation, hatching and early chick care; post-breeding moult; autumn migration. Within this overarching framework there are more specific factors affecting both recruitment and mortality.
In a recent review of wildfowl population dynamics, Tony Fox identified eight key factors affecting recruitment and eight affecting mortality.5
Geese and swans have evolved strategies for the management of their body reserves for successful breeding that are very different from those of the dabbling ducks. They arrive in their Arctic breeding grounds stocked up with accumulated fats and proteins, built up during the final three or four weeks feeding on the wintering grounds prior to migrating northwards. The reserves are topped up on the spring staging areas. Female geese do not generally feed on arrival in the breeding grounds, although there is evidence that some – the lesser snow goose in Canada and the Greenland white-fronted goose in west Greenland – feed intensively on arrival to boost their protein and fat reserves.6 Most female geese and swans mobilise energy from their stored reserves for egg production (which is a large physiological drain on body reserves – the weight of an average clutch of greylag, pink-footed and barnacle goose eggs represents 30.6, 23.5 and 26.5 per cent of body weight respectively) and for incubation and care of the young to fledging. Hence geese and wild swans are known as ‘capital breeders’, as they draw down on accumulated reserves. The energy demands on breeding female geese are such that by the end of incubation a female lesser snow goose may have lost up to 40 per cent of the body weight she had on arrival in the breeding grounds, while the male loses up to 20 per cent of his arrival weight.7 Similar results have been recorded for barnacle geese.8 Goose and swan eggs are large in relation to their body size and are loaded with a high-energy content, providing a ‘kick-start’ for the young, which leave the nest often within a few hours of hatching. Numerous studies have shown positive correlations between good female body condition – evaluated visually by differing abdominal profiles – at the end of the winter period and successful breeding, something that poultry and duck/goose farmers have known for centuries.
Most ducks, in contrast to geese and swans, build up their body condition on or near the breeding grounds, the females indulging in binge feeding during egg laying. They are thus known as ‘income breeders’. The nidifugous ducklings depend more on immediately available food – generally chironomid midge larvae – than on accumulated reserves in the egg. The breeding success of most dabbling ducks is very much tied to the availability and abundance of midges and other insects just before, during and after hatching of the ducklings.
Heavy loads of parasites – generally feather lice (Fig. 126), feather mites or internal parasites (helminths) – can affect body condition of females and hence their breeding success. Similarly, heavy infestations of parasites on young birds, transferred from their mother, can affect their survival. There is little or no information on the impact of parasites on the breeding success of swans, geese and ducks. This may suggest that parasite loading is not a problem. Indeed, it is rather unusual to come across adult geese carrying heavy infestations of feather lice, possibly because if the infestation was too high the bird would die in a short time and not be recorded. During the ringing of approximately 900 adult and juvenile barnacle geese in the Inishkea Islands, Co. Mayo, between 1961 and 2009, I came across only three geese with excessive burdens of lice. All were emaciated and significantly below average weight. One adult female caught in early February weighed only 1.45 kg (average of ten other females caught at the same time was 1.7 kg) and was found dead on the islands about a month later. In 1985 and 1987 we caught almost 800 adult, yearling and juvenile geese on the breeding grounds in northeast Greenland, and none was infested with excessive numbers of lice or carrying a heavy burden of feather mites.
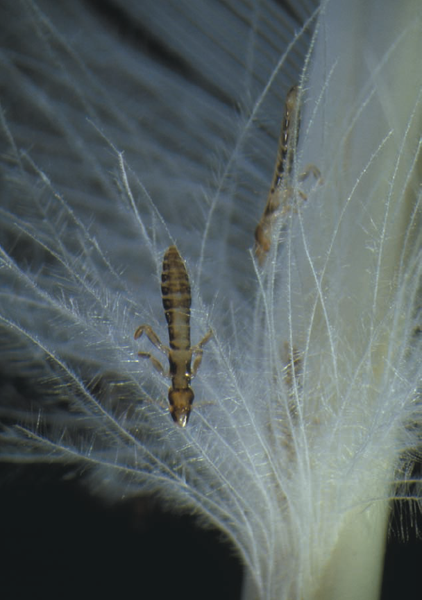
FIG 126. Feather louse, Anaticola sp., on the feather of a duck. These lice have a remarkable capacity for hanging on to a feather and are extremely difficult to dislodge. (Image Quest 3-D/ NHPA)
Most wildfowl are monogamous, ducks generally for one season only, but geese and swans more often for life. Typically the male duck deserts the female once laying commences, playing no further role in nest protection or rearing the young. Clearly the performance of her mate has no role to play in the breeding success of the duck. On the other hand the male goose or swan makes a positive contribution to the breeding performance of the pair, participating in nest protection, brood rearing and defence of the family during autumn migration as well as during the winter period. Paired geese are more successful in obtaining better feeding on the wintering grounds and hence facilitating the body-conditioning of the female, essential to her subsequent successful breeding in the Arctic. If there was no advantage to breeding success then there would be a higher level of divorce among geese or swans.
Bad weather will affect the growth and availability of food on the wintering grounds and spring staging sites for geese and swans, preventing the birds from building up their necessary body reserves. Adverse weather conditions may also result in non-breeding seasons for many Arctic geese – delayed snow-melt rendering nesting sites unavailable, or severe weather coinciding with the onset of egg laying, preventing laying or destroying the eggs. In wetlands, drought will affect the productivity of the insects that are essential for successful breeding by dabbling duck, both at the time of laying and for the subsequent survival of young ducklings.
Wildfowl are viewed by predators as hefty chunks of tasty meat, and their large, often numerous eggs are rewarding targets for polar bears, arctic foxes, arctic skuas, gyrfalcons, glaucous gulls and ravens in the Arctic. In temperate regions the red fox, mink, raven, other corvids and various gull species are the principal predators. Nest losses to predators can be considerable; for example 74 per cent of light-bellied brant goose nests in Svalbard were predated by polar bears.9
The threat of nest predation is underscored by the large number of anti-predator breeding strategies adopted – some geese nesting on vertical cliffs, others on islands, several duck species in tree holes and others hidden in vegetation. Some ducks, such as eiders, sit tight in protective concealment, hoping the predator will overlook them, only bursting from cover at the very last moment (Fig. 127). Other wildfowl have developed nesting relationships with birds of prey, breeding close to gyrfalcons (barnacle geese) or to rough-legged buzzards, peregrine falcons and snowy owls (red-breasted geese). The birds of prey afford anti-predator protection to the geese (especially against arctic foxes) while the geese alert the birds of prey to approaching predators. Some highly dense colonies of geese benefit from predator swamping, minimising damage caused by predators.
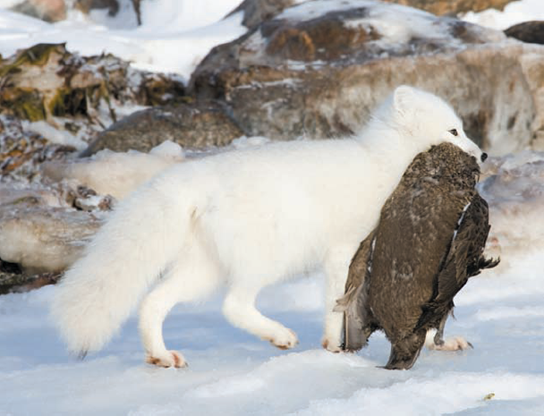
FIG 127. Arctic Foxes are significant predators of Arctic-breeding wildfowl, such as this female common eider. (Anna Henly/NHPA)
Breeding success in geese increases with age, and the most productive period for female geese is generally between the ages of 7 and 12 years – though after that it starts to decline. Evidence from various duck species is similar, but with earlier peaks in productivity. The age and experience of the male in the defence of the territory, nest site and young is also a factor in breeding success.
There is some evidence that the Icelandic breeding populations of greylag and pink-footed geese, and the Svalbard barnacle geese, may at times suffer from a lack of suitable nesting sites and brood-rearing areas, as indicated by an increasing proportion of unsuccessful breeding adults (breeding birds currently make up less than 10 per cent of the Svalbard barnacle goose population, whereas 50 years ago it was closer to 40 per cent).10 On the other hand the availability of nesting sites and brood-rearing areas for barnacle geese in northeast Greenland does not appear to be a restricting factor for the breeding success of the population. However, there is increasing competition for food on the moulting grounds between barnacle and pink-footed geese.
It is difficult to unravel the significance of each of these eight factors in the process of recruitment of Arctic-nesting geese, and even more difficult for ducks. It is likely, however, that good body condition of arriving geese and swans in the Arctic breeding grounds is a prerequiste for successful breeding. After their arrival, weather conditions, such as delayed snow-melt, may possibly be the main factor controlling breeding success. Losses during the egg stage due to poor nest protection by the adults are a further major cause of reduced productivity.11
With regard to factors affecting mortality, the following are considered significant:
As mentioned earlier, predation of adults of breeding age has a far greater impact on wildfowl populations than the loss by predation of eggs and young. The latter is extremely variable, depending upon the location of nest sites and the abundance of predators. Depending upon nest cover and the number of predators the loss of eggs and/or the mortality of young can be as high as 100 per cent in many cases. Mortality among Arctic-nesting geese can be influenced by the abundance of alternative prey for the predators. For example, a correlation has been demonstrated between nesting success of brant geese and the abundance or lack of abundance of rodents on the breeding grounds. The geese bred successfully in years with an abundance of rodents, and unsuccessfully when rodents were scarce. When lemmings are hard to find, the principal predators, arctic fox and pomarine skua, switch their attention from their normal lemming prey to the eggs and young of the geese. These predator/prey swings are thought to be responsible for the large variations in productivity noticed on the wintering grounds, where the proportion of young birds in the winter flocks can vary from 0 to 50 per cent.12
Food availability can be a critical matter at certain periods of the year. During February-March most wildfowl experience their lowest body weights, and their fat reserves are much reduced. During the winter 1999-2000 there was a massive mortality of an estimated 21,000 common eiders – the highest figure recorded since 1980 – in the Dutch Wadden Sea, and lower numbers dead in the German Wadden Sea, with mortality peaking in March/April. The wintering population was approximately 120,000. Adults made up about one-third of all dead birds, and of these about one-third were females. Investigations revealed that the birds could not survive an infection carried by a regularly occurring intestinal parasite, the thorny-headed intestinal worm Profilicollis botulus, contracted principally by eating its intermediate host, the shore crab. It was concluded that food shortages were responsible, and it was hypothesised that overfishing of cockles and mussels – principal food of the eiders – in the Wadden Sea in the early 1990s had reduced the food resources.13 Other possible causes of mortality were examined – oil pollution, poisoning with contaminants, viral or bacterial infection, and immune system deficiency – and were ruled out.14 While this was a dramatic incident, there are many other cases on a much smaller scale of starvation due to lack of food during extreme weather conditions.
Female geese can starve to death if they had been unable to build up enough body reserves to carry themselves through the Arctic incubation period. Food shortages at other critical points in wildfowl life cycles can also lead to elevated mortality rates. For example, if wildfowl are unable to accumulate enough fat prior to the southward autumnal migration then these birds are at greater risk of dying than the birds that were able to accumulate the full complement. The losses of young barnacle geese on autumn migration from Svalbard to the Solway Firth in 1986 were unusually high, at 35 per cent, because of high densities of the geese on their staging grounds, where there were inadequate food supplies.15
Weather can have direct or indirect impacts on mortality. Cataclysmic events such as tornadoes or violent storms will directly kill wildfowl, but its most important role is in controlling the production of food, critical to the survival of the birds. Wildfowl that breed in the Arctic Circle migrate south after the breeding season to escape sub-zero temperatures. Large population shifts of these birds, when in the more temperate latitudes of Europe, occur when temperatures there drop below zero Celsius as waters freeze up and food becomes unavailable. If low temperatures persist, as in the winters of 1946/47 and 1962/63, significant mortalities of adult birds occur that impact the breeding populations the following summer. Differing mortalities among wildfowl will occur – those with big bodies and large fat reserves can endure longer than the smaller wildfowl. Specialist feeders such as the dabbling duck, and especially Eurasian teal, can be hardest hit when their feeding wetlands are frozen over for long periods. As they can only withstand three or four days without food they often undertake spectacular migrations in search of new feeding grounds.
Results from the satellite-tracking of adult swans and geese travelling north and south between their Arctic breeding grounds and Britain and Ireland have shown that some birds can be affected by strong winds, getting blown off course and disappearing, suggesting that the bird had perished. Such a bird could be alone or part of a flock travelling with it. It is impossible to quantify the extent of this weather-related mortality on migration, but we know it does happen.
There is little evidence to show that parasites directly cause significant mortality among wildfowl. Their indirect impact could be of greater significance in lowering the host’s tolerance to food shortages, adverse weather and other stress factors – which are more easily handled by the bird if it is in good health, as was probably the case with the mass mortality of eiders mentioned above. However, as with mortality due to adverse weather on migration, the evidence of death or impairment by parasites is extremely hard to gather because birds can die in remote areas or fall into the sea.
Bacterial, viral and fungal diseases can cause dramatic large-scale mortalities. In North America, the bacterium responsible for avian cholera killed up to one-third of all ducks concentrated in shallow lakes of the Texas Panhandle area during 1949/50. The smaller wildfowl, especially the green-winged teal, were more susceptible than larger species such as Canada geese.16 Large mortalities of waterfowl have been caused by the indirect toxic effects of botulism (ingestion of the neurotoxin produced by the bacterium Clostridium botulinum) in North America, where up to 4-5 million ducks have perished. Duck plague is an acute, highly contagious herpesvirus disease of ducks, geese and swans. Avian influenza and duck plague (duck viral enteritis or DVE) are also deadly to waterfowl populations. Again in North America, the 1973 duck plague outbreak at the Lake Andes National Wildlife Refuge in South Dakota killed an estimated 40 per cent of 100,000 mallard and 3 per cent of 9,000 Canada geese wintering on the refuge and the nearby Missouri River. The outbreak was the first major epizootic of this disease ever reported in free-flying wild waterfowl.
The impact of disease on waterfowl populations appears to have been more pronounced in North America, where densities of populations are often much higher than in Europe. Similar to the questions concerning the role of parasites affecting mortality, the long-term impacts of disease on populations are unclear.
The long-term impact of shooting on wildfowl populations is difficult to determine (Fig. 128). For small populations such as the Greenland white-fronted goose and the Svalbard barnacle goose population the banning of shooting was marked by substantial population increases. For the larger duck populations it is difficult to disentangle the impacts of shooting and other factors that may influence population dynamics. The German anti-hunting group Komittee gegen den Vogelmord has estimated that the 650,000 shotgun licence holders registered in Great Britain shoot approximately 16,000 pink-footed geese, 16,000 greylag geese, 25,000 Canada geese, 527,000 Eurasian wigeon, 212,000 Eurasian teal, 200,000 mallard, 105,000 tufted duck, 101,000 common pochard, 40,000 northern pintail, 18,000 gadwall and 12,000 northern shoveler each year.17 Added to these figures should be those birds that were not killed directly but ‘crippled’, leading to their reduced survival – which in some cases can result in an additional 20 per cent mortality. Large wildfowl such as geese and swans, which have a particularly high wing loading, lack the quick manoeuvrability of the small ducks, and find it harder to avoid collisions with man-made structures – which can be responsible for heightened levels of mortality. For example, in 1967 Malcolm Ogilvie showed that over half the mortality in mute swans in Britain was due to collision with overhead power lines, while human-induced mortality accounted for 85 per cent of all mute swan deaths.18
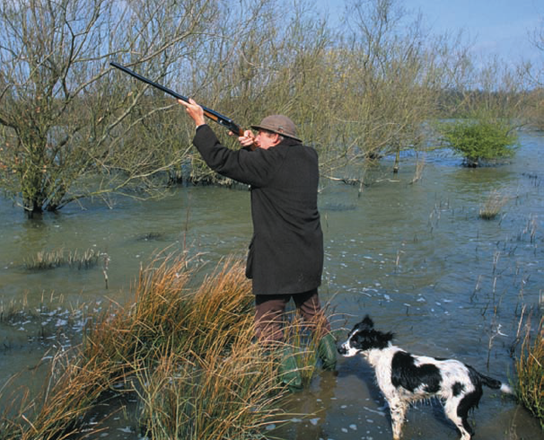
FIG 128. Wildfowler in Kent, midwinter. Mortality of breeding adults is of far greater significance to the population dynamics of wildfowl than the loss of first-winter birds from shooting. (David Tipling/NHPA)
For years there has been a circular argument about the impact of mortality inflicted by shooting, as mentioned at the beginning of this chapter. Many argue that shooting is a form of compensatory mortality, and that the birds shot would have been destined to die anyway from sickness or disease. Moreover, the removal of birds from a population by shooting would reduce competition for an essential resource such as food in winter and thereby assist a higher survival of birds than if population numbers were higher. If this shooting mortality was below a certain threshold then there would be no long-term impacts on the population. If shooting mortality was high this would be additive mortality, on top of the naturally occurring mortality, and the population would decline. The argument for compensatory mortality is dependent upon a linkage between natural mortality and population size. Thus such mortality becomes density-dependent.
When wildfowl populations are controlled by density-dependent factors, with a large annual production of young birds, then the surplus birds can be harvested by shooting. Many wildfowl studies, especially concerning ducks, have shown that when the populations are shot there is reduced natural mortality in the population. However, for the larger and Arctic-based breeding geese the contrary is probably true. Their low and relatively constant level of natural mortality does not provide much room for compensatory mortality when the population is shot.
The greater snow goose in North America is among the most numerous of all geese in the world, with a population size of 7.56 million birds. A study of survival rates and population dynamics over a 30-year period (1970-98) concluded that hunting mortality had the most important impact on population dynamics, and in the absence of density-dependent effects hunting could be used to limit the growth of this population. During the study the population increased tenfold. This growth could not be explained by changes in reproductive rates, which were similar over the three decades – overall mean of 26 ± 3 per cent young in autumn flocks – with no evidence of density-dependent effects. Adult survival did not differ between the periods of rapid population increase and those when there was no population growth. Adult harvest rates were much higher during the period of no population growth than before or after. Reduced survival due to increased hunting mortality is thought to have brought about stagnation of population growth.19
Young and inexperienced wildfowl suffer a higher mortality rate than adults. In the case of a long-lived species such as the mute swan, fledged young in their first year of life endure a 59 per cent mortality, reducing to 32 per cent in their second year and further declining to 20 per cent for adult birds.20 Very little of this mortality is caused by hunting. For quarry species proportionately larger numbers of young birds are shot than adults due to their need to disperse more widely in search of food. For larger wildfowl such as the snow goose, mortality during their first year from shooting was 59 per cent, compared with 25 per cent among older geese.21 Interestingly, in the case of protected populations of geese, such as the Svalbard population of barnacle geese, the difference between first-year and adult mortality rates is much less.22 Finally, young birds suffer higher mortality during hard weather conditions or during food shortages.
Immigration and emigration are the two other major processes in population dynamics. To a certain degree they provide elasticity to populations. When the number of birds in any one population increases to exceed the carrying capacity of, say, food resources or nest-site availability, then emigration can reduce pressure on these resources, with birds moving to another geographically separated population of the same species. Conversely, immigrants can arrive to join a declining population from one that is being overshot or is suffering from resource depletion. In general there is little immigration or emigration among goose and swan populations, and they often appear to be closed and quite discrete. The situation among ducks is less clear but almost certainly involves higher levels of both immigration and emigration.
Ornithologists, in common with many other field biologists working on population dynamics, are repeatedly tormented by uncertainties – how precise are the data, and do they reflect accurately what is going on within the population? For example, has the total population been counted accurately? Are the methods used to calculate mortality and survival rates producing dependable results? Is there sufficient information on the movements and migrations of individuals in and out of the population? How closed or open is the population? To what extent are productivity data, such as the number of first-winter birds in the wintering flocks of wildfowl, skewed by the non-random mixing of birds? Is the sampling extensive enough? What about observer bias? What are the best times for annual population assessments, and for determination of breeding success and the proportion of first-winter birds?
Good estimates of the total number of individuals in a population, particularly for the larger wildfowl such as the swans and geese, are now available thanks to extensive networks of amateur and professional ornithologists, international cooperation and the use of aerial surveys. During the winter wildfowl are generally to be found in specific and well-known sites, enabling entire populations to be censused simultaneously, either by coordinated ground counts or by aerial census, or a combination of both. More problematic is obtaining reliable estimates during the breeding season, when the birds are usually thinly spread out over vast geographic areas. Estimates of breeding populations that extend over such huge areas can be made by aerial-survey random transects, verified by ground truthing, the results from which can then be extrapolated for the whole breeding habitat.
Studies on breeding biology, carried out often in remote places difficult of access, are needed to determine the factors affecting birth rates and productivity. Some of the key factors that require to be established are the pre-breeding condition of birds, especially nesting females; weather conditions on the breeding grounds; competition for nesting sites; predation of nests; hatching success; mortality and survival rates of chicks before and after leaving the nest but prior to fledging; nesting success (proportion of nests raising at least one chick); competition among young birds for food during the period of rapid growth to fledging. As the availability and quality of food are key factors in density-dependent population regulation, studies are also required on the feeding ecology and activity budgets of young and adult wildfowl, not only on the breeding grounds but also in the autumn and spring staging locations, as well as on the wintering grounds.
A long-established method of estimating the summer’s breeding success or productivity among geese and swans, without expending large budgets on travelling to the breeding grounds, is to record the numbers of adults and firstwinter birds, identified by plumage differences, in randomly selected sample units of 50 birds in the wintering flocks. The proportion of first-winter birds, expressed as a percentage of all birds in the population, indicates breeding success that summer. The reliability of these sample counts is based on the assumption of random mixing of the whole population throughout its wintering range and the random distribution of families throughout the flocks, assumptions known to be flawed. For example, families of geese are more frequently found on the edges of flocks; there is a higher proportion of successful families among the first flocks of geese to arrive on their wintering grounds in the autumn; successful families tend to disengage themselves from the main wintering flocks at the back end of the winter, when food shortages occur in certain habitats, to seek better feeding grounds elsewhere. Mean brood size of families, another key population statistic, is also assessed on the wintering grounds – and the same issues arise as for the assessment of the proportion of young birds in the flocks.
For several species of swans and geese it is possible to count all the members in the population. When the proportion of young birds in these winter flocks has been calculated and their number subtracted from the total population, the residue of adults and subadults can be compared with figures from the previous year to determine the number that have survived. The data collected provide not only an estimate of productivity but also an estimate of the mortality or survival rates of adults (plus subadults) over one year, both key statistics for understanding population dynamics. Such calculations provide best results for so-called ‘closed populations’ when all the birds are counted. When applied to an ‘open population’, where immigration and emigration are active, then the results are not very dependable. However, long time series of counts extending over, say, a continuous period of 30 years or more will smooth out inconsistencies.
A fundamental research tool in the study of wildfowl population dynamics is the leg-ring or band (Fig. 129). Traditionally metal, each is inscribed with a unique number and a return address to which the ring should be sent if the bird is shot, found dead or captured. The reported recovery of rings, together with finding details, provides basic information on migration and movements. The age and sex of the bird, the ringing and finding locations, and causes of mortality can also be established. Mortality rates for different age cohorts – first-year, second-year, older, etc – can also be calculated from a series of ring recoveries over a period of years. Again these sources of information are open to bias – for example, shooting pressures differ from region to region, and the return of rings is very much influenced by cultural considerations ranging from lack of interest to fear of being prosecuted if the rings are returned.
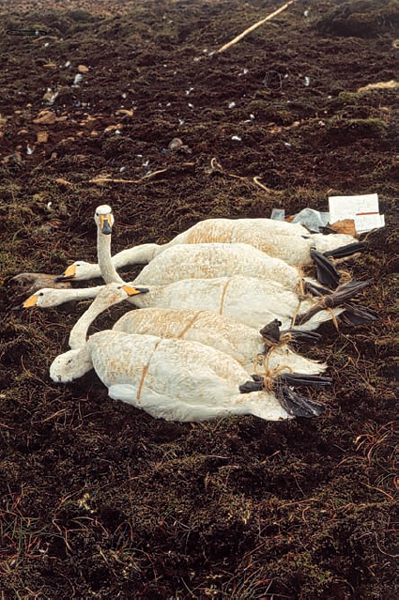
FIG 129. Whooper swans, caught as moulting adults in Iceland, and now waiting to be ringed, weighed and measured before they are released again. (David Cabot)
The advent of tough, two-ply laminated polyvinyl plastic (PVC) rings in the 1960s opened up a new era of research in population dynamics. These rings, commonly called Darvics, are made of calendered unplasticised PVC foil, laminated under heat and pressure. Each ring carries a unique alphabetic or numeric code, and can be white, yellow, blue, etc, providing an almost infinite number of combinations. Up to three alphabetic or numeric digits are normally etched through one of the laminations, endowing each ringed bird with a unique ‘licence plate’ (Fig. 130). The rings can be read at a distance of up to 600 m, depending upon light conditions, optical quality of the telescope and experience of the observer. Thus Darvic-ringed wildfowl can be visually ‘recovered’ for the rest of their lives, often at many different geographic locations over long time periods, without the bird being physically caught again. This is not only good for the wildfowl, as additional physical trapping trauma is avoided, but also beneficial for the wildfowl catcher, who expends enormous amounts of time and energy capturing birds whether by duck decoy, cage traps, rocket-propelled or cannon nets, mist nets or many other ingenious methods.
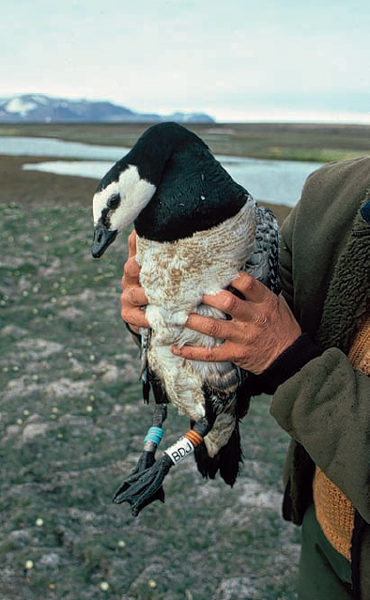
FIG 130. Darvic and coloured rings on barnacle goose. This goose -Darvic O/BDJ left and B/B/m right tarsus – was originally ringed on the Inishkea Islands, Co. Mayo, as a first-winter male on 8 January 1972. Here it has been retrapped during the annual moult in northeast Greenland, July 1984. It was then recorded again in two subsequent winters on the Inishkea Islands, until the end of March 1986. Its field-readable ‘licence plate’ had allowed it to be visually recorded many times without ever being caught again. (David Cabot)
The advantages of Darvic rings over traditional markings are enormous. If there is good observer coverage of the species at its various wintering haunts then continuous observations of individuals can be made. The age of pairing, first successful breeding and reproductive performance during the lifetime of a goose or swan can be easily tracked. Divorce rates can be monitored, inter-site movements followed and more dependable mortality rates can be calculated compared with calculations based on the recovery of metal rings. Individually marked birds can be monitored during studies of wildfowl energetics, especially the relationship between body condition (as indicated by abdominal body profile) and subsequent breeding success. In summary, the tracking of these individually ringed birds over time provides vital information on the productivity during the individual’s lifetime, mortality and survival rates, migrations and movements.
Darvic rings are easy to read on wildfowl such as barnacle geese that graze on closely cropped grass sward, or on brant geese that feed while walking on a muddy shore. But on birds ambulating in longer vegetation, such as the white-fronted goose and the other grey geese, or those that spend much of their time in water, such as the whooper swan, leg-rings are much more difficult to read. To overcome these visual-recapture difficulties special Darvic neck-bands, engraved with a unique alphabetic or numeric code as with leg-rings, were developed and have been successfully used on geese and swans (Fig. 131). It is possible to read these neck-bands at distances of up to 800 m.
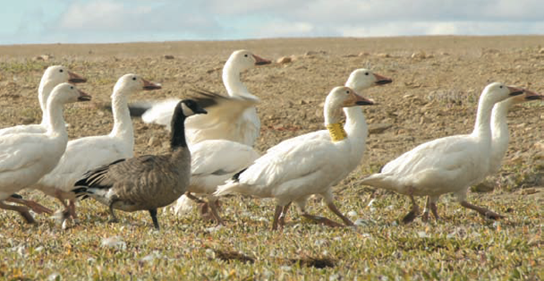
FIG 131. Greater snow geese and one small Canada goose, south of Eureka, Canada, 4 July 2007. Coloured alphanumeric neck collars have been used on many snow geese, and on a number of other wildfowl species. (Alyn Walsh)
Tracking the movements and migrations of wildfowl by satellite telemetry provides sophisticated insights into individual behaviour in a way that no other marking system can. There are many different types of transmitters. A frequently used system employs a small (30 or 45 g) solar-powered Argos/GPS transmitter (often called a PTT, platform terminal transmitter), sprouting a short wire antenna, attached to the back of the goose, duck or swan by a knicker-elastic harness (Fig. 132). The transmitter is programmed to send signals at specific times, according to what information is seasonally required, to a polar-orbiting NOAA satellite. Sensors measure temperature, its own battery voltage and animal activity, and there is also a twelve-channel GPS receiver that senses altitude, heading and speed. A receiving ground station downloads the signals, and the data are then provided online to the researcher. The exact geographic positions of the bird, to within ± 18 m, can be established. From these data and measurements, even the bird’s energy consumption and heart rate can also be calculated.
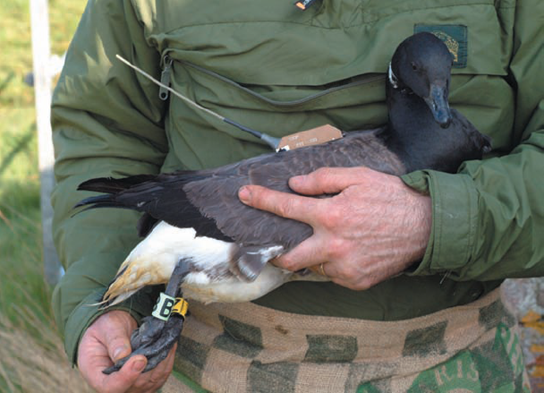
FIG 132. Satellite transmitter on the back of a light-bellied brant goose. Each transmitter is powered by miniature solar panels. The short aerial assists the transmission of data to the orbiting NOAA satellite. Each tarsus carries a different coloured Darvic ring to facilitate field identification of the bird. (Alyn Walsh)
Within Britain and Ireland satellite transmitters have produced remarkable results. Large-bodied long-distance migrants have been the main species studied – whooper swans, light-bellied brant geese, Greenland white-fronted geese, and the Svalbard population of barnacle geese; and recently (April 2008) Greenland-breeding barnacle geese that winter on the Inishkea Islands, Co. Mayo, have been fitted with satellite transmitters. Movements of these birds can be viewed at www.wwt.org.uk/research/tracking/maps.asp. Details that can be seen on the web-site include the migration flight line of a specific goose, the date and time of its transmission, its geographic coordinates, flight compass direction, speed and altitude. Then, when the goose has reached its breeding or wintering grounds, more information can be obtained about its local movements.
While satellite tracking is providing new and exciting information, it is basic research methods and techniques that have provided good information for a better understanding of the population dynamics of three well-known wildfowl – the mute swan, barnacle goose and mallard. These species have been chosen as they are well-known exemplars representing the three major wildfowl groups – swans, geese and ducks. Moreover, each has been subject to detailed studies for many years.
The mute swan (Fig. 133) is the largest and heaviest flying wildfowl in the world. The male’s average weight is 11.8 kg, and the eggs – average weight 340 g – are the weightiest of all wildfowl eggs. Their large size, conspicuous nests and easily studied breeding biology make them ideal subjects for the study of population dynamics.
It is one of the most widely distributed wildfowl in Britain and Ireland, found predominantly in the lowlands, rarely occurring above 300 m. Most favoured habitats are rivers and streams (36 per cent of nests during a 1983 survey), lakes and pools (26 per cent of nests) and canals and drains (21 per cent of nests). Because the birds are more or less sedentary, the populations in Scotland, England, Wales and Ireland are relatively discrete, facilitating the study of their population dynamics.
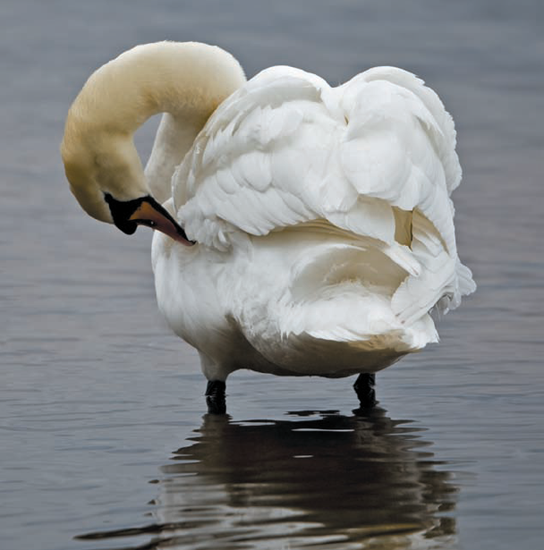
FIG 133. Already an impressive size, the mute swan can make itself even larger during territorial disputes by raising its neck feathers and elevating its wings. About 15 per cent of its time during the day is spent preening. (Ken Kinsella)
There have been various attempts, mostly incomplete, to census the breeding population at a national level (Table 83). The results show that overall the population remained relatively stable from 1955 to 1983, suffering a setback, estimated at 25 per cent, during the hard winters of 1961/62 and 1962/63, from which it recovered. During the 1970s and 1980s numbers in the major lowland river systems such as the Thames, Trent and Warwickshire Avon declined, partly in response to drainage impacts but thought to be principally because of poisoning by ingestion of anglers’ lead fishing weights and, to a lesser extent, spent gun-shot, mistakenly taken by the swans for grit.
| PERIOD | CENSUS METHOD | BIRDS | BREEDING PAIRS | NON-BREEDING BIRDS |
| 1955 and 1956 | Breeding survey | 19,900-21,600 | 3,550-4,000 | 12,800-13,600 |
| 1961 | Breeding survey | c.19,000 | (29.4%) | (70.6%) |
| 1978 | Breeding survey revision | c.17,630 | c.3,115 | 11,400 |
| 1983 | Breeding survey WeBS | 18,900 | c.3,150 | 12,600 |
| 1988-92: 5-year mean | Winter survey | 25,750 | — | — |
| 1988-91 | Breeding survey | c.27,000 | — | — |
| 1990 | Breeding survey | 25,800 | — | — |
| 1995-99: 5-year mean | WeBS + extrapolation | c.37,500 | — | — |
| 2002 | Breeding survey | 31,700 | 6,150 | 19,400 |
Data from Campbell, 1960; Eltringham, 1963; Ogilvie, 1981; Owen et al., 1986; Delany et al., 1992; Gibbons et al., 1993; Kirby, 1995; Kershaw & Cranswick, 2003; Ward et al., 2004.
Lead is a non-specific toxin affecting most bodily systems, including the haematological, muscular and nervous systems. Acute poisoning can follow the ingestion of ten or more lead shot, or fewer of anglers’ lead fishing weights, with death occurring within days. The annual estimated weight of lead fired into all habitats in Britain in 1990 was 2,000 tonnes, of which 160 tonnes went specifically into wetlands and was available to mute swans and other wildfowl. In Ireland the comparative figures were 153 and 46 tonnes respectively.23
Some swans died from direct poisoning, others had impaired breeding success. In Britain, public awareness and the introduction first of voluntary codes concerning the use of lead fishing weights in 1982, followed by legislation that banned the sale and use of lead weights in England and Wales from 1 January 1987 (but not Scotland, where voluntary codes were implemented), has greatly improved the situation.24 In addition, legislation was introduced in 1999 making it illegal in England to shoot certain species of wildfowl with lead shot, and to use lead shot below the high tide mark or in areas of International importance for wildfowl.25 Similar restrictions came into effect in Wales in September 2000, but there is no parallel legislation in Scotland or in Ireland.
It is likely that the incidence of all forms of lead poisoning in Britain has declined further over the past 15 years. The apparent 39 per cent increase in the mute swan population between 1985 and 1996 was almost certainly facilitated by a decline in lead poisoning in addition to a series of mild winters, resulting in reduced mortality of both adults and immatures. There has been a notable increase in the size of non-breeding flocks in urban areas, which are to a large extent dependent upon supplementary feeding provided by the public during the winter. In Ireland the lead-poisoning situation is more serious than in Britain now. Almost 70 per cent of all dead mute swans found up to the early 1990s had died as a result of lead poisoning.26
Since the mid-1980s numbers of mute swans have progressively increased.
The 1990s witnessed a remarkable 45 per cent increase in numbers, based on a breeding survey in 1990 and the five-year mean from WeBS counts 1995-99. The annual indices of birds wintering in Great Britain, calculated from WeBS counts, show an almost continuous upward trend, with a few minor blips (1992/93 and 1993/94), since the winter of 1985/86. This rapid population increase is confirmed by the results of surveys organised by the British Trust for Ornithology (BTO), whose Common Birds Census (CBC) and Waterways Bird Survey (WBS) have monitored mute swans since 1966.27 Overall the mute swan population in Britain and the Isle of Man increased by 23 per cent over the period 1990 to 2002, a slower rate than in the 1980s. In the past five or so years, since 2002/03, numbers have been more stable, and in 2006/07 they showed a slight decline, but this was within the expected range of fluctuation. Numbers in Northern Ireland at WeBS-monitored sites have declined rather dramatically since 1999/2000.
Numbers in Ireland have never been satisfactorily censused. An estimate of 5,000-6,000 birds was produced for the early 1970s, later updated to 7,000.28 In the late 1980s there was an estimated 10,000 birds, extrapolated from data collected by Ralph Sheppard during the winter counts 1984/85 to 1986/87.29 The estimated 19,000-20,000 breeding birds for 1988-91, based on extrapolation from data obtained for the New Atlas, is considered unrealistically high.30 A more rational figure, based on I-WeBS and WeBS counts for 1999/2000-2003/04 and subjected to an extrapolation multiplier of 1.65 – derived from a study in Britain31 – to incorporate uncounted and dispersed swans on small wetlands, canals and other water bodies not covered by I-WeBS, produced a population of 11,440 birds.32 The figure of 21,100 birds quoted in the 2005 publication Ireland’s Wetlands and their Waterbirds was a mistake.33
BTO surveys of the breeding performance of British mute swans have shown little change since the 1960s, apart from a decline in mean failure rate of eggs (Fig. 134). Some resources, almost certainly food in some locations, are becoming scarce. If the total numbers continue to rise at the rate recorded during the 1990s then it would be expected that density-dependent factors will probably suppress breeding performance, with a decline in productivity and recruitment of young birds into the breeding population.
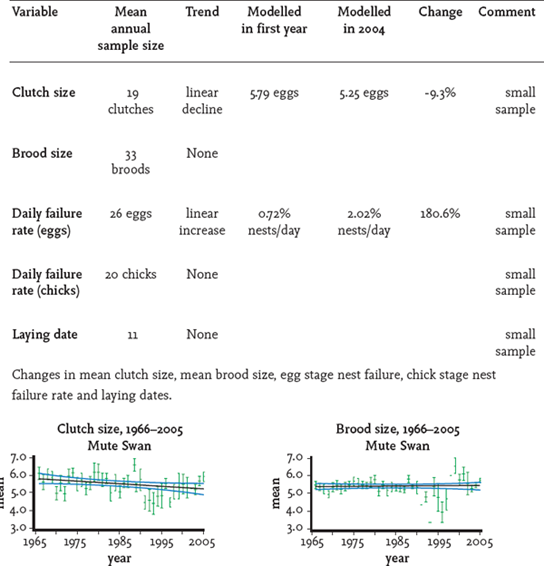
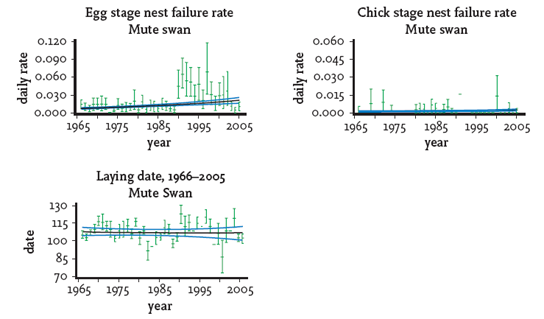
FIG 134. Productivity changes for mute swan in Britain 1966–2006. From S. R. Baillie et al., Breeding birds in the wider countryside: their conservation status 2007 (BTO, 2007). Reproduced with permission.
Immigration and emigration are important elements of population dynamics, as discussed earlier. If there is little or no movement of birds in and out of the local, regional or national populations then their dynamics are easier to unravel. Fortunately the mute swan falls into the category of ‘little movement’. The median natal dispersal distance from 307 British and Irish ringing recoveries is 14 km.34 Malcolm Ogilvie analysed the recovery of some 2,156 swans that had been ringed in Britain and recovered by 1966. Most (70.2 per cent) had travelled less than 16 km from the place of ringing (usually following the line of a watercourse), and only 46 (2.1 per cent) had travelled more than 80 km, some of which included moult migrants.35 There was no evidence to support regular migrations overseas. However, a small number of birds ringed in Sweden, Denmark and Holland were recovered in southeast England during the severe winter 1962/63, and it is likely that similar movements occur during other periods of hard weather – a total of 13 ringed abroad have been recovered in Britain, mostly under cold weather conditions. Additional evidence to support these hard-weather immigrations is provided by 43 swans ringed mostly in southeast England during cold winters and their subsequent recovery during spring and summer on their return to Holland, Germany, southwest Sweden and northern France.36
Irish-ringed mute swans move greater distances than their British cousins. It has been argued that higher survival rates of Irish swans lead to more competition and a consequent shortage of breeding territories, thus the need for immature swans to travel further from their natal areas in search of breeding territories. The movements of 227 swans ringed at the Lough, Cork, revealed 77 per cent moving between 16 km and 48 km, with a median distance travelled of 30 km. Eight birds moved more than 80 km, including one which went 460 km across the Irish Sea to Staffordshire. Birds in their second year travelled the most, and the greatest cumulative distance, while there was little movement of swans older than four years.37 There is some movement of immature Scottish birds, mainly from the Uists in the Outer Hebrides to Northern Ireland and the Irish Republic – Counties Antrim, Donegal and Derry – as evidenced by 14 recoveries up to 1988.38 There has been no evidence of return movements of these birds. There have been fewer than ten recoveries of British ringed birds in Ireland, mostly on the east coast. A disproportionate number have come from birds ringed on the Isle of Man. Despite the low numbers of birds moving from one population to another there is probably sufficient gene flow to prevent subspeciation.
The imperative for all animals is to beget more of their own. The age of first breeding is a critical issue in population dynamics – the longer it is delayed the greater the need to produce sufficient young that will survive until they enter the breeding population and replace their parents. As with other large long-lived birds, mute swans do not breed successfully until they are about four or five years old. Studies during the 1960s in the Oxford area, carried out by Chris Perrins and colleagues at the Edward Grey Institute of Field Ornithology, found that the annual adult survival rate was 82 per cent – i.e. 18 per cent of the adults died per year, meaning that within each pair 0.36 adults died per year on average.39 For the population to remain stable, therefore, every year 0.36 offspring from each pair had to enter the breeding population in their fourth year. The Oxford study found that 0.43 young survived to their fourth year (in more recent years the figure has risen to 0.54), providing the population with a healthy margin of recruitment, and a valuable buffer if incidents of exceptional mortality, such as a severe winter, occurred. However, if the adults did not breed until their fifth year only 0.32 young birds would survive until then, and be available for recruitment. As this recruitment rate was less than the adult mortality at the time, the population would slowly decline unless the mortality was balanced by immigration. Matters become more complex due to the great variation of age of first breeding – figures from the Oxford study showed that 10 per cent of adults bred at age three years, 37 per cent at age four years, 53 per cent at age five years and 71 per cent aged six years. Recent information from the long-term Abbotsbury study showed that the mean age at first breeding for males was 4.61 years, and for females 4.31 years.40
Pairing generally takes place during the winter and spring, mainly within the non-breeding flocks composed of birds aged 1-4 years old. Courtship is a slow process, ensuring a close bond between the birds. During pre-copulatory behaviour both birds dip their heads under water almost simultaneously, following which they rub their heads on their backs or sides, or preen. As the process continues their movements become synchronised, each swan behaving as if it was a mirror image of the other. The male then mounts the female and afterwards the necks are held erect again with their bills pointing upwards at first, then downwards. Preening and bathing then follow. Mute swans mate more frequently than necessary just to fertilise the eggs, probably because it strengthens the bond between the birds.
Mute swans are fabled for their devotion to each other. Clive Minton studied the fates of more than 100 individually marked swans in Staffordshire in 1961-67 and found that 85 per cent of paired breeding swans retained the same mate, if it was still alive, from year to year. Divorce occurred in less than 3 per cent of successful breeders and 9 per cent of failed breeders. Non-breeding pairs were less stable, with only 75 per cent retaining the same mate. These low rates of change reflect the selective advantages of fidelity. Most mute swans retain the same breeding site from year to year. Only 2 per cent of surviving pairs moved their territories more than 8 km from their previous nesting site.41
Territory size is variable, depending upon the local feeding ecology and swan numbers. The average linear territory size on some of the best-quality rivers around Oxford is 2.5-3 km, while on the river Thames outside the Oxford area it is about 15 km. Although normally solitary breeders, extraordinarily high nesting densities can be encountered in coastal lagoons that are rich in food resources. For example at Abbotsbury at the west end of the Fleet – a 14 km long stretch of tidal inlet with a declining salinity content towards Abbotsbury behind Chesil Bank in Dorset – some 150 pairs nest in close proximity, with a mere 2-20 m between nests (Fig. 135). This high-density nesting is made possible by the protection from many of the hazards facing breeding birds in other locations. There are also large quantities of food available – especially eelgrass and tasselweed.
Other instances of high-density nesting are generally spasmodic, possibly involving a high proportion of young birds, trial-breeding for the first time. In Ireland I once found 43 nests on a one-hectare island at Our Lady’s Island Lake, Co. Wexford, on 13 May 1961. The average clutch size was 4.9. Two hundred and sixty-five swans were present on the lake then, compared with 348 at the end of the previous November. A week later the number of nests had increased to 59, but all the earlier nests showed evidence of predation by mammals, possibly rats or mink, and it is unlikely that any of the 59 pairs bred successfully. During the previous summer, 50 swans had been recorded on the lake, but only one pair bred successfully. In subsequent summers, also, only one pair bred, with between 12 and 50 swans present during the breeding season. In 1987 I came across a similar nesting explosion on Inch Lough, Co. Donegal, where I found 42 nests on a small islet, less than half a hectare in extent. Such breeding densities had not previously been recorded in the lough – nor subsequently. These outbursts of high-density nesting are most likely encouraged by sudden availability of abundant food supplies.
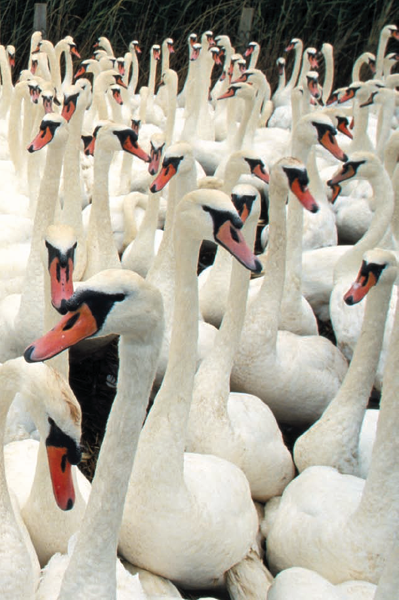
FIG 135. Mute swans at the Abbotsbury swannery, Dorset. (Guy Edwardes/NHPA)
Under normal circumstances the mute swan is one of the most territorial of all birds, defending its ‘patch’ throughout the year, their aggressive behaviour towards other swans intensifying during the nesting period. The male’s behaviour during incubation is often dramatic, with outstretched flapping wings accompanied by vigorous hissing. The ferocity of the defence is unparalleled in other birds and is difficult to explain. It may have evolved when the swan was a truly wild species in continental Europe, subject to predation by wolves, brown bears and other large mammals. Forceful aggression by the swan would have been necessary to ward off these attacks.
Within the population a relatively large proportion – up to 30 per cent – of pairs in Staffordshire that defended territories did not breed in any given year.42 In another study, in Dublin, 54 per cent of all the individual swans aged five years did not attempt to breed.43 While such a high proportion of non-breeders might seem a waste of an opportunity to obey the biological imperative, there are reasons for this, probably related to density-dependent factors. During a study of the Abbotsbury swans (1976-2000) Chris Perrins and colleagues found that intermittent non-breeding by adult birds – known as ‘skippers’ – accounted for the loss of 400 bird years of potential breeding, or an average of 9 (range 2-28) per cent per year.44 Skipping is also widespread among Arctic-breeding geese (see barnacle goose, p. 336). With generally low levels of adult mortality and consequent high longevity and a potentially long breeding life, there is no need for large wildfowl to breed every year. This intermittent non-breeding of mature adult ‘skippers’ could be viewed as a part of an adaptive strategy in which these birds are spared the potential costs of reproduction with an expected enhancement of their survival rates. The ‘skippers’ may also have a higher probability of reproducing in subsequent years. One might also view intermittent breeding as a method of maximising lifetime reproductive success in which an individual would pick a year in which its chances of breeding successfully would be greatest.
Avian egg and clutch sizes are determined both by inheritance and by environmental factors. David Lack argued that the average clutch size in waterfowl varies inversely with the relative size of the egg and has evolved in relation to the availability of food for the female around the time of laying.45
The mean clutch size of the mute swan in six studies in Scotland and England ranged from 4.8 to 6.9 eggs (Table 84) – a relatively small clutch compared with most other wildfowl, where sizes of 11–14 are not unusual.46
On completion of incubation, carried out solely by the female, during which she may lose up to 33 per cent of her body weight, the nidifugous cygnets leave the nest within 24-48 hours of hatching. Hatching success is quite variable, with nest failure rates ranging from 29 to 49 per cent depending upon location and circumstances. The commonest causes of failure are human destruction of eggs and flooding of nests. If clutches are lost early on in the season many of the swans will lay a second clutch, albeit generally a smaller one.
Most cygnets are light grey with white underparts. However, some may have an all-white plumage. These are the so-called Polish cygnets, a variety, or morph, of the mute swan. In addition, Polish cygnets have pale, almost pink legs – not the usual black – a colour they retain for life. Originally thought to be a different species, they were erroneously accorded the scientific name Cygnus immutabilis after they were first encountered on the river Trent, Staffordshire, in 1686.47 It was later realised that Polish swans derived from birds imported to Britain from the Baltic states and eastern Europe, where in some locations they constitute up to 20 per cent of the population. Within Europe the lowest proportion of Polish swans occurs in Britain (1 per cent) and the highest (76 per cent) in the Göttingen region of Germany, while in Poland the proportion of breeding Polish swans varied from 1.8 to 8.3 per cent of 336 breeding pairs examined.48 The genes controlling the two morphs are located on the sex chromosome. Male birds have two matching sex chromosomes, while females have only one sex chromosome. So the female cygnets with the Polish gene (recessive to the grey gene) are always white as it cannot be overridden by the dominant grey gene. As a consequence many more females (about 26 per cent) are of the Polish form than males (about 10 per cent).
Both adults remain with the cygnets throughout the summer, initially assisting their brood by rooting up vegetation outside the reach of the cygnets’ shorter necks. The great length and flexibility of the neck is due to the presence of 25 cervical vertebrae (swans have more than 60 vertebrae altogether), more than any other animal, even the giraffe, which like all mammals has only seven vertebrae in its neck. The additional flexibility provides the swan with a successful adaptation to foraging aquatic vegetation in preferred water depths of 0.5-1.2 m. Apart from its function as a feeding instrument, the dextrous neck is used to great effect during courtship and other behavioural ceremonies.
The cygnets stay with their parents until at least September, when most of them are able to move, or fly, away from their parents voluntarily, or are chased away, to join the non-breeding flocks. However, a few young will remain with their parents until the following spring, as is the case with geese as well as whooper and Bewick’s swans.
While the cygnets are still small the adults go through their annual moult in their own territory, commencing at the end of July or early August. Primary and secondary flight feathers are shed together, making the swans flightless for a period of 4-7 weeks, depending upon local circumstances. To ensure that the cygnets retain some protection from one parent, the male and female stagger their moults. Generally the female commences first, the male waiting until her new flight feathers are well advanced.49 When there are no cygnets to protect, the adults gather together with other mute swans – see below – and shed their feathers simultaneously. The moult is geared to the most advantageous period of the year when the weather is generally warmest and food is at peak production. This allows the moulting birds to replace the considerable drain of internal energy resources and sustain the metabolic activity associated with new feather growth. It has been estimated that the complete plumage of a bird may represent some 20-30 per cent of the total lean dry body mass of a bird.50 The energy required to regenerate the moulted feathers results in a body-weight loss of some 5-10 per cent, depending upon locality. In one Danish study it was found that a mute swan’s primary feathers grow at a rate of some 6-7 mm per day to reach their full length of 400 mm after 67 days.51 Average primary-feather growth rate has been recorded at 6.1 mm per day at Berwick-upon-Tweed.52 The swans can fly, however, 3-4 weeks before their flight feathers are fully grown.
The survival of the cygnets and immatures determines the recruitment rate of new birds into the population. Survival rates are variable, ranging from 41-68 per cent during the first year to 75-90 per cent in the third year, according to local circumstances (Table 84). Adult survival rates are naturally much higher, because by their third year the birds are more experienced at finding food and avoiding hazards and other types of mortality; nationally they are in the range 74–87 per cent,53 very similar to the 77-90 per cent found in the studies summarised in Table 84. The high mean adult survival rate of 94 per cent noted for the Abbotsbury population during earlier studies has been recalculated at 85 per cent, based on more recent work.54
As the national population of mute swans in Britain remained more or less stable between 1955 and 1983, with dips during the hard winters, the number of young surviving per pair to breed must have equalled twice the adult mortality. In a stable population with an average annual adult mortality rate of 18 per cent an average of 0.36 young per pair (0.18 × 2) would need to survive to the breeding age of four years old, as explained above.
| AREA AND STUDY PERIOD | HEBRIDES 1978-82 | ABBOTSBURY 1969-80 | MIDLANDS 1961-78 | ||||
| Clutch size | 6.1 | 4.8 | 6.6 | % nests lost | 30 | 38 | 49 |
| Brood size at | * | * | 2.6 | ||||
| hatching a | |||||||
| Brood size at | 1.8 | (1.9) | 1.9 | ||||
| fledging | |||||||
| Annual survival rate b | |||||||
| To 1st year | 1.04 | + | 0.79 | ||||
| To 2nd year | 0.78 | + | 0.53 | ||||
| To 3rd year | 0.59 | + | 0.37 | ||||
| To 4th year | 0.44 | + | 0.28 | ||||
| Adult survival | 0.90 | 0.94 | 0.82 | ||||
| Balance per annum c | 0.24 | (0.82) | - 0.08 |
| AREA AND STUDY PERIOD | OXFOR 1 1960s-80s | OXFORD 2 1960s-80s | LOWER THAMES 1979-84 |
| Clutch size | 6.0 | 6.9 | 6.8 |
| % nests lost | * | 14 | 6 |
| Brood size at | 4.0 | 3.8 | 3.4 |
| hatching a | |||
| Brood size at | 2.0 | 2.8 | 1.7 |
| fledging | |||
| Annual survival rate b | |||
| To 1st year | 1.3 | 1.03 | 0.65 |
| To 2nd year | 0.89 | 0.69 | 0.45 |
| To 3rd year | 0.67 | 0.46 | 0.31 |
| To 4th year | 0.43 | 0.31 | * |
| Adult survival | 0.82 | 0.82 | 0.77 |
| Balance per annum c | 0.07 | - 0.05 | - 0.15 |
Data from Perrins, 1991.
For the next 19 years to 2002, as the British national population was significantly expanding, survival of young birds to recruitment into the population as breeding birds must have exceeded twice the adult mortality rate. This could have come about by (1) increased juvenile survival – fewer predators, less human interference, more available food, mild winters, etc – or (2) reduced adult mortality – no or reduced lead poisoning, mild winters, more food being provided by the public, etc – or (3) more adults breeding at an earlier age.
The results from six study areas (Table 84) showed high adult survival rates in the Hebrides and at Abbotsbury, both populations holding their own and slightly increasing, while the Oxford, Midlands and Lower Thames populations experienced declines of 70 per cent or more between the early 1960s and mid-1980s. The losses would have been larger but for immigration, thus emphasising its role in population dynamics. While reproductive and adult survival rates are the key elements in the balance of numbers, the various studies showed that populations can remain more or less stable with adult annual mortality of between 82 and 94 per cent, suggesting that there is a surplus of available young birds waiting ‘in the wings’ to move into the population and take their positions as mature breeders.
The consequences of a small increase in adult mortality for long-lived species such as swans and geese are considerable. For example, a 1 per cent reduction on a 95 per cent adult survival rate will require a disproportionate increase in the numbers of young from 0.1 to 0.12 per pair – a 20 per cent increase – required to survive in order to maintain numbers.55
Chris Perrins concluded from his comparative study in 1991 that mute swans can maintain stable populations with a wide range of different demographic characteristics in which adult survival rates ranged from 94 per cent to as low as 82 per cent per annum or, put another way, when adult losses varied from 6 to 18 per cent. Such flexibility is biologically advantageous, as it allows swan populations to maintain their numbers in the face of occasional severe weather conditions and intermittent episodes of mortality brought about by disease, as well as exceptional mortality, which in the case of the mute swan is mostly caused by human activities.
Unlike the mute swan and mallard populations, the numbers of the Greenland breeding population of the barnacle goose show little evidence, as yet, of being subject to density-dependent factors. The barnacle goose population breeding in Svalbard, on the other hand, is subject to density-dependent population control factors that have become more pronounced in recent years as increasing numbers have brought about intensification of competition for food resources. Both populations have increased dramatically over the past 50 years or so (Fig. 136). The Greenland population expanded from 8,300 birds in 1959 to 70,501 in March 2008.56 The Svalbard population rose somewhat similarly, from 3,000-4,000 birds in the 1960s to 29,815 in November 2007.57 Most of the wintering Greenland birds are found on Islay, where there has been an estimated annual increase of 6 per cent since the 1970s, compared with a 2.7 per cent annual rate of increase for the Irish wintering population and 3.2 per cent for Scottish, non-Islay, wintering birds.
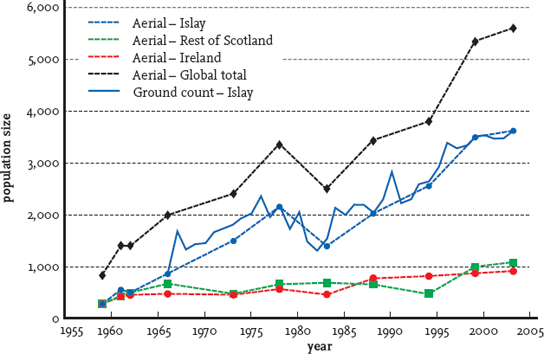
FIG 136. Greenland barnacle goose population size, 1959–2003, derived from aerial surveys (dotted lines) and ground counts (solid line, Islay only). From J. Worden et al., The Greenland population of the barnacle goose Branta leucopsis in Britain and Ireland 1956/57 to 2002/03 (WWT/JNCC, 2004). Reproduced with permission.
Shooting mortality held down both populations historically to the point where they were considered to be at dangerously low levels in the late 1950s.58 When shooting was banned, at the same time as nature reserves were being created, numbers took off without any density-dependent factors restraining the increases. Shooting had been responsible for most of the known adult mortality, and when it ceased adult survival rates increased dramatically, allowing increased breeding capacity and recruitment of young birds into the population. Food resources were also abundant on the wintering grounds and in the spring and autumn staging areas, and breeding sites were virtually unlimited.
Now that numbers in the Greenland population have risen to their highest levels ever, it might be expected that the population would begin to be controlled by density-dependent factors. With regard to those wintering on Islay there have been statistically significant declines in the proportion of breeding birds and productivity of birds since 1995, while there has also been an almost significant (at the 5 per cent level) decline in the proportion of juveniles in the winter flocks.59 Analysis of population counts on Islay using the Pollard randomised test showed that the Islay population exhibited a density-dependent decline for the period 1966-78, but over a longer period, 1966-2003, there was no evidence of such a decline.60 This was confirmed by another statistical test, developed by Dennis and Taper.61 On the other hand, variations in weather have been shown to affect breeding performance and recruitment rates of young birds into the breeding population. In the early 1990s Fox and Gitay analysed the annual fluctuations in the breeding success of barnacle geese wintering on Islay, as reflected in the percentage of juveniles in the wintering flocks. They found the number of successful breeding pairs to be directly related to the size of the breeding population, and concluded that it was highly unlikely that density-dependent factors were operating on the population. Correlations between breeding success and the previous winter weather conditions at Tiree (closest meteorological station to Islay), northern Iceland (where the geese spend about one month staging before moving to Greenland), and Mesters Vig, northeast Greenland (close to the breeding grounds), showed that 60 per cent of the variation in breeding success could be explained by early spring weather conditions in Scotland, spring and early summer conditions in Iceland during the staging period, and conditions in Greenland on arrival.62 These findings supported some work that Brian West and I did 18 years earlier on the barnacle goose population wintering on the Inishkea Islands, Co. Mayo, which showed that winter temperatures close to the islands (at Belmullet, 17 km northeast) were correlated with subsequent goose productivity on the breeding grounds. Mild winters allowed good growth of grasses – the main food resource of the geese – allowing the birds to build up greater critical energy reserves, indicated by body weight, than was possible in winters with lower temperatures and consequently less growth of grass.63
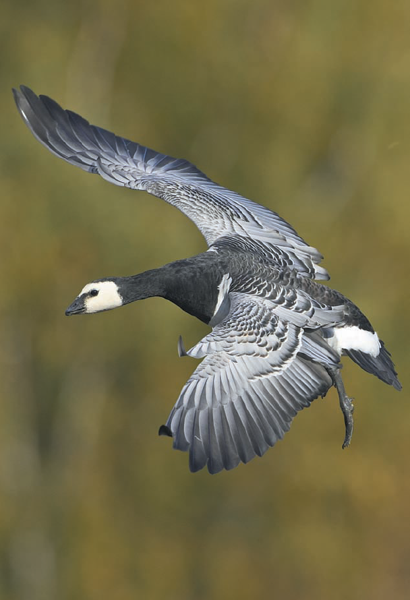
FIG 137. Barnacle goose: a mature adult, with very clear white tips to the wing coverts. (Jari Peltomaki/NHPA)
With regard to the Svalbard population, on the other hand, it has been clearly shown that declines in fecundity and in the survival of young birds, thus affecting recruitment of young birds into the breeding population, are operating. Myrfyn Owen and Jeff Black have shown that the 3,000 km autumn migration from Svalbard to the Solway Firth is the most hazardous part of the goose’s life cycle, and most deaths during this period are probably the result of inadequate fat reserves for the migration. There is competition between adults and young birds for food during the rearing and fattening periods on the breeding grounds. In some years considerable numbers of young birds fail to complete the migration. Based on the numbers of geese ringed in Svalbard in 1986, some 35 per cent of the young failed to reach the wintering grounds (i.e. a 35 per cent mortality rate). Goslings that were hatched late in the season and that had low body weights at the age of 3-5 weeks suffered higher mortality. Differences in survival rates were found among the geese according to the different breeding locations where habitat quality and density of geese varied.64 It was also established that average breeding success fell as numbers in the population increased and competition for food resources intensified. But brood size did not decline, as a smaller proportion of successful breeding adults were contributing to the productivity of the population.
With my colleagues Brian West and Maurice Cassidy I have closely followed the population dynamics of the Greenland birds, both on their Greenland breeding grounds (over three summers) and on the wintering haunts, principally on the Inishkea Islands, Co. Mayo, for the past 48 years, qualifying the project as one of the longest goose monitoring programmes in western Europe. Steve Percival and others have been studying the dynamics of Greenland birds wintering on Islay, Scotland, and have also followed the geese to their Icelandic staging grounds. Myrfyn Owen and Jeff Black, and more recently Larry Griffin, together with colleagues from the University of Gr0ningen in the Netherlands, and the Norwegian Polar Institute, have been following the fortunes of the Svalbard population on their breeding grounds, at their autumn and spring staging areas, as well as in their winter quarters on the Solway Firth. Valuable new information on the migration and movements of the population has been gathered by the fitting of GPS satellite transmitters to the geese. For the purposes of this chapter only the Greenland breeding population will be considered in detail (Fig. 138).
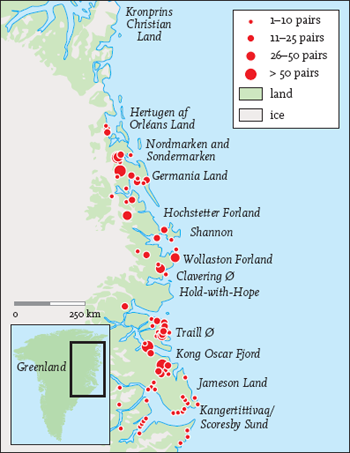
fig 138. Distribution and approximate size of barnacle goose colonies in northeast Greenland. In some areas broods have been observed but the colonies not located, for example at Hold-with-Hope. From J. Madsen et al., Goose Populations of the Western Palearctic (Wetlands International & National Environmental Research Institute, Denmark, 1999). Reproduced with permission.
The Greenland population breeds on the east and northeast coasts of Greenland from Scoresby Sund north to Hertugen af Orleans Land, a distance of some 900 km. The coastline is indented by long fjords and glaciated valleys in a rugged, barren landscape. During the summer the coastal strip, glacial valleys and fjords thaw out to support a rich Arctic vegetation that provides essential food to the geese from their arrival at the end of May to their departure in August. The geese breed colonially, mainly on cliff ledges and rock outcrops standing high above coastal plains or on the sides of valleys. Colony size is usually small, ranging from a few pairs to up to 150. A typical nest will be located near the top of a 50-100 m sheer cliff, with a further 100-300 m of boulder scree leading down to the valley bottom.
A typical breeding area in Greenland is the valley of 0rsted Dal, Jameson Land (Fig. 139). It is about 43 km from its head to the sea and about 6 km wide in its lower section. It is a classic glaciated valley with a broad U shape. The walls of the valley are formed by upstanding cliffs – sandstones and shales with basalt intrusions spreading out horizontally through the sandstone – that have been eroded to form massive scree slopes at their feet (Fig. 140). The cliff walls on which the geese nest give the valley an atmosphere like an amphitheatre, cut off from the surrounding mountain ranges. The central and dominant feature is the main river, which has superimposed its fluvial features on the glacial moraines. In the lower part of the valley the river broadens out into a series of braided channels up to 1 km wide, which become swollen with melt-water in June and July.
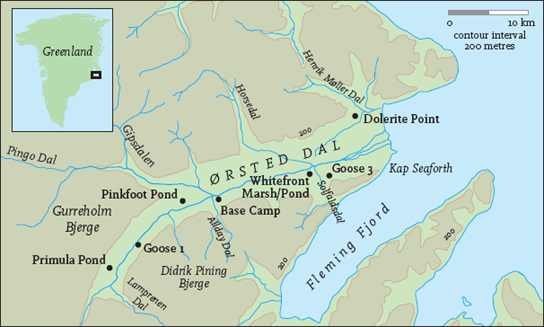
FIG 139. 0rsted Dal, northeast Greenland, the site of several barnacle goose breeding colonies on the cliffs that rise up from the valley floor. From D. Cabot et al., Biological Expedition to Jameson Land, Greenland 1984 (Barnacle Books, 1984).
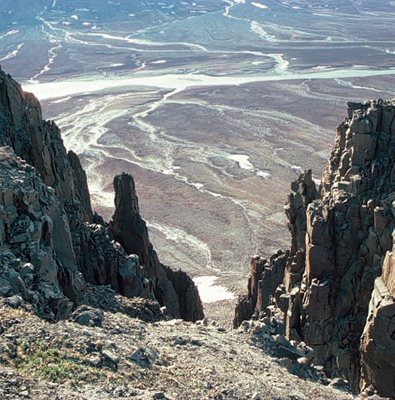
FIG 140. 0rsted Dal cliffs. These vertical cliffs rise some 200 m above the valley floor and provide safe and secure nesting sites for barnacle geese. (David Cabot)
In 0rsted Dal a total of 201 pairs bred in 1984, located in nine colonies, with a mean of 22.3 pairs per colony (range 3-50). The mean estimated height above the valley floor was 200 m (range 80-300 m) and the mean height above the scree was estimated at 39 m (range 20-70 m).65 Some 800 km further north in Nordmarken, during 1987, seven colonies held a total of 116 pairs, with a mean of 16.6 (range 3-33). The mean estimated height above the valley floor was 133 m (range 80-200 m) and mean height above the scree was 47 m (range 30-80 m).66
The geese nest on cliffs to avoid predation by the arctic foxes that roam the flat tundra landscape below. It is not unusual to find a gyrfalcon nesting either in, or in close proximity to, a colony. The presence of the falcon discourages reconnoitring glaucous gulls and ravens, predators of goose nests. There are also many eyes in the goose breeding colony to alert the gyrfalcon to any potential danger. For the geese, the downside of this association is that the falcons take some of the barnacle goslings, snatching them off the cliff ledges as ‘hot gosling takeaways’. However, the advantages of this cohabitation must be mutual for goose and falcon (Fig. 141).
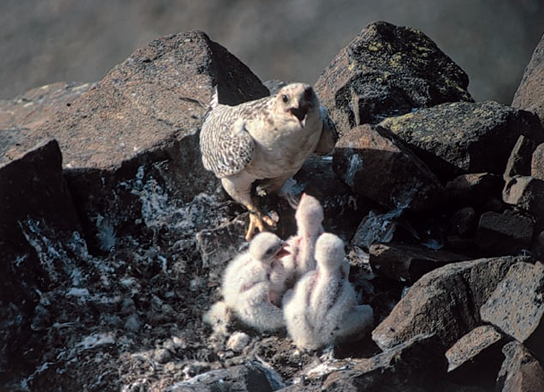
FIG 141. White-phase gyrfalcon feeding its young. The nest is in close proximity to a small colony of nesting barnacle geese. Several small goslings were observed being snatched off the cliffs by the gyrfalcon. (David Cabot)
The barnacle goose’s nest site (Fig. 142) presents problems for the goslings when they have to leap off the cliffs to the ground below and then travel with their parents to the security of nearby lakes, where they undergo rapid growth until they fledge. Until relatively recently it was not known exactly how the cliff-nesting barnacles got their young down safely from the nests. In his book Wild Geese, Malcolm Ogilvie refers to published accounts of adult barnacles carrying goslings down to the ground either in their bills or on their backs.67 The objections to these methods of transport were reviewed by Ogilvie, who concluded that a free fall or bouncing down by stages was possible without killing the goslings. Such behaviour had already been described for cliff-nesting Canada geese68 and, of course, it is a common phenomenon in some cliff-nesting auks, although here the flightless young are about three weeks old and have been well fed on the ledges by their parents. The first systematic observations of this amazing spectacle of free-falling goslings were made during our 1984 expedition to Jameson Land, when jumping chicks were captured in the documentary film Valley of the Geese, produced for Irish television (RTE).69
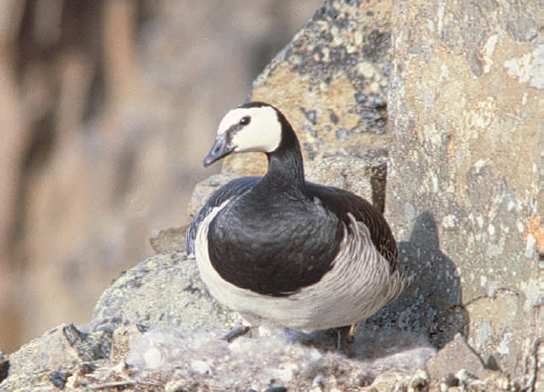
FIG 142. Barnacle goose nest. A flat platform on the cliff face is usually selected for the nest site. The nest is rudely constructed with goose droppings and a large number of down feathers plucked from the breast of the female, which exposes part of the goose’s skin as a brood patch and allows immediate body-heat transfer to the eggs as she incubates them. When she departs the nest for a brief feeding session in the valley below she arranges the feathers over the eggs to keep them warm and out of sight of predators. The male usually remains on guard near the nest. (David Cabot)
Continuous 24-hour observations made on nests in 0rsted Dal showed that on average incubating females spent 3 per cent of their time away from the nest with a mean trip duration of 37 minutes. The number of feeding trips declined as hatching began. Limited observations suggested that the goslings spent about 42 hours on the nesting ledge after hatching and before the jump. In 1987, in Germania Land, we found the mean time spent before departure from the nesting ledge was 41.3 hours (range 28-62), based on observations made on eleven nests. Of 94 goslings observed to jump from a total of 30 nests at Kap Seaforth, 0rsted Dal, in 1984, 26 were lost in the scree, 13 were taken by foxes and two by glaucous gulls, representing an overall loss of 43.6 per cent. Of 41 goslings hatching from 12 nests in Nordmarken in 1987, 16 were taken by foxes, two by gyrfalcons and one each was lost in the scree and fell out of the nest, a loss of 48.8 per cent. The combined overall loss of 135 goslings, from prior to jumping to the age of two weeks in the security of ponds or lakes, was 45.2 per cent.70
The mean loss of young, as measured by comparing brood sizes on the lakes in northeast Greenland and later on the Inishkea Islands, was 23 per cent in 1984, 3 per cent in 1987 and 17 per cent for the two years combined (Table 85). This is markedly less than that recorded in the Svalbard population in 1986, possibly due to differences in density-dependent factors on the breeding grounds.
Once the goslings have survived the jump from the nest and have reached the comparative safety of the tundra lakes, they must spend 40-50 days fledging, and all the while they are at risk from Arctic Foxes and glaucous gulls, and are competing for food with other goose families (Fig. 143). Additional mortality will be incurred during the migration from Greenland to Iceland and from some shooting as they rest, for about a month, on their staging grounds in lowland marshes in southeast Iceland. The onward migration to Scotland and Ireland will also take its toll, and further losses will then be incurred on the wintering grounds, where there is again competition for food. Another critical point is the ability of a breeding female to accumulate sufficient body reserves on the wintering grounds and at the spring staging areas, ensuring good physiological condition to withstand the final leg of migration to northeast Greenland and to get through the energy-demanding breeding season.
| 0RSTED DAL (1984) | NORDMARKEN (1987) | COMBINED (1984 + 1987) | |
| Clutch size range | 2–6 (n = 30) | 2–6 (n = 12) | 2–6 (n = 42) |
| Mean clutch size | 3.57 (n = 30) | 4.16 (n = 12) | 3.7 (n = 42) |
| Mean brood size prior to jump | 3.13 (n = 31) | 3.42 (n = 12) | 3.2 (n = 43) |
| Mean brood size (c.2 weeks old) in lakes | 2.40 (n = 50) | 2.33 (n = 18) | 2.4 (n = 68) |
| Mean brood size, winter (October to December), Inishkea Islands, Co. Mayo | 1.86 (n = 122) | 2.26 (n = 85) | 2.0 (n = 207) |
The physiological demands on the female are considerable. First there is egg production, for which she must draw on her body reserves (a full clutch represents 26 per cent of the female’s body weight), and then she must withstand an incubation period of some 25-26 days, during which she eats little or no food. Studies on four captive breeding, free-flying females at the Wildfowl & Wetlands Trust at Slimbridge showed a mean weight loss of 90 g per day during laying and subsequently 26 g per day during incubation.71 Thus an average female of 2.5 kg body weight might have to endure a weight loss of 1 kg, or 40 per cent of her weight, for these two critical activities. Such a loss can lead to death of the female while on the nest under adverse weather conditions towards the end of incubation, as has been found in the snow goose in Canada.72
The annual energy cycle of the barnacle goose follows a regular pattern. Soon after their arrival back on their wintering grounds on the Inishkea Islands they replenish their energy reserves, depleted during the breeding season and on migration from Greenland via Iceland. Initially they feed by rooting and grubbing up white clover stolons, rich in energy and easily digested. When these are exhausted the geese switch to the grasses red fescue and smooth meadow-grass, which are plucked more delicately, but at a great speed, from the short sward.
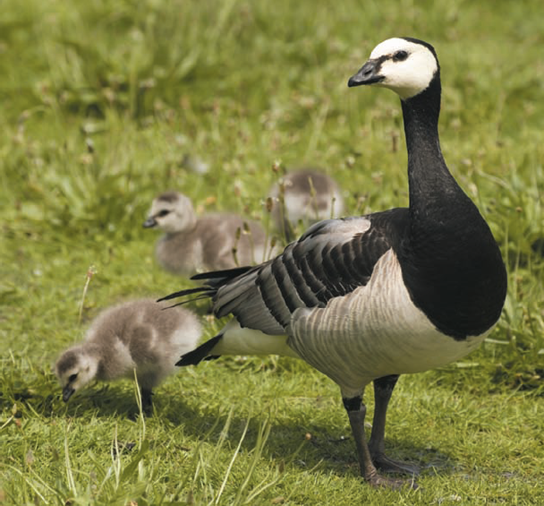
FIG 143. An alert barnacle goose mother watches over three goslings while they feed. After jumping from the cliff-ledge nest sites the goslings are taken to the safety of a nearby small lake. (Joe Blossom/NHPA)
It is probable that the geese selectively graze or ‘farm’ areas of the grass swards at critical times of the year, to encourage the growth of rapidly growing grass shoots with a high protein content. Lamina (leaf) extension rates and protein content in grazed grass shoots are greater than in ungrazed grass even without the beneficial effects of fertilisation by goose droppings.73 Thus the geese, by controlled grazing of their swards, are maximising available nitrogen content and digestibility of the grass. Body weights remain more or less stable during the first part of winter, often decreasing during the second half, especially when temperatures fall below 5°C, when grass will no longer grow. Many barnacle geese are confined to low-grade feeding habitats, fearsome of moving to lusher pastures where there are human and other disturbances such as illegal shooting. On the Inishkea Islands it is the family parties that leave the islands first when food resources become scarce, especially in February and March. These successful parents take their broods to better feeding areas on the mainland and elsewhere, leaving behind the failed and non-breeders.
Increasing spring daylight and rising temperatures stimulate grass growth, the first flushes rich in proteins that are easily digested. Body reserves, indicated by body weight, increase rapidly – especially among females and first-winter birds – throughout April until their departure towards the end of the month, first to Iceland, where they stop in the northern valleys for about a month and top up their energy reserves, while some unpaired adults engage in courtship behaviour, before moving north again to their breeding cliffs in Greenland. It makes biological sense to arrive already paired, fertilised and ready to lay eggs, so that the breeding season can be fitted into the short Greenland summer.
The southward migration losses have not yet been calculated. The geese are legally protected in Greenland from 1 June to 15 August but nonetheless many are shot, especially in the Scoresby Sund region during the summer. The estimated kill by Inuit hunters is 500-1,000 barnacle and pink-footed geese (both species lumped together) each year during the 1980s.74 In Iceland barnacles are legally protected from 15 March to 1 September, but recoveries of ringed birds show that the law is not always respected. Figures published by the Icelandic Wildlife Management Institute show the following barnacle goose kills: 1995, 1,876; 1996, 1,619; 1997, 2,629; 1998, 2,283; 1999, 1,376; 2000, 1,412.75
Protection from shooting was provided in Scotland in 1954 but a special Order in Council, made in 1955, permitted shooting between 1 December and 31 January on all Scottish islands west of longitude 5° W. This order was apparently made to facilitate one ‘well placed’ individual on Islay.76 To begin with, about 200 birds were shot annually from the island population of some 5,000. Numbers killed rose to some 1,500 from a declining island population of some 13,000-18,000. Total protection was afforded to the geese under the Wildlife and Countryside Act 1981, but limited shooting on Islay continued under licences issued by the Scottish Office Agriculture, Environment and Fisheries Department. The licences were granted to protect crops from ‘serious agricultural damage’ by the geese. Over the period 1982-91 a mean of 792 (range 447-1,365) geese were shot annually, representing some 5.3 per cent of the birds then wintering on the island. Today there is reduced shooting (about 500 per winter from 2000) since the introduction of a scheme of payments to farmers based on a fixed sum per goose deemed to be causing damage. In Ireland the barnacle goose has been legally protected since 1976, although it was earlier protected at its principal haunt on the Inishkea Islands, Co. Mayo, where 50 per cent of the Irish wintering population occurred, from 1965 onwards by Game Birds Protection Orders made under the Game Preservation Act 1930.
With regard to the overall mortality from shooting of immature and adult barnacles in Greenland, Iceland and Scotland, the figures quoted above suggest an average annual kill of some 2,250 birds in the 1990s out of a total population of about 36,000 geese, a mortality of 6.3 per cent, representing nearly half of the total estimated annual mortality (see below).
Summer breeding success of the population is normally assessed on the wintering grounds by sample age-ratio counts – the proportion of first-winter birds in random samples of 50 birds, the convention for many years. Regular counting is carried out on their two principal wintering grounds, on Islay since 1958 and on the Inishkea Islands since 1961. On Islay the proportion of young birds in the winter flocks was a mean of 14 per cent for the 20-year period 1961-80, while on Inishkea it has been lower at 6.9 per cent over a 45-year period 1963-2007 (Fig. 144).77
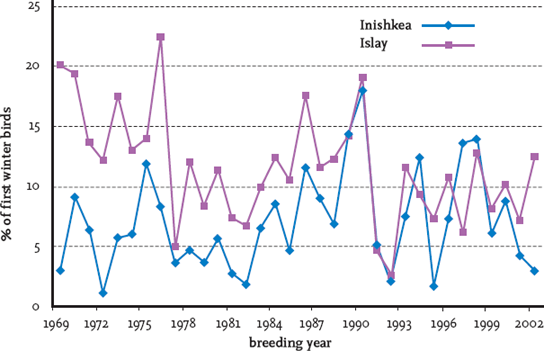
FIG 144. Proportion of first-winter birds on Inishkea and Islay for breeding years 1969-2002. From J. Worden et al., The Greenland population of the barnacle goose Branta leucopsis in Britain and Ireland 1956/57 to 2002/03 (WWT/JNCC, 2004). Reproduced with permission.
While age-ratio counts provide a key statistic for understanding population dynamics, they are subject to many potential sources of error, as discussed earlier in this chapter, including inconsistency between different observers, the timing of counts during winter, difficulty of distinguishing young birds from adults as the winter progresses due to progressive moulting, and other factors.
The second key winter statistic is mean brood size of successful adults. The number of goslings parents bring back to the wintering grounds is positively correlated with the proportion of first-winter birds in the winter flocks.
The data on the proportion of first-winter birds and mean brood size, along with total population counts, provide the basis for a model of the structure of the overall population. Any short-term anomalies arising from the open nature of the Inishkea wintering population, during which geese move to and away from the islands, will be smoothed out by the long run of continuous data. Taken over a long period the data can also be used to calculate mean annual mortality rates. During the period 1961-2005 the average structure of the population was approximately 6.9 per cent young birds in their first winter, the balance of 93.1 per cent being made up of geese more than one year old. Of these approximately 7.3 per cent were successful breeders, leaving a huge residue (85.8 per cent) that either did not attempt to breed – ‘skippers’ – or were unsuccessful breeders.
The large proportion of non-breeders and unsuccessful breeders determined on the wintering grounds is consistent with several observations made on the northeast Greenland breeding grounds.78 In 1956, an expedition found that approximately 98 per cent of adults (including some immature birds) either did not breed or bred unsuccessfully, and only six successful breeding pairs (broods of three, three and five, plus twelve young that were taken to represent three pairs) were found among 340 pairs. In 1961 and 1963 approximately 89 per cent of 1,634 geese recorded were unsuccessful in producing young birds. In 1974 91 per cent of 2,178 geese observed did not attempt to breed or failed to rear young.
Thus the Greenland barnacle population is characterised by an unusually large proportion of non-breeding or unsuccessful adults, and low rates of productivity and mortality. The incidence of non-breeding is not so high in the Svalbard population, where each year between 11 and 26 per cent of the adults do not establish breeding territories, while 49 per cent of females and 35 per cent of adult males of a 1972 cohort died without recruiting young into the next generation and only 15 per cent of the birds contributed half the next generation’s recruits.79
Mortality from shooting was formerly high in certain localities when the barnacle was a quarry species. Now protected throughout Britain and Ireland, overall mortality rates have declined to one of the lowest levels of all geese wintering in these islands. Using population census data, almost exclusively from Islay over the wintering periods 1985/86 to 1994/95, the annual adult survival rate was calculated at 86 per cent or, conversely, an annual mortality rate of 14 per cent.80 A more reliable method, based on the non-return of one bird of a pair of individually marked geese and involving 603 ‘pair years’, gave a figure of 83 per cent survival, an annual mortality rate of 17 per cent.81 An even higher rate of survival of 92 per cent, or 8 per cent annual mortality, was calculated from population census data from the Inishkea Islands for the years 1962–2003.82 However, we know that such estimates are subject to error due to the open nature of the population, with immigration and emigration throughout the winter, both on Inishkea and on Islay. An alternative estimate of annual mortality, based on annual resightings or loss of individually marked geese ringed on the Inishkea Islands, was 13 per cent, close to Islay’s 17 per cent (individually marked birds) and 14 per cent (gross population counts).83 Annual survival rates for adults and juveniles, once they have arrived back on Islay, are not significantly different.
More recent work carried out by Sarah Walley at Exeter University utilised a dataset based on 558 Inishkea Darvic-ringed adult geese, with 5,680 subsequent visual sightings between 1976 and 2006 used in the analysis. Using the capture-mark-recapture analysis programme MARK, she found there was no difference in mortality rates between males and females. Those that had been recorded at more than one wintering site over different wintering years had a survival probability of 0.91 (Table 86).84
| ANNUAL ADULT MORTALITY (%) | ||
| METHOD OF CALCULATION | ISLAY, ARGYLL, 1985–94 | INISHKEA,CO. MAYO 1962-2003 |
| Resightings of ringed birds | 17 | 13 |
| Resightings of ringed birds (Walley) | — | 9 |
| Population counts | 14 | 8 |
The establishment of accurate survival/mortality rates for different age cohorts of the barnacle geese is critical for the construction of a population dynamics model. But because survival/mortality and recruitment rates are constantly changing over time due to many different factors, coupled with the fact that the proportion of the mature geese successfully breeding varies from year to year, the construction of such models becomes something of a nightmare. However, what we do know is that mortality rates of the adults are relatively low compared with other goose species, somewhere between 8 and 13 per cent, and that the proportion of successful parents is similarly low, in the order of 7 per cent. Meanwhile, the overall population of Greenland barnacle geese has been increasing at the rate of some 4.5 per cent per annum over the past 50 years without any apparent density-dependent population checks as experienced by the Svalbard population. We have a mass of data on the individual breeding performance of individuals over their lifetime. These data show very spasmodic breeding success of the individuals. Hopefully within the next five years we will be able to better understand and model the population dynamics of this fascinating goose.
Mallard (Fig. 145), one of the most abundant and hunted duck in Britain and Ireland, are able to withstand considerable hunting pressures and high adult mortality rates to hold their overall population at a relatively stable level. Density-dependent population regulating factors have been demonstrated controlling the numbers in the population. These factors will operate most forcefully when shooting pressures do not remove the surplus ducks from the population. At present the environmental carrying capacity for mallard in Britain and Ireland would appear to have been reached. The index of wintering numbers in Britain, as determined by WeBS, has shown a slow decline since the early 1980s. The British maximum fell around 10 per cent from 2005/06 to 2006/07, its lowest level since 1977/78. Reasons for the slow decline are complex and include few winter immigrants, poor breeding success, fewer released birds and fewer cold-weather aggregations.85
Five key density-dependent factors concerning mallard population regulation were identified in a 16-year study carried out in Britain by David Hill:86
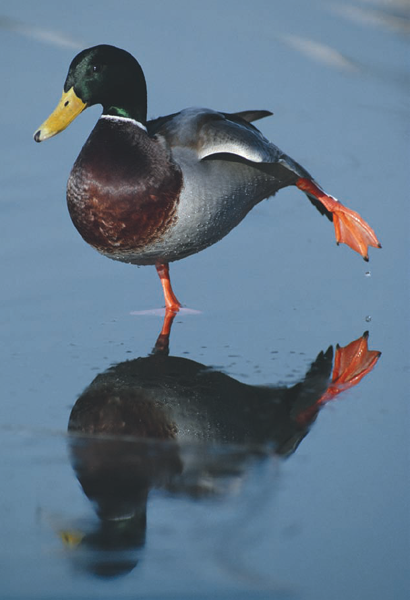
FIG 145. This fine drake mallard is engaged in a leg stretch, a classic comfort movement. (Eric Soder/NHPA)
Of the above, the survival of the ducklings during their first two weeks of life, when they are feeding on emerging aquatic invertebrates, was the key factor determining total numbers of young birds in the autumn. During the first month after hatching in artificially created lakes in southern Britain, ducklings were found to spend 50 per cent of their time feeding, and within their first two weeks 80 per cent of this foraging time was spent chasing or picking up insects from either the surface of the water or lake-side vegetation.87 Feeding experiments with newly hatched ducklings in an oligotrophic flooded gravel pit in Buckinghamshire showed a strong correlation between the growth of ducklings during their first four days and the number of invertebrates taken and total amount of protein eaten.88 If large numbers of young birds are produced, and the survival of these is high, it was found that a greater proportion of birds are unable to establish breeding territories the following spring through excessive competition.89 However, mortality of birds over the wintering period was also regulated in a density-dependent manner – the more birds there are in a specific locality the less food is available and the greater is the mortality.
Density-dependent factors can be modified by unpredictable variables such as fluctuating numbers of wildfowl – local and resident birds can be augmented by other mallard arriving either as hand-reared birds turned out for shooting or as genuine migrants, which may originate outside the country. During migratory movements large numbers may shift from a particular feeding area as food is eaten out. When food becomes sparse during the winter months there can be more localised, rather than true migratory movements. Thus these birds escape the density-dependent factors that were beginning to exert themselves for that specific locality. But escape from one locality and transferring to another feeding ground may compound such factors in the new location.
The clutch size is variable but normally 9-12 eggs. In a study of 180 mallard nests at Decoy Wood, Slimbridge, during 1961-63, the average size of early clutches was 12.6 eggs, later clutches 9.9 eggs. Hatching success of 2,293 eggs of wild nesting mallard at Slimbridge was 82.4 per cent, while the number of successful nests (hatching at least one egg) was 88.7 per cent.90 In another study at Chew Valley Lake, north Somerset, 1957-62, the mean brood size of 80-140 nests was 6.9 (range 4.9-7.9) and the number of young reared per successful female was 4.7.91 Broods from clutches of just under 9 eggs on a Buckinghamshire gravel pit declined from 6.5 at three days to just over 2 at fledging, representing a survival rate of 27 per cent when total brood losses were taken into account (Fig. 146).
At Sevenoaks, Kent, in a gravel pit reserve managed specially for ducks, production per breeding pair varied between 0.8 and 5.3 young, with a mean of 3.3.92 Using data from the national breeding waterfowl survey of Britain in 1980, a productivity of 2.7 young per pair was calculated.93 The number of young will be further reduced throughout the autumn and winter by mortality rates greater than those experienced by adults, to a level of 1-1.8 per pre-breeding adult.
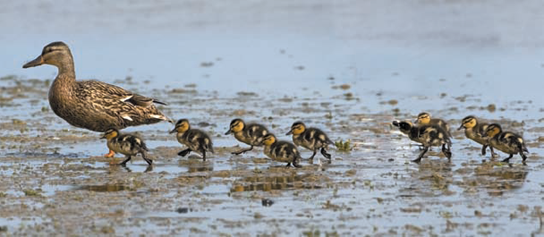
FIG 146. A brood of nine mallard ducklings will probably be reduced to two or three by the time they fledge. (Ernie Janes/NHPA)
Estimates of the overall breeding success of mallard can also be obtained by studying the ratio of juvenile to adult wings collected from birds shot. Wings were collected in Britain over a 15-year period, 1966-80, and a high productivity of young birds was established – 64.3 per cent young birds in the winter flocks. This was the highest productivity figure of nine species of duck (six dabbling and three diving ducks) studied. However, these data almost certainly exaggerate the proportion of young birds, which are more likely to be shot than older ones.
Generally speaking, of all mallard eggs laid, fewer than half (range 30-50 per cent) will hatch or produce young birds to fledging (50-60 days after hatching). Those that do survive to fledging will be further reduced by mortality, at an approximate rate of 70 per cent, before they reach one year old, the time of first breeding. Thus only a tiny proportion of all eggs laid will come through to produce an adult bird ready to breed. But to maintain a stable population each pair of mallard would only need to produce, on average, one young bird per year that will survive to breed.
In the 1980s David Hill calculated that the maximum sustainable yield (the numbers of birds that could be killed) from mallard populations in England was 29 per cent of the post-breeding population.94 It is hard to reconcile this with an annual adult mortality in northwest Europe of 48 per cent as calculated by Hugh Boyd, who also concluded that the mallard is not capable of sustaining its population if adult losses exceed a rate of approximately 55 per cent. The mortality rate for younger birds is much higher, estimated by Boyd for birds in their first year after fledging at about 69 per cent.95 Another study estimated mortality rates in north Somerset at 57 per cent for adults and 76 per cent for first-year birds over the period 1948–59.96 Other calculations of mortality rates by Hohn in the 1940s gave an annual mean adult loss of 65.3 per cent during the first year after ringing, with an average length of further survival after ringing of 1 year and 2 months. Mallards ringed as young had a mortality rate of 88.2 per cent during their first year of life, with an average period of survival of 4.5 months after ringing.97
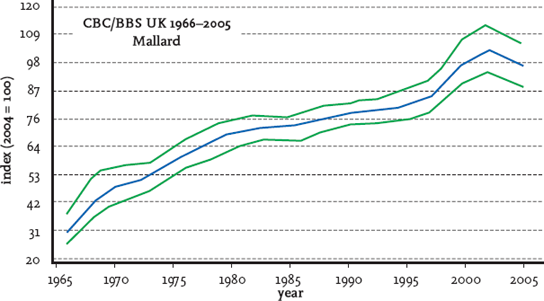
FIG 147. Breeding population changes for mallard in the UK 1966-2005. From S. R. Baillie et al., Breeding birds in the wider countryside: their conservation status 2007 (BTO, 2007). Reproduced with permission.
With such an apparent difference between the estimated productivity (64 per cent young in winter flocks) and mortality rates (48 per cent by Boyd) one would have expected the mallard population to have increased over the period 1966-2005, which it did, according to the BTO’s Common Birds Census and Breeding Bird Survey results (Fig. 147). The breeding population steadily increased from the mid-1960s until 1996 and from then onwards to 2002, the increase accelerated with the overall assessment of the long-term trend of a rapid increase. There has been a decline since 2003 that continued to 2006. Large-scale releases of hand-reared birds are thought to have been partly behind the population increases.
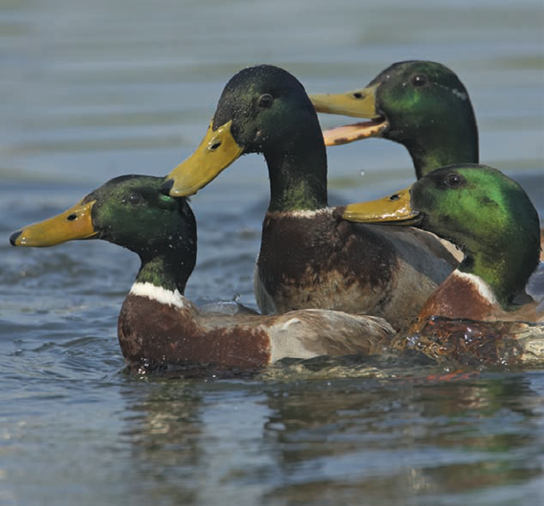
FIG 148. Mallard drakes exhibit a high level of aggressiveness when fighting over mates, territory and food. Fighting birds frequently grab each other by the back of the neck. (Bill Coster/NHPA)
However, the full annual story is more complicated, because winter populations, according to the annual indices prepared from data obtained from WeBS counts in Britain during September to March, have been in a slow continuous decline since the beginning of the 1980s. Numbers rose marginally in 1998/89, but thereafter continued their decline to the latest WeBS figures for 2006/07.98
Five key density-dependent factors have already been mentioned above. With regard to productivity of the breeding stock, the following four factors would also be operating: (1) emigration from crowded areas, reducing competition for nest sites and food; (2) an increasing number of non-breeding adults; (3) reduced hatching success through interference; and (4) reduced rearing success through competition for food (Fig. 148). With regard to mortality inflicted by shooting, if it is below the threshold level for holding the population in a stable situation then numbers will be controlled by natural mortality operating through the density-dependent mechanisms already discussed.
The overwinter loss in Britain is density-dependent, i.e. the more birds present in a particular area in September the more die or leave the area.99 Thus mallard numbers wintering in Britain are now limited by habitat availability, whereas for other duck species such as gadwall, northern shoveler, Eurasian teal and Eurasian wigeon this is not the case, as shown by the fact that populations over the long term (25 years) have increased.
As the movements and migrations of mallard can have such negative or positive impacts in population regulation, information on these variables is essential for a better understanding of the population dynamics. British and Irish breeding mallard are mostly sedentary. The majority of recoveries of birds ringed in these islands as juveniles and adults during the breeding season (May to August) show little emigration, with most birds recovered within 20 km of the ringing location after breeding. Movements of hand-reared mallard are less extensive than those performed by wild birds. In Britain 80 per cent of recoveries were within a 10 km radius of the ringing location.100 At Carton Estate, Co. Kildare, 738 hand-reared pulli and 60 adult mallard were ringed in July 1967. By August 1977 some 84 had been recovered, of which 68 per cent had been shot within a 10 km radius of Carton.101 Despite being of comfort to the wildfowlers who reared and released the birds, the addition or ‘leakage’ of these into the wild population raises issues of the introduction of possibly undesirable non-wild genes into the population. The introduction of these additional birds also intensifies the density-dependent factors operating on the wild population.
There is an increase in the number of mallard in Britain and Ireland from the autumn onwards, as shown by results from WeBS and I-WeBS. Recoveries of ringed birds suggest that up to 75 per cent of our winter population is made up of immigrants from the Continent. This is based on mallard ringed during the winter in Britain and Ireland, with 638 out of 863 recoveries coming from the Continent during the breeding season. These birds came from Fennoscandia, Russia, Poland, Denmark, Germany, the Netherlands, Belgium and France. The decline in the numbers wintering in Britain and Ireland may be due to a reduction in the number of continental immigrants. During the 1950s and 1960s the proportion of British and Irish winter-ringed mallard recovered on the Continent was above 50 per cent. This had fallen to less than 25 per cent by the 1980s.102 The decline in the number of winter immigrants could be associated with the reasons that are behind the decline of Bewick’s swans and European white-fronted geese wintering in these islands.
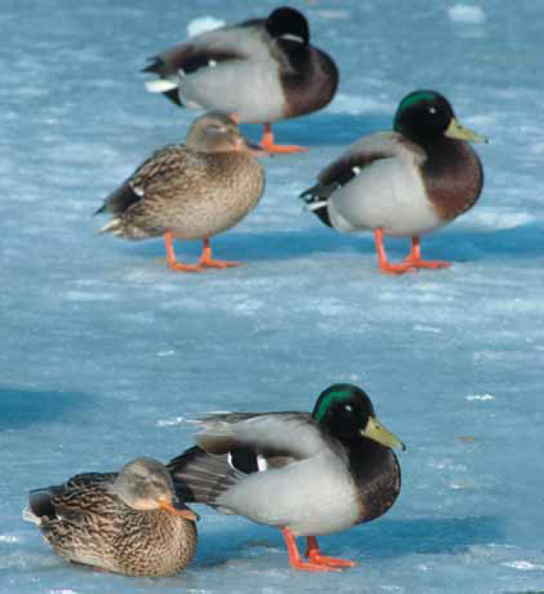
FIG 149. There is an increase in the number of mallard in Britain and Ireland from the autumn onwards. (R Sorensen & J Olsen/NHPA)
Recoveries of British- and Irish-ringed birds from Poland, Denmark and Germany show a significant imbalance of males (75 per cent of all recoveries), due to abmigration – males that have paired up with ‘foreign’ wintering females and are subsequently ‘dragged’ out of Britain to the female’s country of origin. Some Icelandic birds, from an estimated breeding population of 5,000 pairs, also winter in Britain and Ireland, as indicated by ringing recoveries.
In this chapter some aspects of the population dynamics of three contrasting species of wildfowl have been presented. The key issue raised has been the role played by density-dependent effects in the mute swan, barnacle goose and mallard. For each species complex factors are at work controlling the populations, and some are density-dependent. Both the mute swan and the barnacle goose are ‘capital breeders’, which impacts on their feeding ecology in a different way to that of the mallard, an ‘income breeder’. Mallard would have a more flexible approach than geese and swans towards preparation of their body reserves for breeding.
The mute swan can accommodate variations in mean annual adult mortality rates between 6 and 18 per cent while maintaining a stable population. When adult mortality rates are at the high end there are sufficient reserves of immature birds waiting in the wings to enter the population, either locally or as immigrants, to balance any deficit of lost adults. A high proportion of swans could also start breeding early, in their third year if necessary. A large amount of breeding potential, which could be triggered into action, also resides with the mature but non-breeding ‘skippers’. The reduction of breeding productivity noted in the CBC and WBS surveys – small clutch sizes and higher rates of egg and chick ‘failures’ – suggests that the population is beginning to be affected by density-dependent factors. It might be expected that breeding productivity will decline further if overall population numbers continue to rise.
The case of the Greenland-breeding barnacle goose is somewhat the same but different in many details. There is no evidence, as yet, of density-dependent regulation despite the continued growth of the population. However, if the population continues to increase at the rate it has been doing then density-dependent factors will inevitably start to regulate the populations. The Svalbard breeding population is already regulated by density-dependent factors, principally concerning the availability of food to young birds.
The mallard is a more complex case, and different from the mute swan and barnacle goose. Large numbers of hand-reared birds are annually added to the population each summer, but it has been clearly shown that recruitment rates of young birds into the population, thus affecting total numbers, are controlled by density-dependent factors operating during the first two weeks of the ducklings’ lives as they compete for food resources. The balance between recruitment and mortality is also complicated by the large numbers of continental winter immigrants and the effects of abmigration.
a Includes failed nests.
b Number of cygnets per pair that survive to June the following year.
c The difference between the number of cygnets per pair surviving to breeding age and the number of adults dying per pair per year.
+ Not available on a per brood basis. Survival of first-year individuals from September to the following June was about 68 per cent; thereafter about 90 per cent per annum.
* Not available.