It is perhaps inevitable that at least one chapter of the book is a numbers-based issue. As a qualified accountant these are familiar to me and easy to interpret and understand, but many business owners tremble at the thought of getting to grips with their financials.
This chapter will focus on just a handful of financial indicators to show where businesses fail to make the profits that they should and could make. Some points are about you understanding your own costs, others are about identifying true selling prices, and between the two falls the profit.
The vast majority of business owners and managers cannot properly read a set of financial statements. In truth they don’t need to, but they should at least have some basic financial understanding of what a set of accounts tells them, and how various simple business actions impact profit. If a lawyer said most clients don’t really understand law or a doctor said most patients don’t understand medicine you wouldn’t think it strange. The problem is that many people in business think that they should have some innate financial skill and are just too embarrassed to own up that they don’t and to ask for help.
However, the intention here is not to embarrass anyone. If you are not naturally numerate, or you have concerns about your understanding of some of the financial implications of various actions suggested throughout the book, just find someone that is numerate and can help you get a grip on your numbers. The diagram in this chapter is intended to be a simple representation of the key issues, but for the non-financial reader it still may hold some challenges to truly understand. So if you don’t get the points easily, share it with someone in your financial team and try to use numbers relevant to your own business and the issues should jump out at you. That may be your in-house bookkeeper or accountant, or it may be an external accountant.
This chapter includes:
- You need to know the numbers.
- Not all customers make you money.
- Steps in the profit calculation.
The critical point for anyone involved in running a business is that if you want to increase its profits, then you will need to know your financial numbers to know what to do and to measure whether it has worked or not.
When working with business owners and managers to improve profits, there is often a point where a bold suggestion is made to the team in a business to address an issue. This may be something like, discounting prices doesn’t work, cutting prices by 10 per cent will need you to increase sales volumes by 50 per cent to make the same profit you used to make before the price drop. Often someone will question that statement and want to see the maths proven. This is OK, and in fact it is much better than the alternative, which is that they don’t agree but simply stay silent for the fear of being caught out.
Now, I can prove the maths. Chapter 10 addresses the madness of discounting and includes the great grid showing the impact of dropping prices at various different profit margins. The maths of every number on these diagrams is easy to calculate. A further example of this is below:
A business buys one style of trampolines at a cost of £200 and sells them at a price of £400, it is therefore making £200 profit or a 50 per cent margin. They sell 100 of these trampolines a year so turnover on this product is £40k, the total cost is £20k giving £20k profit at the 50 per cent margin.
If they cut their prices by 10 per cent, and sell the next 100 for only £360 each then the turnover reduces to £36k. However, the costs of these 100 items remain the same at £20k and the profit therefore drops to only £16k. Unless sales volumes do increase they have just lost £4k. Really, any result below the original £20k profit would make this a big mistake, so the question is, how many more do they need to sell to get back to where they were?
To get the profit back up to £20k they need to make another £4k profit, and at the new prices that will be 25 more trampolines; ie the price of £360 each, less cost of £200 equals £160 profit. So £4,000 divided by £160 requires 25 more units to get back to where they started. That means 125 units to achieve the same result as before.
If you are running any business, you need to consider these numbers for each one of the products or services you sell. If you drop the prices by £x on item A, how much more of it do you need to sell to get back to where you started? Or if you raise the price of item B by x per cent how much volume can you afford to lose before you are worse off? These numbers are not experiences, or judgements, they are mathematical facts.
As a business decision-maker, you are then required to make a subjective judgement of whether these calculated volume changes are likely to happen with an increase or fall in price, but that is a judgement based on the financial facts, not a judgement based on guesswork.
Many salespeople will say something along the lines of if we drop prices by 10 per cent we will sell more and be better off. An instinctive judgement but without financial facts. If we are able to establish the facts (say):
- Current sales volumes 100 units pa
- Cost £200 each
- Price £400 each
- Margin 50 per cent or £200 profit per unit.
We can then calculate that a planned 10 per cent price drop reduces the margin to only £160 per unit, and that we will need to sell 25 extra units to get back to where we started. Then the only subjective judgement is whether selling 10 per cent cheaper will lead to increased sales volumes of an extra 25 per cent.
What every business needs to do is to establish facts and limit the areas of subjective judgement or instinct. In most cases the reality becomes obvious; ie in the example above, it is very common that in the absence of facts a decision would have been made to drop the prices based on the broad assumption that volumes would increase and so would profits. But as soon as the reality of needing a 25 per cent jump in volumes has been calculated, not even the most optimistic salesperson would think it was a smart move. Even if they did, then that becomes a clear and measurable target for the salesperson; ie if you want to drop the price by 10 per cent, then you need to deliver a 25 per cent improvement in volumes. Good luck!
Not all customers make you money
Chapter 8 had a section entitled every customer is worth having and every sale matters. This considered the idea that most businesses have a wide range of customers they serve, from the regular, high-spending, quality customers who appreciate value for money and are prepared to pay the prices that you ask, right down to the low-spending, once in a blue moon, always-complaining variety.
It explored the idea of trying to determine a value for each customer served, whether based on spending, profitability, or even just the hassle factor of dealing with them. You then need to decide the point at which it is just not economic to deal with a customer; ie a highly demanding customer that generates a low profit may not be worth the hassle and cost for the small profit you earn. Armed with this data showing a value for each customer and having determined the line below which you are probably losing money, it is a simple exercise of listing the customers and seeing who is below that line.
Once again there is subjectivity to the assessment that the decision-makers in the business need to apply, but the details in Chapter 8 show that most businesses lose money on the bottom end of their customer list. This is a little easier in business-to-business organizations with account customers, as the history of transactions is clearer to see customer by customer. However, the logic applies to retail businesses as well, it is just harder to make some of the judgements when customers are to a great extent anonymous. Even in these businesses we need to try and segment groups of customers into frequent high spenders, frequent low spenders, occasional high spenders and occasional low spenders. We then aim to get the low spenders spending more each time and the occasional customers spending more often. Without this data, it is very hard to develop and implement any specific strategy to improve.
In the B2B businesses where the information is more readily available it is just a question of determining and applying some rules that encourage the poor-quality customers to spend more, pay more, or to leave. This can be done by setting prices higher at the start, or by restricting discount percentages or the situations in which they apply. Some businesses have implemented retrospective discount policies so that customers only get their 20 per cent off after they have purchased, and paid for, £1,000 worth of goods (or whatever level they set in their organization).
A number of retail businesses have created a variation of a membership scheme (not quite as grand as the Tesco Clubcard but the same idea) where they promise customers who join special deals. Some of these deals are special prices on bundles of products, some are access to training and demonstration events, or perhaps free delivery on spending above £x. Although often done more as a marketing tool than a customer segmentation device, this has a number of benefits. First, it gives you the details of what were previously anonymous customers – email addresses, decision-makers’ names, etc – that help you build a history of spending from that customer in future. It also gives you a direct list of customers to whom you can promote special deals.
One such business is a large chain of butchers. They have 99 per cent retail customers who walk into any one of their stores to buy fresh meat and related products. They developed a membership club called The Ruby Club, which now has 14,000 members on the database. The company can track spending habits, promote specials offers and prompt with ideas for summer barbecues, Easter, Christmas and Valentine’s meals and much more. Every time they send an email there is a definite spike in sales for the items being promoted.
How does a members club apply to price? What this enables the business to do is to generally raise prices for all customers, so that all of the infrequent, small-spending customers may pay, say, 4 per cent or 5 per cent more on what they buy. Members then get access to special prices through their membership, which brings them back down to the original prices, or if they spend enough, slightly below. The idea is that you don’t give automatic discounts to everyone (by virtue of generally lower prices) but only to those customers who earn it. Building membership arrangements allows retail businesses to achieve this.
If a non-member complains about the price, the answer is simple – join the club if you want the best deals. This allows the owner to continually prompt for extra business, and continue to build knowledge and data on its customer base.
The problem is real, and almost certainly applies in your business. You lose money on probably the bottom 25 per cent of your customers because the profit from that occasional, low-value sale just isn’t enough to cover the true costs of doing that transaction.
So if you are in a B2B type of operation, do the numbers and set a point below which it is uneconomic to do business. Anyone below that is looked at to either increase the price or to increase the volumes to get them above the line, or they are encouraged to go elsewhere.
In a retail or B2C business, you still need to try and adopt the same mentality that a section of your customer base loses you money each time they do business with you. If they are anonymous, that is hard to deal with, so why not capture their details in some form of members club. Failing that, put prices up and offer discounts only when a customer spends more than £x.
Steps in the profit calculation
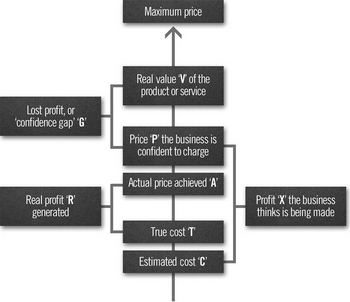
The series of diagrams below shows the differences between the profits businesses think (or pretend) they are making, and the profits they actually make. It also looks at the profit they could make if they had the confidence to charge what they are really worth, or perhaps even to improve the quality or features of what they currently offer to their customers. It is complicated so we will take it one step at a time.
It charts a line that could be the price of any product or service. As the price ‘P’ increases towards the maximum price, the profit ‘X’ will also increase.
FIGURE 14.1
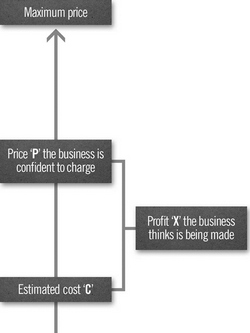
The starting point on the diagram is estimated cost ‘C’, which is what the business has assessed as the cost of buying or producing what it is that they sell. The second number is the price ‘P’ that the business is currently confident to charge, which is the overall sales value that it thinks it achieves from its transactions with customers. The difference between these two is therefore the profit ‘X’ that the business thinks is being made. We will address the thinks point later.
Therefore if the business had an estimated cost ‘C’ of an item at £75, and sold at a price ‘P’ of £100, then they would be making a profit ‘X’ of £25 and a margin of 25 per cent. Simple.
For any business it is therefore essential to ensure that we sell at a price above cost, otherwise we are making a loss. I know that is obvious, but you would be amazed how many businesses don’t manage to do this. Some, to be fair, make the mistake by accident, while others actually do it deliberately.
To truly understand the profit equation better we need to analyse the numbers in a little more depth:
Let’s look at those businesses that sell at a loss by accident.
If you are in a business where you buy in an item, let’s say a new car for £18,000, then you know exactly the cost and that you need to sell for a price of at least £18,001 to make a profit. But what if you do not buy the car, but instead you manufacture it from raw materials, or perhaps you are in a business that provides knowledge, experience or just time. How do you work out the cost then?
In a good business you should still know the cost of what you sell by monitoring the costs of each element of the process – the raw materials, use of machine time, labour hours, etc – and having the accountant work out how overheads and other expenses should be shared over the products made. Sadly, very few owner-managed businesses have this level of financial control and are therefore working in the dark as to the true cost of the product or service they sell. If that is you, then you need to get your advisers involved and work out accurately your true cost.
Even if you are able to accurately identify the basic cost of what you sell, many businesses still underestimate the peripheral costs of serving each customer. One large business uses the term cost to serve. They quantified the additional costs of getting stock in to the business (purchasing department salaries, delivery costs, etc), the cost of holding the stock on the shelf (insurance, funding, wastage, pilfering, warehouse rent, etc) and the costs of selling and delivering (counter staff wages, delivery costs, etc). Finally, an often-missed area is the cost of waiting to be paid (funding, debt collection costs, postage for statements and bad debts, etc). Their calculations suggested that there was a big difference between the estimated cost ‘C’ that they normally considered, and the true cost ‘T’ (see diagram below) of the sale. On average the true cost was 5.8 per cent higher than the estimated cost. Whatever the calculation or the terminology you use, the key point is that the cost of the item is not the only cost you incur to do that deal.
FIGURE 14.2
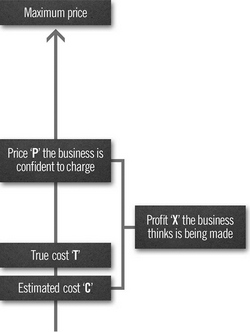
The diagram now shows this true cost ‘T’, which is always slightly, or sometimes a lot, higher than the estimated cost ‘C’ that the business was using to work out its profit. When you know this number you will almost certainly find some products and some customers where the profit margin doesn’t cover these extra costs. In the example above they concluded that the true cost of items was 5.8 per cent higher than the estimated cost, but some frontline people were doing deals at 5 per cent margins in the belief that this was still profitable business.
So knowing accurately the true cost of what you sell is a critical start point.
It is entirely understandable that businesses that do not have this information may sell at a price that does not reflect the true cost. If challenged by a customer the salespeople may lack the confidence to stand their ground as it may appear to both the salesperson and the customer that the business is making more profit than it actually is.
The answer for this group of businesses who are mistakenly selling at a loss is to get better financial information to calculate their true cost and ensure that every sale is really generating profit. Many businesses now enter the cost onto the computer systems as the amount they actually pay to buy the item, and then add a standard uplift of, say, 5 per cent or 10 per cent to reflect an educated guess for all the peripheral expenses of handling whatever it is that the business sells. This is a simple approach that you could adopt immediately with little difficulty.
But what of those selling at a loss deliberately?
Covered in great depth in Chapter 8, the key issue is that some business owners and decision-makers genuinely believe that selling product A at a loss can be justified as it then results in selling more of products B, C and D, for example. It very rarely does and is a strategy that must be very carefully considered before being adopted.
In terms of the diagram, the key issue is that the estimated cost is very often lower than the true cost, and as a result the business isn’t making as much profit as it thinks it is.
More about this shortly, but for the moment let’s consider the price the business is confident to charge.
This should be a simple area, as most businesses at least know what they are charging their customers. However, I have seen countless businesses where I ask the owners, CEO, directors, etc, what the price of various items are, and their understanding is quite different from reality! This is occasionally where prices have crept up and the decision-makers are out of date, but more often than not it is that prices have been eroded over time and various products and services are being sold at less than expected.
However, there is normally some clarity that the business has a set of prices that are understood and broadly used, based on what it thinks it can reasonably charge in the marketplace. If you don’t have that clarity, then you really need to get it. If you have a business where no one really knows what the prices should be and as a result frontline people are using best guesses, judgement, instinct or any other random determination of what they will charge, then you really do need more structure and control.
The key point to be understood is the price actually charged. Once again, other chapters have explored this area in more detail and looked into aspects such as discounting to make the sale, early settlement discounts to prompt faster payment and a number of other ‘adjustments’ that reduce the price quoted or published to the actual price achieved ‘A’.
FIGURE 14.3
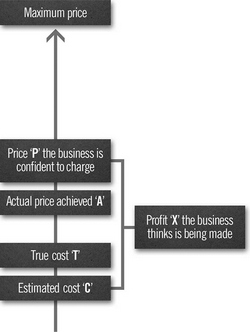
This is where many businesses go wrong. They use figures they believe are correct, but which just aren’t.
One business identified the price they had set for more than 5,000 items that they sold. For each one they established the true cost, and the average discount that had been given over the previous financial year. They were astounded to see that on more than a quarter of these items they were giving more discount than the margin they were expecting to make, and as a result they were actually selling them at a loss.
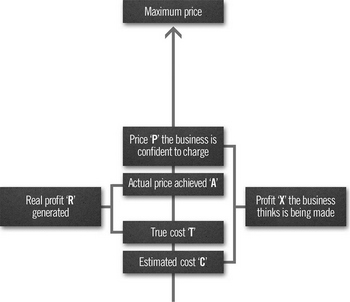
What you can now see after placing the boxes for the true cost ‘T’ and the actual price achieved ‘A’ on to the diagram, is that the business is not making the profit ‘X’ that it thinks it is. The real profit ‘R’ is always less than the business expects.
Let’s put some numbers on this to make it clearer:
• Estimated cost ‘C’ |
£75 |
• True cost ‘T’ |
£80 |
• Price ‘P’ the business is confident to charge |
£100 |
• Actual price achieved ‘A’ |
£95 |
Using these numbers we can see that the business thinks it is making a profit ‘X’ of £25 on £100 of sales, or a 25 per cent margin, when in fact it is only making a real profit ‘R’ of £15 on £95 of sales or just 15.8 per cent. That means they are making £10 less profit than they thought they were.
In many businesses the difference between the price ‘P’ a business thinks it is achieving and the actual price achieved ‘A’ that it does get, can easily be as much as 20 per cent, and the difference between the estimated cost ‘C’ and the true cost ‘T’ can easily be 10 per cent.
The key is that if you are 20 per cent lower on price than you think, and 10 per cent higher on cost, the difference between the profit ‘X’ you think you are making and the real profit ‘R’ that you actually make, can be absolutely huge. You need to know these numbers.
There are a couple of further elements to consider.
Real value
Throughout the book we have talked about the idea of a scientifically calculated price that reflects the real value the customer gets from any product or service. This is a combination of the benefits that they get from the item, alternative prices of competitors, the cost of substitutes, etc. Let’s just say that this is the price that you would charge if you were able to read the mind of the customer to see how much they would really be willing to pay you.
Clearly it is not possible to look up this figure in a book, or even create any formula yourself. The only way to establish the real value of what you deliver to your customers is a process of trial and error and of elimination to get to the point where customers stop buying and go elsewhere. You can, of course, ask them for this information, and you will get some useful feedback, but rarely will a customer tell you the maximum price they will pay. That is your job or the job of your sales force to determine, by testing the prices, pushing the boundaries and carefully handling the situations where you hit the point where customers react.
There is almost always a huge gap between the actual price achieved ‘A’ by any business and the real value ‘V’ that they deliver to their customers. This is shown on the next diagram as the confidence gap ‘G’. This is because it simply arises from the business’s lack of confidence to charge the maximum price that it can.
Earlier chapters have covered this ground, but it is essentially the fear of what might happen if a business sets its prices too high that prevents them from pushing the boundaries and squeezing their prices up. Obviously every penny lost in this confidence gap would otherwise go straight to the bottom line of profit as there are no costs associated with getting this extra revenue.
A great strategy for many businesses is to simply try to ease up the price by very small increments on the basis that it just eats into this confidence gap and will therefore have no impact on the volume of sales or even the satisfaction of customers.
There are a number of different ways to gradually try to ease up the price, many of which are covered in earlier chapters. The basic point is that very small changes that are well explained simply do not affect the customer’s appreciation of value.
Many business owners, having resisted the idea and made all sorts of excuses, have been amazed at the total lack of response from customers once they were eventually persuaded to have a go and stick the price up. The confidence gap is often 10 per cent, 20 per cent or even over 30 per cent of turnover, and to ease up the prices by 2 per cent, 3 per cent or even 5 per cent quite often doesn’t register with the majority of customers.
The staggering part is the potential profit increases that can be achieved.
Take a modest business turning over just £500k pa. It has a cost of sales of say £350k and overheads of another £100k, leaving just £50k profit on the bottom line.
If the confidence gap is 10 per cent, 20 per cent or even 30 per cent, then they may be able to easily get away with a price increase of, say, 5 per cent with no impact on volume of sales or even triggering any kind of customer reaction at all. If they could, then all of this price increase would go onto turnover adding £25k, with no change to the Costs, therefore adding £25k straight to profit. This represents a 50 per cent uplift!
But what if the business could get the entire confidence gap? If it were 30 per cent, this would add £150k to profits, in effect quadrupling them. I have seen many businesses that have achieved this kind of dramatic impact on the profit, and some of these businesses would perhaps not even still be here if they hadn’t implemented the changes!
Maximum price
Is this the end of the line? If they have got their price as close as possible to the real value then is that as far as a business can go?
No.
The final level is to try and move the real value as far as possible to achieve the maximum price possible for the goods and services being provided.
There are very few businesses that could not improve their customer service levels. If we work on all the possible aspects where we can improve what we do, then we may be able to move the value we deliver further. This may include direct customer service issues such as the way we answer the phone and the way we meet and greet customers who walk in. But it also extends to the after-sales processes, such as how we collect the money and how we deal with problems.
My favourite is the idea of the free return ticket that we put in place at the tourist attraction. In outline we put the gate prices up by over 20 per cent and wanted to add some value to justify it. We did this in part by offering the visitors free return entry as many times as they wanted within the next seven days. Obviously we had moved the real value up significantly by allowing in effect seven entries for the price of one, getting as close as we can to the maximum price that we could achieve. These returning visitors then spent money on food, drinks, ice creams, souvenirs, etc, because their subsequent visits were free, so that the average spend per head also increased.
What this chapter explores is the basic logic that only selling at a price above the cost of an item will generate a profit. CEOs, directors, business owners and managers will know this already.
In considering this simple sum it also looks at the problem that many businesses are working with inaccurate figures for cost, and inflated expectations of the price they will actually achieve, and you can see how wrong decisions get made.
Let’s call the difference between the profit ‘X’ the business thinks is being made, and the real profit ‘R’ generated, the expectation gap. In the simple example earlier this was the difference between the profit they expected to achieve of £25 and the profit they actually made of £15. In some ways it is nothing more than a wake-up call to explain to those who need to know, why the profit is lower than expected. However, as soon as you identify the reasons why your true costs are slightly higher than your estimated costs, or why your actual price achieved is lower than the price you thought you were charging, then you have a chance to work on reducing the gap. Once again the significance of knowledge is explained simply as:
What you can measure you can manage, and what you can manage you can improve.
You need to have accuracy in the financial information you use to make the right pricing and other decisions in your business.
It isn’t as simple as this, though, as we also need to consider the gap between the value that these decision-makers place on what they sell – the price they charge – and the value that the customers may actually place on it. Fix this and there is potential to squeeze profits up even further. This under-pricing is down to a lack of courage to charge what the product or service is really worth, and this is why it is referred to as the confidence gap.
What you need to do is to find ways of establishing the size of the expectation gap and the confidence gap, and then use the other chapters in this book to identify ways to reduce them.
Only you can determine whether you are sufficiently numerate, or have the right resources on your team, but if you don’t, then find external input to get the clarity that you need.
1 Share the diagram with your pricing team and ensure that everyone understands the potential causes of the expectation gap, and the confidence gap.
2 Get the pricing team to do a review of your top 10 products or services and get them to consider the key elements of the diagram in relation to these; ie:
– What is the estimated cost ‘C’ for the item and how does this differ from the true cost ‘T’?
– Where do these extra costs arise and how are they incurred and controlled?
– Quantify the difference between the price ‘P’ being charged and the actual price achieved ‘A’.
– If discounts are a key cause, refer to all the actions in the chapter on that topic, or identify the other factors creating this variance.
3 Based on the information generated in 2, ask the pricing team to develop and implement a plan to manage and reduce the impact of these issues on your profit margin.
4 Ask the pricing team to undertake some customer research to try and establish the potential magnitude of the confidence gap. This could include:
– A generic customer survey of a selection of clients, part of which asks for an indication of the value being delivered on a scale of 1 to 10. Scores consistently at 7 or above would indicate that customers’ perception of value is high and that you may be able to move prices up.
– Run a Customer Advisory Board. This gets a key group of important customers into a room to discuss various aspects of what you do and what they would like you to do. It can ask for feedback on customer service and product range as well as their perception of how the Value Scales currently look.
– Test some changes on clients who you are comfortable may opt to leave; ie ones below the line where it is economic to do business with them.
5 Based on your findings in 4, ask the pricing team to develop changes to your current pricing strategy to seek to close the confidence gap.
6 To help you get some enthusiasm for the work, calculate what the impact would be on your bottom line of addressing these issues; ie what would be the improvement in your bottom line profit if you were able to raise prices and lose no customers at all, using, say, 1 per cent, 2 per cent, 5 per cent and 10 per cent increases?
Using the earlier example of a £500k turnover business making £25k on the bottom line, the results would be:
|
Price increase |
Impact on turnover and profit |
Per cent growth in profit |
|
1 per cent |
£5,000 |
20 |
|
2 per cent |
£10,000 |
40 |
|
5 per cent |
£25,000 |
100 |
|
10 per cent |
£50,000 |
200 |
Download the iPad App to explore these issues for your business.