![]()
A Powerful Contrarian Approach to Profits
ONLY DIE-HARD New Yorkers or sports masochists—I guess I fall into the latter category—rooted for the New York Giants in Super Bowl XLII. The bookies put the odds at an enormous 17 points favoring the New England Patriots. This meant that if you wanted to bet on the Patriots and collect, they would have to win over the Giants by more than two touchdowns and a field goal. So confident were the public and the experts that this would not happen that The Boston Globe had already begun preselling a book on Amazon.com. It was entitled 19–0: The Historic Champion Season of New England’s Unbeatable Patriots. To be released immediately after the inevitable win.
The fans and sportscasters believed it was a mismatch of almost historic proportions. The Giants, underdogs by far entering the playoffs, thought otherwise and made it through to the championship round. In February 2008, a TV audience estimated at more than 50 million saw a hard-fought game. When it was over and the artificial dust had cleared on Super Bowl XLII, the Giants had beaten the mighty Patriots. It took a Giants touchdown in the last thirty-five seconds of play to seal the Patriots’ fate, but that’s what happened, and it sent the stunned fans into a state of shock.
How could the most powerful football team in decades be reduced to such an ignoble outcome? Many money managers and other professional investors, immaculately dressed in their Paul Stuart suits and Ferragamo ties, sitting in their well-appointed offices, flanked by the latest and most powerful market technology of the day, must wonder the same thing: how can they perform so dismally when they buy the top research and investment advice?
It must be a real puzzle to them.
But . . . are the stocks the experts like really the ones to buy? We have seen that the answer is a strong no. The favorite stocks of analysts and money managers are consistently punished by earnings surprises, while the stocks nobody loves or wants just as consistently benefit from surprises. Investors’ enthusiasm often causes popular stocks to become overpriced, while the lack of it dumps them into the bargain basement. Earnings and other surprises result in a reevaluation of both groups and more realistic pricing.
This is certainly a large, critical piece of the puzzle, but how do we fit it into a practical investment strategy? After all, we’re not just trying to analyze market dynamics; we’re seeking to learn patterns of how to profit from them. For a change, rather than trying to build a deductive case, I’m going to put the answer right out on the table for your inspection. While I’m at it, let’s identify the core of this proven investment approach and make the next Psychological Guideline.
PSYCHOLOGICAL GUIDELINE 21: Favored stocks underperform the market, while out-of-favor companies outperform the market, but the reappraisal often happens slowly, even glacially.
This reevaluation process, heavily influenced by the new psychological findings of Affect and neuroeconomics, is the key to large and consistent profits in the marketplace. From the dawn of markets, people’s reaction to “best” and “worst” investments has been consistent and predictable. And here we come to the bottom line for the practical reader: investors’ behavior is so predictable in this respect that the average reader can take advantage of it. There are proven yet uncomplicated contrarian strategies that should allow you to outperform the market handily, with relatively little risk.
In this part we will present a new paradigm (or model) of investing that will both utilize the state-of-the-art psychology we viewed in Part I and combine it with investment methods based on it that have proved highly successful over many decades. The methods also rely on us to disregard some of the conventional teachings we have received about how we should evaluate stocks, bonds, or other investments. But they are anything but bugle blasts ordering you to follow the new knowledge blindly. Each has been proved over time either by psychology or by superior investment performance.
Sounds a little heady, doesn’t it? Now let’s start at the beginning and see exactly what’s behind these assertions. We’ll begin with a bit of discussion to reveal the elemental structure, function, and statistical justifications of five major variations on the contrarian strategies, each highly successful to date. Using this key, you’ll see how the pieces of the puzzle rapidly fall into place—although I’m afraid it won’t get you a discount on one of those Paul Stuart suits or Ferragamo ties. The five important strategies are:
1. Low-price-to-earnings strategy
2. Low-price-to-cash-flow strategy
3. Low-price-to-book-value strategy
4. High-yield strategy
5. Low-price-to-industry strategy
Each of these strategies has a number of subcategories to allow you to custom-tailor it to your own requirements. Strategy 5, a very new and different type of contrarian strategy, will be introduced in chapter 12.
What seemed apparent from our review of experts’ forecasts is that the companies they liked the best tended to be the wrong ones to buy. Therefore, let’s ask another question: should you avoid the stocks the experts and the crowd are pursuing and pursue the ones they are avoiding? The answer, as we shall see, is an unqualified yes.
And we can document the consistent success of this investment strategy going back almost eighty years, a strategy that dramatically opposes conventional wisdom—a prime reason it works.
For the findings show that companies the market expects the best future for, as measured by the price-to-earnings, price-to-cash-flow, price-to-book-value, high-yield, and low-price-to-industry strategies, have consistently done the worst, while the stocks believed to have the most dismal future have always done the best. The strategy is not without an element of black humor. In fact, to the true believers at the shrines of efficient markets or other contemporary investment methods, the approach may appear to be a form of Satan worship: the “best” investments turn out bad, and the “worst” ones turn out good.
However, the findings are not in the least magical and don’t contain even a trace of voodoo. Most investors do not recognize the immense difficulty of predicting earnings and economic events, and when forecasting methods fail, a predictable reaction occurs. Here we confront the main irony: one of the most obvious and consistent variables that can be harnessed into a workable investment strategy is the continual overreaction of people to companies they consider to have excellent or mundane prospects. This works just as surely with investors today as it has worked with investors in any market in the past.
In order to make evaluations of “best” stocks, forecasts extending growth well into the future must be made with extreme accuracy. As we saw in chapter 8, the reliability of these forecasts is ridiculously low. We also know that when the earnings of a favored company fall below the forecast, the earnings surprise, even if it is minute, has a devastating effect on its stock prices. Not surprisingly, investment strategies based on precise estimates have performed erratically, to say the least. There is a Boot Hill full of Internet names from the 1996–2000 dot-com bubble, as well as a Boot Hill containing similar stocks from earlier bubbles and another one of “must-own” concept stocks to be bought at any price.
The term “best,” used by so many professional and individual investors, also filters out the inherent risk of the situation. Conversely, the lowest-visibility stocks have been shown to be significantly underpriced and, when they have positive surprises, are subject to sharp upward reappraisals. As we saw in chapter 2, inherent risk is understated for high-expectation situations; it is often exaggerated, sometimes dramatically, for low-expectation stocks. This puts the master key of the book into our hands—and explains why the investment strategies that we’ll examine work remarkably well over time.
Beginning in the 1960s, researchers began to wonder if visibility—the crucial pillar of modern security analysis—was actually as solid as generally believed. The original studies were done with price-earnings ratios because of their ready availability in the early databases. One of the first of those researchers asked, “How accurate is the P/E ratio as a measure of subsequent market performance?”

Francis Nicholson, then with the Provident National Bank, was the interrogator. In one comprehensive study done in 1968 that measured the relative performance of high- versus low-P/E stocks, he analyzed 189 companies of trust-company quality in eighteen industries over the twenty-six years 1937–1962.1 The results are given in Figure 10-1.
Nicholson divided the stocks into five equal-sized groups according to their P/E rankings. These quintiles were rearranged by their P/E rankings for periods of one to seven years. When the quintiles were recast annually on the basis of new P/E information, the stocks most out of favor showed a 16 percent annual rate of appreciation over the total time span. Conversely, switching in the highest P/Es on the same basis resulted in only a 3 percent annual appreciation over the period. Although the performance discrepancies were reduced with longer holding periods, even after the original portfolios were held for seven years, the lowest 20 percent did almost twice as well as the highest.
With remarkable consistency, investors misjudged subsequent performance. The results are completely uniform. The most favored stocks (quintile 1) sharply underperformed the other groups, while the least popular (quintile 5) showed the best results. The second most popular quintile had the second worst performance, while the second most unpopular quintile had the second best results.
Benjamin Graham’s The Intelligent Investor cites a second study, this one involving the thirty stocks in the Dow Jones Industrial Average (Table 10-1). The performance of the ten lowest- and ten highest-P/E stocks in the group and of the combined thirty stocks in the industrial average was measured over set periods between 1937 and 1969. In each time span, the low P/Es did better than the market and the high P/Es did worse.
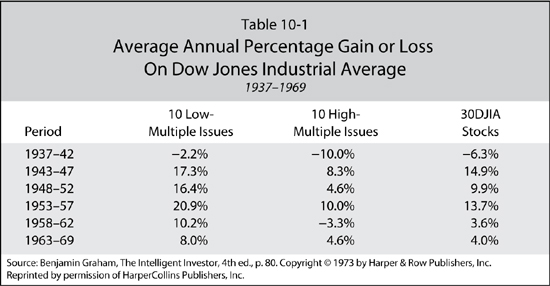
The study also calculated the results of investing $10,000 in either the high- or low-multiple groups in the Dow Jones Industrial Average in 1937 and switching every five years into the highest P/Es (in the first case) and the lowest P/Es (in the latter). Ten thousand dollars invested in the lowest P/Es this way in 1937 would have increased to $66,866 by the end of 1962. Invested in the highest P/Es, the $10,000 would have appreciated to only $25,437. Finally, $10,000 invested in the stocks of the Dow Jones Industrial Average would have grown to $35,600 by 1962. (Some thirty-five years later, Graham’s findings were reintroduced as a hot new investment strategy, “The Dogs of the Dow.”)
A number of other studies in the 1960s came up with similar findings. The conclusion of these studies, of course, is that low-P/E stocks were distinctly superior investments over an almost thirty-year period. But theories, like sacred cows, die hard, so these findings created little stir at the time.2
If the low-P/E results were analyzed at all, they were criticized. For one thing, the growth school has always had a major following among investors. Many institutional investors could not bring themselves to believe the efficacy of the findings. After all, like the studies that discredited earnings forecasts, these findings did seem, cavalierly, to toss aside our years of practice (or perhaps brainwashing) to the contrary. When I published a paper in early 1976 summarizing some of the previous research, a number of professionals told me that such information was history: “Markets of the 1970s are very different.”
The low-P/E researchers were onto something, but the efficient-market hypothesis was rapidly ascending, and the work was mainly ignored. After all, in the late 1960s, our financial friends in academia were tightening the final nuts and bolts of the formidable efficient-market hypothesis. According to this academic-launched dreadnought, such results simply could not exist—whether they did or not. And that was that!
Further EMH criticism asserted that low-P/E stocks were systematically riskier (in the parlance, had higher betas) and therefore ought to provide higher returns. We have already looked closely at the failure of risk measures that the EMH academics used in chapters 5 and 6.
However, even in science fact has little chance against entrenched belief. For the coup de grâce, methodological criticisms of the studies were wheeled into action. They were mostly hairsplitting and not convincing—at least to me. But recall Einstein’s dictum “It is the theory that describes what we can observe.” Those findings could not exist if the dreadnought was to proceed merrily along annihilating traditional investment practice.
Buying low-P/E stocks appeared successful in studies of past performance. As a practical matter, it had worked for me—no small inducement to belief. Consequently, I updated several studies that I had used first in Psychology and the Stock Market (1977) and second in Contrarian Investment Strategy (1979). The low-P/E findings were still robust.3
My findings once again showed the clear-cut advantage of a low-P/E strategy. The study covered the two-tier market of 1971–1972, the bear market of 1973–1974 (the worst in the postwar period up to then), and the subsequent recovery. It did not matter whether investors started near a market top or a market bottom; superior returns were provided in any phase of the market cycle.
Through the 1980s to the mid-1990s, I completed (with various collaborators) half a dozen separate studies on low-P/E strategies, most of which were published in Forbes.*57 One study measured the 1,800 largest companies on the Compustat tapes between 1963 and 1985. The lowest-P/E quintile returned 20.7 percent annually against 10.4 percent for the highest.4 Another divided the 6,000 stocks on the Compustat tapes into five equal groups according to their market size, for twenty-one years ending in 1989. Each group then was divided again into five subgroups according to P/E rankings. The low-P/E groups handily outperformed the high-P/E groups for all market sizes, ranging from the smallest, at around $50 million in market value, to the largest, at nearly $6 billion.5
Another study measured how low price to cash flow performed for the twenty-two years ending March 31, 1985, using 750 large companies. The results are shown in Table 10-2. The stocks were again separated into five equal groups and ranked each year according to the ratio of price to cash flow.6 As the chart shows, the most out-of-favor stocks—lowest price to cash flow—almost doubled the annual performance of the favorites through this extensive period.7
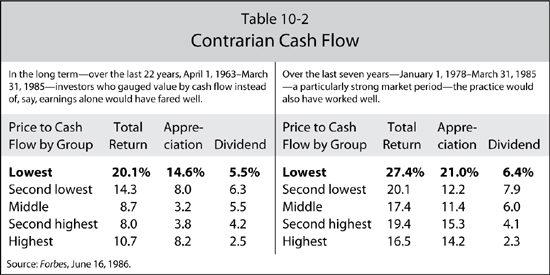
But what of some of the past criticisms? Were any of them still valid?8 Our experimental design adjusted for those criticisms and still provided the results shown above.
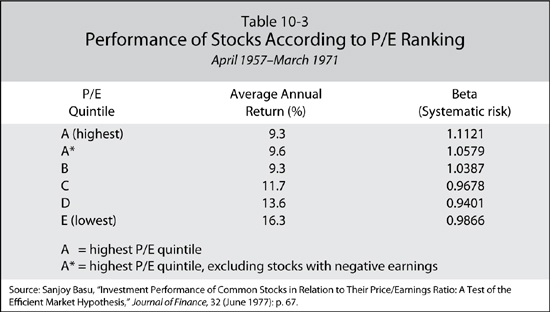
All this has been reconfirmed by other research in the late 1970s and early 1980s. Three carefully prepared studies by the late Sanjoy Basu* came up with similar results.9 In his study, published in the Journal of Finance in June 1977, Basu used a database of 1,400 firms from the New York Stock Exchange between August 1956 and August 1971. He took 750 companies that had year-ends of December 31 and turned over the portfolios annually, using prices on April 1 of the following year. As in most of the previous studies, he divided the stocks into quintiles according to P/E rankings. The results (again using total return) are shown in Table 10-3.
Basu found, as we did, that the low-P/E stocks provided superior returns and were also somewhat less risky. In his words, “However, contrary to capital market theory, the higher returns on the low P/E portfolios were not associated with higher levels of systematic risk; the systematic risks of portfolios D and E [the lowest] were lower than those for A, A*58, and B [the highest].”10 This and subsequent work, updated and adjusted for previous criticisms through the mid-1980s, thus added many links to a chain extending over seventy years, documenting the superior performance of low-P/E issues.
Given the weight of the evidence, you’d think that contrarian value approaches would have captured the imagination (and wallets) of investors long ago. By the 1990s, perhaps we should have been looking back at the golden age, when only a handful of pioneers reaped the rewards and only the favored few knew what a powerful tool these strategies were. But that’s not the case. Even today, in 2011, contrarians are a distinct minority—and, remarkably, are likely to remain so.
One reason for the situation is historical. You’ll remember how EMH swept the land and banished the heathens from Wall Street. As the new orthodoxy, EMH had everything to gain from a long and prosperous reign—not to mention a good deal to lose if competing ideas shouldered their way onto the Street. That, of course, is as much innate human psychology as any of the other crowd reactions we will examine.
In the late 1970s and through most of the 1980s, our work did not stand tall with efficient-market advocates, particularly those residing at the high shrine of market fundamentalism, the University of Chicago. As a leading heretic, I often experienced the wrath of the true believers. My work came under sharp attack, and my Forbes columns even had the distinction of being assigned to classes of students to hammer apart. On several occasions my unfortunate editors had sets of 10 or more letters attacking the work, letters which they on occasion good-naturedly published.
With the publication of my books and additional articles, the barrage intensified. Letters attacked every part of the findings, saving some choice remarks for the author. None found any statistical fault with the work, but they questioned the Neanderthal beliefs of a writer who couldn’t understand the overwhelming sweep and beauty of efficient-market thinking.
When I submitted a paper reporting the findings to the Financial Analysts Journal in 1977, it was not accepted or rejected but left in some purgatory reserved for ideas that don’t fit the prevailing paradigm.
The low-P/E anomaly was large enough to continue to attract attention from academia and Wall Street. Academics also dismissed the work using their old standby, risk measurement. Low-P/E stocks might provide higher returns, but they were far more risky, said the critics: rational investors accepted the higher risk only by demanding higher returns. Unfortunately, that, too, turned out to be not quite accurate.
Through the 1980s, Wall Street became increasingly interested in contrarian investment strategies. With continuing improvements in databases, confirmation that these strategies worked grew stronger and stronger.
The tide continued to gain strength. Dennis Stattman and Barr Rosenberg, Kenneth Reid, and Ronald Lanstein, for example, found that low price to book value outperformed high price to book value and the market.11 At the same time, the evidence mounted that beta had no value as a predictor of stock prices. Though the economic fundamentalists attempted to rationalize away their existence for almost three decades, those exasperating black swans just did not have the good manners to fly away. That low-P/E strategies worked and volatility didn’t work was a death knell for efficient markets.
What was a poor apostle of this new religion to do? Since neither of these results could be denied, the answer, of course, was to be the first to discover them. That is exactly what Eugene Fama, the apostle of efficient markets, did. In the 1990s, academics firmly planted their own flag on the newfound world of contrarian strategies.
In a revolutionary paper that thrust boldly thirty years into the past, Professor Fama discovered precisely what Nicholson, other researchers of the 1960s, Sanjoy Basu, Stattman, Rosenberg and colleagues, and I had found in the 1970s and ’80s: that contrarian strategies worked. Worse yet, as we saw in chapter 6, beta didn’t work. The three decades of stating that contrarian strategies provided better returns because they were riskier were swept away, as we saw, by the discovery that beta, the risk measure the apostle and his disciples used, was valueless.
To be fair, Fama and French12 do reference Basu, Stattman, and Rosenberg and colleagues in passing, as well as Ray Ball,13 who argued that low- P/E is a catchall for all risk that cannot be explicitly separated or even found. Still, Ball’s explanation was widely accepted by efficient marketers for years.
The reasoning in Ball’s paper is not unlike the phlogiston theory of heat popular in the eighteenth century. According to the theory, some elements are more combustible than others because they contain more phlogiston, while others are less so because they contain smaller amounts. Phlogiston was supposedly weightless and odorless, and could not be detected; nevertheless, it was there. How else could combustion occur? (Or how could low-P/E strategies beat the market if they were not risky, regardless of the fact that said risk could not be detected?) Circular and fallacious reasoning, yes, but Ball, Fama, et al. used precisely this logic to defend EMH. In both cases, the theorists defended themselves against phenomena they cannot explain through the creation of ingenious fudge factors. (The efficient-market hypothesis, as we have seen, has a grab bag full of these defenses.)
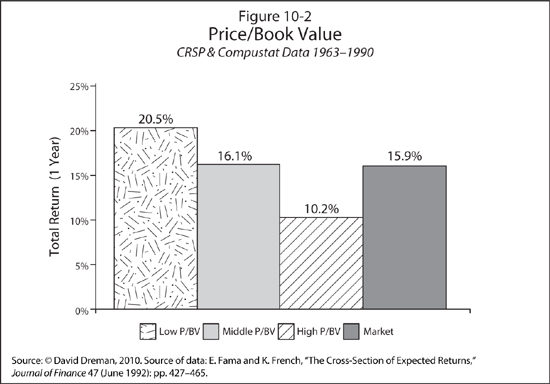
The landmark 1992 paper by Eugene Fama and his coauthor Kenneth French showed that the lowest price-to-book-value ratios, lowest price-to-earnings ratios, and small-capitalization stocks provide the highest returns over time.14 Figure 10-2 provides Fama and French’s price-to-book-value results. The sample used an average of 2,300 companies annually from the Compustat North America database. Stock returns are shown in quintiles by price-to-book-value ratios (P/BV), which are recast annually. The highest-price-to-book-value stocks are in column 3 and the lowest, or most unpopular, in column 1. As the figure indicates, low price to book value (20.5 percent) provides more than double the annual return of high P/BV for the entire sample through the life of the study. Low P/BV outperforms the market by 4.6 percent annually on average, while high P/BV underperforms by 5.7 percent.
Fama downplayed the low-P/E effect in an interview, saying the reason low-P/E stocks do well is that so many of them are the same stocks as are in the price-to-book-value sample. One could say precisely the opposite and be just as correct. As Fortune concluded, “Some might call that academic hairsplitting.”15 Since Fama had resisted the low-P/E effect for almost thirty years, another not unreasonable conclusion is that it may be a symptom of academic face-saving.
Let’s go back briefly to Basu’s Table 10-3. In the last column he adjusted his table for risk (beta) and found that volatility was actually lower for low-P/E stocks than for higher P/Es. EMH theory states definitively that low-P/E betas, or risk, must be higher than those of higher-P/E stocks. This has to be the case because these out-of-favor stocks provide higher returns than high-P/E stocks. Remember, the crucial premise of the capital asset pricing model, Fama and colleagues’ three-factor model, and all the other EMH risk-return models we saw in chapter 6 is based on the professors’ emphatic pronouncement that higher returns can be achieved only by taking greater risk (volatility), which we left them still trying to find proof for in that chapter.
But to move on. The blessing of contrarian strategies by the high priests at Chicago now allowed the investment world to eat what had been forbidden fruit. Value strategies were looked at with new reverence, and value indexes were introduced by Standard & Poor’s, Frank Russell, and scads of other consultants. Fortified by Professor Fama’s findings, other researchers now found the courage to spring boldly into the past.
In “Contrarian Investment, Extrapolation, and Risk,” Josef Lakonishok, Andrei Shleifer, and Robert Vishny measured the performance of the three important value strategies we’ve looked at and came up with similar results.16 These pesky contrarian strategies, then, have proved watertight for a lot longer than the efficient-market hypothesis. In fact, they have been getting stronger with each passing year.
The good news for you is that this wave of discoveries provides strong evidence that there are consistent, high-odds ways to beat the market. The methods also protect your capital in a bear market, as I’ll demonstrate shortly. It sounds a little like having your cake and eating it, too, but there are strong reasons why these strategies continue to work for disciplined investors. (That’s why I’ve included Psychological Guidelines—all based on investors’ psychological failings—throughout the text as a critical reminder.)
As we have seen, there are a number of contrarian strategies besides low P/E that work just fine. Low price-to-cash-flow and low price-to-book-value ratios are both potent tools for beating the market. Some of my more recent work demonstrates that buying stocks with high dividend yields has been successful in outperforming the averages, as has buying the stocks with the lowest P/Es in any industry (the industry-relative strategy). Beating the market isn’t easy. According to Vanguard’s John C. Bogle, whom we met earlier, only about 10 percent of managers are able to accomplish this in any ten-year period. But someone may ask a pointed question here: “True, you might say the numbers on low-P/E returns are impressive going back to the 1930s and up to 1990, but a lot of water has flowed under the bridge since then. How have contrarian strategies done in more recent times?”
The answer is “Just fine,” as we’ll see next, and in much more detail in the investment strategy section of the next chapter. All five contrarian strategies we looked at outperformed the market in the 1970–2010 period, which saw the two worst market downturns in our history other than 1929–1932.
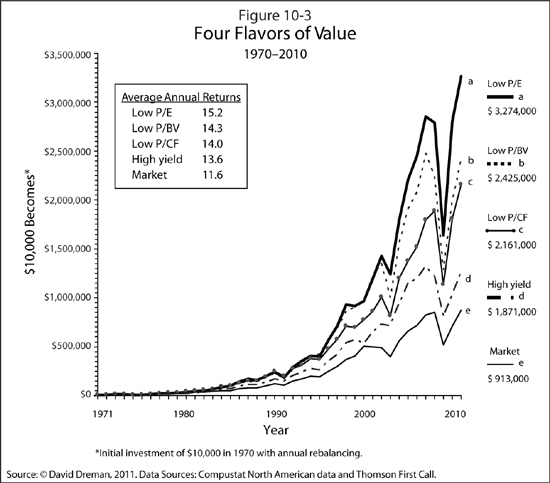
Figure 10-3 shows how effective contrarian value strategies have been for the forty-one years ending December 31, 2010. The study measures the Compustat 1500. Four separate value measures were used: low P/E, low price to book value, low price to cash flow, and highest yield. The stocks were divided into quintiles according to these four criteria, and the results were calculated annually throughout the study. The chart shows the returns against market using each of these strategies for this forty-one-year period. The methodology is almost identical to that explained for my chart shown earlier.
Value strategies work with a vengeance! All four outperform the average, and the returns of three of the strategies are outstanding. Ten thousand dollars invested in the bottom 20 percent of P/Es in the Compustat 1500 in 1970 would now be worth $3,274,000 at the end of December 2010 (all figures assume reinvestment of dividends), about four times the market’s cumulative value of $913,000 for investing the same $10,000 for the entire period. Looking at it another way, $10,000 in 1970 increased 327-fold!
Low price to book value, a favorite of Benjamin Graham, trailed low P/E but was ahead of the other two strategies for the period and almost triple the return for the market over these four decades. Low price to cash flow, taken from the statistics available from Compustat (thus excluding all the high-octane adjustments claimed to soup up performance), also worked just fine.
The returns shown in the small box near the top of the chart are worth looking at. After both the dot-com crash and the meltdown of 2007–2008, the average annual return over this forty-one-year period was 15.2 percent for low P/E, more than 14 percent for low price to book value, and 14.0 percent for low price to cash flow. This compares with a long-term rate of return for common stocks of 9.9 percent since the mid-1920s. Contrarian strategies outperformed the long-term rate of return of common stocks, 37 to 54 percent, through this forty-one-year period. I think we can safely say the sky is not falling on these strategies in spite of the horrendous markets of the the last decade.
Next let’s move on to the high-yield investment strategy. This value method is a little different from the other three. Normally, high dividend yields are found in utilities and other industry groups, which are not expected to have rapid appreciation. On the opposite side of the scale, stocks that pay small dividends or none at all are usually found in rapidly growing industries. Instead of paying dividends, companies hold the money back to finance growth. There has always been a good deal of controversy about whether stocks with high dividend yields even come close to the appreciation of the averages.
The answer is surprising. Although trailing the other three value measures, high-yield stocks outdistanced the market by 105 percent (all strategies include reinvested dividends). Ironically, though large numbers of investors buy large dividend payers for income, this method is probably most suitable for tax-free accounts. In a high tax bracket, the performance advantage over the market will decline fairly significantly, because a large part of the return is dividends, which go to Uncle Sam.
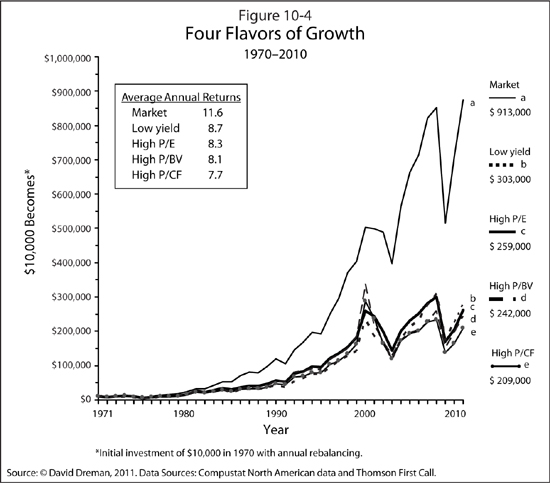
Another reasonable question is: how did the favored stocks perform by the same yardsticks? Badly. Regardless of which measure I used, none of the favorites came close to beating the market over the forty-one-year period. Ten thousand dollars invested in the highest-P/E group would have been worth $259,000 at the end of 2010, less than 30 percent of the $913,000 ending value of the market. The same amount invested in highest-price-to-book-value stocks grew to only $242,000, and invested in the highest-price-to-cash flow category, it grew to $209,000: 27 percent and 23 percent of the cumulative market return, respectively. Unexpectedly, the best performer in the “best sector” was the low-yield, no-yield group, which accumulated a dismal 33 percent of the market’s value at the end of 2010.
Strikingly, then, four of the most commonly used valuation ratios when applied to out-of-favor stocks resulted in their all significantly outperforming the market, while the same four metrics, when applied to favored stocks, resulted in their all significantly underperforming the market over the length of the study.
Unhappily for believers in growth, the long-term drubbing does not stop here. Although there is constant debate in the financial press and the investment media, as well as in Morningstar and other advisory services, about whether value or growth performs better over time, the results of this study are clear-cut. First, contrarian strategies outperform growth strategies regardless of the metric chosen. Next, the margin of outperformance over time is enormous. Low-P/E stocks outperform their high-P/E brethren by close to thirteenfold. Ten thousand dollars initially invested in these stocks in 1970 became $3,274,000, versus the $259,000 invested in high-P/E stocks at the same time. Similarly, $10,000 invested in low-price-to-book-value stocks would have grown to $2,425,000 against the $242,000 that the initial $10,000 would have increased to in high-price-to-book-value stocks. The comparisons of price to cash flow are similar. It’s clear that contrarian strategies outperform favored stocks by a country mile. What is also demonstrated is that contrarian strategies have performed very well, increasing initial capital by up to 327 times, from 1970 through 2010, and this after the worst market downturn since the Great Depression.
But the story is still not over. Most investors want more than just to increase their nest egg in a rising market. Just as important, they would like to keep it intact when the bear growls. We’ve seen the intensity of this goal after the 2007–2008 bear market. Morningstar, Lipper, and the Forbes Annual Mutual Funds Survey, among others, rank mutual funds on how they have performed through several bear markets.
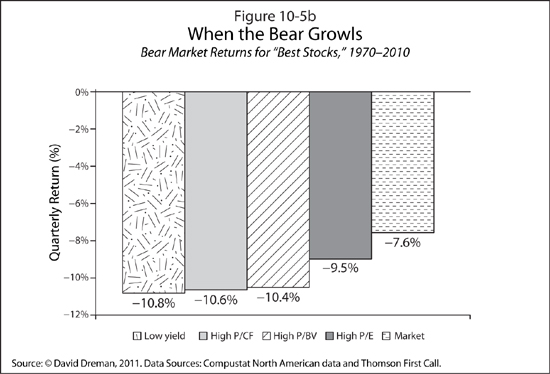
To find out how our contrarian strategies worked in down markets, we took the returns of the value stocks in each of the four categories for all fifty-two down quarters in the study and averaged them. As Figure 10-5a shows, the value strategies all did better than the market average in the down markets through the same period (1970–2010). While the market dropped 7.6 percent in the average down quarter, low-P/E, low-price-to-cash-flow, and low-price-to-book-value stocks all fell less, as the figure shows. The best performers, as you might expect, were the high-yield stocks, declining only 3.8 percent, or half as much as the market.
As you have also probably guessed, the high-P/E, high-P/CF, high-P/BV, and low-yield stocks were hit hard. As Figure 10-5b shows, all four strategies were down more than the market average, dropping between 9.5 percent and 10.8 percent and significantly more than the low-value metrics*59 versus a 7.6 percent drop for the market. Value stocks, then, not only provide higher returns in a rising market but also star on the defense. The value strategies originally presented by Ben Graham and other market pioneers played out at least as well as, and perhaps better than, they would have imagined.
Obviously, very few individuals can or need to hold funds in stocks for this period of time. But for those institutions, pension funds, and other long-term buyers who are once again fleeing stocks to buy Treasuries and other bonds at tiny yields, it’s a proven strategy that, when folks stop running away from stocks, they should definitely consider.
The consistency of these studies is truly remarkable. Over almost every period measured, the stocks considered to have the best prospects fared significantly worse than the contrarian stocks, using the same criteria. This leads us to another Psychological Guideline:
PSYCHOLOGICAL GUIDELINE 22: Buy solid companies currently out of market favor, as measured by their low-price-to-earnings, low-price-to-cash-flow, or low-price-to-book-value ratios or by their high yields.
You might wonder: if these strategies do so well, why doesn’t everyone use them? This lands us smack in the realm of investor psychology (or behavioral finance, as it is now called by economists).
Though the statistics drag us toward the value camp, our emotions just as surely tug us the other way. People are captivated by exciting new concepts. The lure of hitting a home run on a hot new idea, as chapter 2 made clear, overwhelms caution. The sizzle and glitz of an initial public offering such as LinkedIn, the Facebook of the professional world, which was issued at $45 and went to $122.70 the same day in May 2011, when it traded at a P/E of 548 times and price-to-book-value ratio of 134 times, or a RealD, in late May 2011 trading at a P/E of 170, are just too great.17
Though these are extreme examples of investor evaluation run amok, they show why value strategies have worked so well over the years. People pay for concept, whether in the absurd cases of LinkedIn or RealD or in consistently overpricing the trendy industries of the day. Investors just as surely want to stay well away from companies whose outlooks seem poor.
The favored stocks, on the other hand, present the best visibility money can buy. How, then, can one recommend such a reversal of course? The psychological consistency of the error is remarkable. There are, of course, strong stocks that justify their price-earnings ratios and others that deserve the slimmest of multiples. But, as the evidence indicates, the “best” are relatively few in number, and the chances of recognizing them are very small.
Contrarian strategies succeed because investors don’t know their limitations as forecasters. As long as investors believe they can pinpoint the future of favored and out-of-favor stocks, you should be able to make good returns on contrarian strategies. Human nature being what it is, this edge should continue for a few years longer—unless contrarians have a few million new readers sooner. (I’m sure my publisher and I would be delighted to deal with that problem, though.)
We have seen how consistently contrarian strategies have worked for investors over the years. The good news for you is that this wave of discoveries in new psychology and in contrarian strategies is harmonious. This is in strong contrast to EMH and MPT, where psychology exposes their basic assumptions. The research data of stock performance over the years provide strong evidence that there are consistent high-odds ways to beat the market. Next let’s extend the explanation to how we can use these strategies to both survive in and crank up our returns in the difficult markets we are likely to face.