IN THIS CHAPTER
 Exploring business‐cycle basics
Rotating through sectors
Deciphering economic indicators
You hear plenty about recession and inflation. You know both can mean bad economic news, but do you really understand what they mean and why they happen? Regardless of what the economic gurus do, the economy cycles between periods of economic growth and recession. If growth becomes overheated, periods of inflation are likely. Inflation can also be caused when the value of the currency falls. For example, when the value of the U.S. dollar falls, it causes an increase in the price of imports and commodities like oil for U.S. residents. That, in turn, impacts the price of just about every other good sold in the United States.
The Board of Governors of the Federal Reserve (Fed) oversees moves that are made in monetary policy in the United States, and the legislative and executive branches of government are responsible for tax changes and other fiscal policy moves. The actions of the Fed and the government can minimize the impact of inflation or recession and spur economic growth, but nothing can be done to erase economic cycles. Markets and traders try to anticipate these cyclical moves with an eye toward recording gains. This chapter helps you understand which economic indicators tend to lead these cycles and how you can use them to understand the current state of the markets and the economy.
The Basics of the Business Cycle
The old adage “What goes up must come down” is as true for the economy as it is for any physical object. When a business cycle reaches its peak, nothing is wrong in the economic world; businesses and investors are making plenty of money and everyone is happy. Unfortunately, the economy can’t exist at its peak forever. In the same way that gravity eventually makes a rising object fall, a revved up economy eventually reaches its high and begins to tumble.
The peak is only one of the four distinct parts of every business cycle — peak, recession, trough, and expansion/recovery (see Figure 5‐1). Although none of these parts is designated as the beginning of a business cycle, here are the portions of the business cycle that each represents:
- Peak: During a peak, the economy is humming along at full speed, with the gross domestic product (GDP — more about that later in this chapter) near its maximum output and employment levels near their all‐time highs. Income and prices are increasing, and the risk of inflation is great, if it hasn’t already set in. Businesses and investors are prospering and very happy.
- Recession/contraction: As the saying goes, all good things must come to an end. As the economy falls from its peak, employment levels begin to decline, production and output eventually decline, and wages and prices level off but more than likely won’t actually fall unless the recession is a long one.
- Trough: When a recession bottoms out, the economy levels out into a period called the trough. If this period is a prolonged one, it can become a depression, which is a severe and prolonged recession. The most recent depression in the United States was in the late 1920s and 1930s. Output and employment stagnate, waiting for the next expansion.
- Expansion/recovery: After the economy starts growing again, employment and output pick up. This period of expansion and recovery pulls the economy off the floor of the trough and points it back toward its next peak. During this period, employment, production, and output all see increases, and the economic situation again looks promising.
Understanding how periods of economic growth and recession are determined
How do you know which part of the business cycle the economy is in? Officially, you don’t usually find out until months after that part of the cycle has either started or ended. The National Bureau of Economic Research (NBER) officially declares the peaks and troughs. The NBER is responsible for formally announcing the ends of peaks and troughs and signaling when a recession (end of a peak) or expansion (end of a trough) starts. You can see a table explaining the peaks and troughs since 1857 at www.nber.org/cycles/cyclesmain.html.
The NBER identified December 2007 as the peak of the most recent economic expansion, but it didn’t make that pronouncement until December 2008. By the time the peak was declared, the market had been in a downtrend for 15 months, including the sharp selloff in September 2008. The trough of June 2009 was not pronounced until September 2010, and as of this writing, we’re still waiting for the next peak as the United States climbs out of its worst recession since World War II. The NBER determined that the recession lasted 18 months. Previously, the longest postwar recessions were those of 1973 to 1975 and 1981 to 1982, both of which were 16 months long.
As you can see, the time lag between events and when the NBER makes its announcements can be lengthy. But it can get worse. For example, the NBER declared on November 26, 2001, that the peak of the last business cycle was reached March 21, 2001. That was eight months later. The end of the trough for this cycle, November 2001, wasn’t announced until July 17, 2003. In other words, the economy was in a period of expansion/recovery for 20 months before the NBER made it official.
 Unfortunately for all concerned, information that the NBER needs to make its official announcements isn’t always immediately available. The process of collecting economic data and revised preliminary estimates of economic activity takes time. Estimates and data don’t become available immediately after a particular part of any business cycle ends. As a result, before drawing any conclusions, the NBER must wait until it sees a clear picture of what’s happening with the economy. Although many economists identify recessions and expansions based on at least two quarters (six months) of economic data, NBER uses its own models. Still, a growth spurt that lasts one full quarter doesn’t indicate the start of an expansion, nor does a decline that lasts a quarter indicate the start of a recession. Bearing that in mind, a time lag of at least six months is typically required before the NBER even considers declaring a recession or a recovery, which effectively renders the official announcement useless for traders.
The peak of a business cycle occurs during the last month before some key economic indicators begin to fall. These indicators include employment, output, and new housing starts. We talk more about economic indicators and which of them are critical for traders to watch in the section “Understanding Economic Indicators,” later in this chapter. However, because neither a recession nor a recovery can be declared until enough data is accumulated, finding a way around the time lag of official information is impossible.
Signals that the economy was weakening became clear to the markets as early as summer 2007, when the major indexes hit their peaks. Looking at an earlier business cycle, you can see the whole process. Just as in 2007, clear signs that the economy was headed toward a recession were seen as early as the spring of 2000, which is when the NASDAQ index hit its peak and began its downward spiral. The effects of the recession took a bit longer to hit the other major exchanges, but they started a downward trend by the summer of 2000. Just like in 2008, job losses had started mounting by mid‐2000, and many economists were already sending alarms that the economy was headed into a recession.
Even though the NBER announced the official beginning of that recession as March 21, 2001, and the official end of the trough and beginning of the recovery as November 2001, no significant recovery was seen in the markets until October 2002. Job growth remained anemic as of early 2004. The first sign of job growth was seen during the fourth quarter of 2003, after nearly three years of job losses. That economic expansion finally picked up steam and ultimately lasted through 2007.
Using economic indicators to determine the strength of the economy
Considering the amount of lag time between events and official pronouncements, we’re sure you’re wondering how you can determine which part of the cycle the economy is in and how you, as a trader, can use this information. Most economists attribute changing business cycles to disturbances in the economy. Growth spurts, for example, result from surges in private or public spending. One way public spending can surge is during a war, when government spending increases and companies in industries related to the war effort prosper. They often need to increase hiring to fulfill government orders. Employees at these companies usually receive increases in their take‐home pay and start spending that extra money. As consumer optimism increases, other companies must fulfill consumers’ wants and needs, so production and output also increase in companies that are unrelated to national defense.
When these same factors work in reverse, the start of a recession is sure to follow. For example, a cut in government spending will likely result in layoffs at related industrial plants, reduced take‐home pay, and finally declines in output and production in order to cope with reduced spending.
In addition to government spending, a decision by the Fed to either raise or lower interest rates causes another major disturbance in the economy. When interest rates rise, spending slows, and that can lead to a recession. When interest rates are cut, spending usually goes up, and that can aid in spurring an economic recovery.
Even though the Federal Reserve has kept interest rates at near zero since the financial crisis began in 2007, recovery has been very slow. The Federal Reserve raised the target rate to 0.75 percent in late 2016 for the first time since the financial crises of 2007 began, and it is expected to raise rates several times in 2017.
Another school of economic thought disagrees with the notion that government policy or spending is responsible for changes in the business cycle. This second group of theorists believes that differences in productivity levels and consumer tastes are the primary forces driving the business cycle. From this point of view, only businesses and consumers can drive changes in the economic cycle. These economists don’t believe that governmentally driven monetary or policy changes impact the cycle.
 Which camp you believe is not critical; the key is picking up the signs of when the economy is in a recession and when it’s in an expansion. Peaks and troughs are flat periods (periods where the high or low stays primarily even before moving in the opposite direction) and are impossible to identify until months after they end. As a trader, you can identify shifts in buying and spending behavior by watching various economic indicators. By doing so, you can discover when the economy is in the early stages of a recovery or recession or if it’s fully into a recession or recovery.
Relating bull markets and bear markets to the economy
You’ve probably heard the terms bull market and bear market. To find out what they mean, you first need to understand how economic cycles affect the stock market. Bulls are people who believe that all is right with the world and the stock market is heading for an increase. They definitely think the economy is expanding. Bears are people who believe the economy is heading for a downturn and stocks will either stagnate or go down. A bull market is a market in which a majority of stocks are increasing in value, and a bear market is a market in which a majority of stocks are decreasing. Bears definitely believe the economy is either in a recession or headed that way.
Regardless of whether the bulls or the bears are right, you can make money as a trader. The key: Identify the way the market is headed and then buy or sell into that trend. During a bear market, traders make their money by selling short, or taking advantage of falling prices (find out more about that in Chapter 15). Traders sell short by borrowing stock from their broker and then selling it with the hope of making a profit when the price falls.
Even during a bear market, some stocks offer opportunities for traders to make money, including oil and gas stocks and real‐estate investment trusts (REITs). Petroleum stocks and REITs pay higher dividends and, therefore, are most attractive when the rest of the market is falling or showing no growth potential. During a bull market, riding a stock through recovery but getting out before a fall is key. We talk more about trends and what they mean in Chapter 10.
Employing a Sector Rotation Strategy
In general, the markets are divided into sectors, and at any given time some of those sectors are expanding, even during a bear market. Some traders are adept at rotating their investments from one sector to another that is more likely to benefit from the part of the business cycle that’s driving the economy. This basic trading strategy is called sector rotation.
The guru of traders who want to take advantage of sector rotation is Sam Stovall, chief investment strategist for Standard & Poor’s, who wrote the classic on sector rotation, Sector Investing, in 1996. Stovall developed the sector rotation model shown in Figure 5‐2. As you can see, he found that market cycles tend to lead business cycles. Markets tend to bottom out just before the rest of the economy is in a full recession. The start of a bull market, on the other hand, can be seen just before the rest of the economy starts its climb toward recovery. Markets reach their tops first and enter a bear market before the general economic indicators show a peak.
As a trader, you can take advantage of this knowledge by knowing which sectors are more likely to rise during the various parts of a market cycle. You need to buy into the sectors with stock prices that are likely to rise, or you can sell short the sectors in which prices are expected to fall. We discuss short selling in Chapter 15.
The following sections explain how to identify the different phases of recovery and recession and which sectors are most affected during those periods. Then we give you an overview of what to be on the lookout for if you want to use a sector rotation strategy.
Early recovery
You can spot an early recovery when consumer expectations and industrial production are beginning to rise while interest rates are bottoming out. That scenario was evident during the economic cycle discovered during the fall and early winter months of 2003. During the early stages of recovery, Stovall found that industrial, basic industry, and energy sectors tend to take the lead.
We started seeing the early signs of recovery in late 2011 and 2012, as unemployment began to fall, but full recovery was not seen until 2016. The market’s rise to an historic high over 18,000 of the Dow Jones Industrial Index (DJII) didn’t happen until April 2016, so investors finally believe we are on the road to recovery since the market collapse in 2007–2008. That’s considerably more than double the low the Dow hit in March 2009 — 7,056.48. In November 2016, the market was still seeking top, and the Dow topped 21,000 in March 2017.
Full recovery
When the economy has fully recovered, you start seeing signs that consumer expectations are falling and productivity levels and interest rates are flattening out. These factors were seen during the economy’s period of full recovery leading up to the economic peak in December 2007. During that period, companies in the consumer staples (such as food, beverages, and household items) and services sectors (such as automotive and electronic repair, hair salons, and dry cleaning services) exhibited a tendency to take the lead, and interest rates had actually started to fall. As knowledgeable investors know, when that happens, it’s only a matter of time before a recession follows. Investors know that the staples of life are needed even in times of recession, so the stocks of those companies tend to benefit.
Early recession
When the economy reaches the earliest part of a recession, consumer expectations fall more sharply and productivity levels start to drop. Interest rates also begin to drop. Most of the 2.5 million job losses during the 2001 economic downturn occurred during late 2001 and early 2002. During 2001, the Federal Reserve cut interest rates 11 times to try to ease the concerns about the upcoming recession. The Fed started to raise rates in 2004 but then lowered them again in 2007 during the mortgage crisis. At the time of this writing, the Fed’s funds rate (the interest rate the Fed charges to member banks) was 0 percent, and by 2016 the target rate was just 0.25–0.50. In total, from December 2007 to early 2010, 8.7 million jobs were lost. In February 2013, nonfarm payroll employment was still 3 million jobs lower than at the start of the recession in December 2007. While employment has improved since 2013, the recovery in 2016 was still seen as weak, and the number of unemployed totaled 7.6 million in February 2017.
Utilities and finance sector stocks are the most likely to see rising prices during the first part of a recession, because under those circumstances investors seek stocks that provide some safety (because owning them involves less risk) and pay higher dividends. Gold and other valuable mineral stocks also look good to investors seeking safety. Though the financial sector did not follow this pattern in the 2008 recession, it is still typical to see banks, insurance companies, and investment firms perform well during the early parts of a recession.
Full recession
Although it may not make much sense intuitively, a full recession is when you first start seeing indications that consumer expectations are improving, which is shown by increased spending. However, industrial productivity remains flat, and businesses won’t increase their production levels until they believe consumers are actually ready to spend again. Additionally, interest rates continue to drop because both business and consumer spending are slow, so demand for the money weakens while competition for new credit customers grows between banks and other financial institutions. During a full recession, cyclical (such as car manufacturers or construction‐related industries) and technology stocks tend to lead the way. They will likely be the companies most beaten down in a full recession, so they will be good candidates to lead in the next recovery. Investors look to safety during a recession, so companies that satisfy that need tend to do best.
Sector rotation
Someone once said that the stock market predicted 15 of the last 8 recessions. And although it’s true that the market isn’t a terribly precise economic prognosticator, that’s sort of beside the point. Economic indicators can help you understand the big picture, which, in turn, can help you make better trading decisions.
Of all the economic tools available, sector rotation analysis is probably the most valuable. Even if the sector rotation model can’t help you identify an economic cycle, it can identify sectors and stocks that are ripe for further study.
When you trade, you want the strongest stocks in the strongest sectors, which is why you should monitor sector performance carefully. Knowing the sectors that are performing best enables you to anticipate which sectors are likely to begin outperforming and which are likely to fade. Using those projections, you can start monitoring stocks in those up‐and‐coming sectors. For a sector to outperform, the stocks within it must also outperform. You need to be monitoring those stocks before they begin their runs.
 Plenty of data is available to help you separate the strongest sectors from the ones that are underperforming. Investor’s Business Daily, for example, ranks nearly 200 industry groups by price performance. You can also monitor sectors by following exchange‐traded funds (ETFs), such as the Select Sector SPDRs (Standard and Poor’s Depository Receipts), at
 http://www.sectorspdr.com/sectorspdr/.
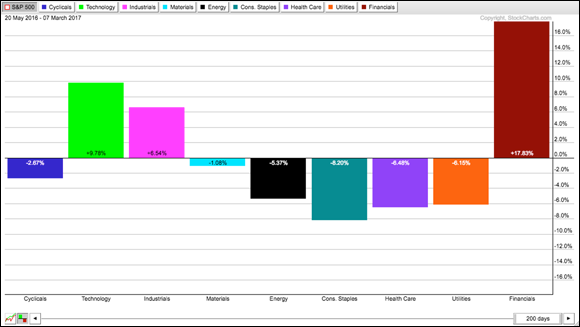
You can easily see what’s happening in various sectors using StockCharts Performance Charts at http://stockcharts.com/freecharts/perf.php?. At the bottom of the chart, you see a series of predefined performance charts from which to choose. Select S&P sector ETFs to quickly get a visual overview of which sectors are performing well and which sectors are not. Figure 5‐3 gives an example.
Understanding Economic Indicators
The key to knowing where, as a trader, you are during the business cycle is watching the economic indicators. Every day that you open your newspaper, you see at least one story about how the economy is doing based on various economic indicators. Popular indicators track employment, money supply, interest rates, housing starts, housing sales, production levels, purchasing statistics, consumer confidence, and many other factors that indicate the state of the economy.
Economic indicators are useful to your trading. Some are definitely more useful than others. We don’t have the space here to describe each of the indicators, so instead, we focus on the ones that can provide you with the most help in making your trading decisions.
Interest rates
Watching the Federal Open Market Committee (FOMC) of the Federal Reserve (which includes the seven members of the Board of Governors, the president of the New York Federal Reserve Bank, and presidents of 4 of the other 11 Federal Reserve Banks) and tracking what it may or may not do to interest rates is almost a daily spectator sport in the business press. Although members of the FOMC meet only eight times per year, discussions about whether the Federal Reserve will raise or lower interest rates serve as fodder for stories published on at least a weekly, if not daily, basis. Every time the Fed chairperson speaks, people look for indications of what the Fed may be thinking. Speeches by other members of the Fed likewise are carefully dissected between FOMC meetings. Most press coverage shortcuts all this by saying the Fed may raise or lower interest rates.
The key reason for you to be concerned: A change in interest rates can have a major impact on the economy and thus on how you make trades. An increase in rates is likely to slow down spending, which can lead to an overall economic slowdown. For the most part, when the Fed raises interest rates, it’s because the board believes the economy is overheated, which can fuel the risk of inflation. An increase in interest rates can reduce spending and thus ease overheating. If, on the other hand, the Fed fears an economic downturn or is trying to fuel growth during a recession, the board frequently decides to cut interest rates to spur spending and growth.
In addition to following press reports covering speeches and congressional testimony by members of the Fed, you can also get a good hint about what the Fed is thinking by reading the Beige Book, which is a report compiled by the 12 Federal Reserve Banks. Summaries about current economic conditions in each of the 12 districts are circulated to Federal Reserve Board members two weeks prior to the FOMC meeting, at which monetary policy, including interest rates, is set. The summaries are developed through interviews with key business leaders, economists, market experts, and others familiar with each individual district. You can read the Beige Book online at www.federalreserve.gov/monetarypolicy/beigebook/default.htm. You can find out about past FOMC statements at www.federalreserve.gov/newsevents/press/monetary/2016monetary.htm. These links give you access not only to current issues of the Beige Book and FOMC statements but also to information from those two sources dating back as far as 1996. They can provide an excellent overview of economic trends and possible shifts in Federal Reserve monetary policy.
Money supply
The money supply is a key number to watch because growth in money supply can be a leading indicator of inflation in situations when the money supply is greater than the supply of goods. When more money than goods is around, prices are likely to rise. Commodities and money traders should keep close watch over these three aggregates — money supply, inflation, and goods and services.
The Fed tracks two monetary aggregates: M1 and M2. M1 includes money used for payments, such as currency in circulation plus checking accounts in banks and thrifts. Currency sitting in bank vaults and bank deposits at the Fed is not part of M1, but instead is part of the monetary base. M2 includes M1 money plus retail nontransaction deposits, which is money sitting in retail savings accounts and money market accounts. You can follow the money stock measures for M1 and M2 at www.federalreserve.gov/releases/h6/. When you track the money base using M2, you can track the total amount of money sitting in someone’s account or circulating in the economy.
The Fed decided in July 2000 that it would no longer set target ranges for growth rates of the monetary aggregates. In the late 1970s, money supply drove the Fed’s decision‐making process. As money supply grew to what was considered out of hand, the Fed kept raising interest rates until they were so high that many believe the Fed moves actually caused the recession in the early 1980s. After that time, managing interest rates became a higher priority than managing money aggregates. The Fed didn’t kill the idea of target ranges for the money supply until it was certain that managing interest rates alone would help stem inflation. Now that the Fed has proved interest‐rate management works, it no longer sets a target for monetary aggregates.
Inflation rate
Several key economic indicators point you toward ways of identifying the risk of inflation. The primary overall indicator is gross domestic product; it’s released quarterly by the U.S. Department of Commerce’s Bureau of Economic Analysis (BEA). You can also follow monthly trends by keeping your eye out for the consumer price index, the producer price index, and retail sales data, as described in the list that follows:
Gross domestic product (GDP) represents the monetary value of goods produced during a specific period in the economy. In the United States, GDP is released quarterly in three different versions. The first version, which includes advance data for the previous quarter, is released at 8:30 a.m. on the last business day of the months of January, April, July, and October. Preliminary data is released a month later, and the final numbers are released a month after that. GDP is important to traders because it indicates the pace at which the economy is growing. In the GDP, you’ll find numbers for consumer spending, private domestic investment, government or public spending, and net exports. Essentially, it includes all information about labor and property involving business activities inside the confines of the United States. If GDP fails to meet expectations set by the analysts or exceeds market expectations, stock prices will be affected, at least temporarily.
For a glimpse of what may be in store for the future, pay attention to the rate that inventories are increasing. It can be a leading indicator that growth is slowing or consumer demand is changing.
Even though the final official numbers are released quarterly, the advance reports and preliminary reports give you a good indication of what to expect in the final numbers. You can get full details about the GDP reports at www.bea.gov/national/index.htm#gdp. You can track the release schedule for the GDP reports and other government statistical reports at this location as well. Often the report is posted at the Bureau of Economic Analysis early in the morning before the actual release and embargoed until the official release time, so as a trader you may be able to get a heads up before the news is actually reported by the press.
The Consumer Price Index (CPI) measures the cost of a representative basket of goods and services, including food, energy, housing, clothing, transportation, medical care, entertainment, and education. Each type of cost is weighted. For example, medical costs are weighted more highly in recent years because they’re rising at a faster pace, especially as the current population ages. In addition to the broad CPI, a core rate is issued that excludes food and energy, which are considered more volatile.
The core rate is an indicator you can watch for general price shifts. The financial markets, in general, look for a rate of increase in the range of 1 percent to 2 percent; anything higher may be a sign of inflation and can cause at least a temporary shock to stock prices. Any shock to stock prices obviously can be an opportunity for traders.
The CPI is released by the U.S. Department of Labor about 8:30 a.m. around the 15th of each month and reflects data from the previous month. You can track the CPI at the website of the Department of Labor’s Bureau of Labor Statistics at www.bls.gov/cpi.
- The Producer Price Index (PPI) is thought of more as a basket full of other indexes that affect domestic producers, including goods manufacturing, finishing, and agricultural and other commodities. The Department of Labor collects more than 100,000 prices each month from 30,000 production and manufacturing firms to calculate this basket. The markets pay close attention to this index, because even though it isn’t as powerful an inflation index as the CPI, it gives traders clues about what to expect in the next CPI release. The PPI is released a couple of days before the CPI, at 8:30 a.m. usually around the 13th of each month, and it reflects data from the previous month. You can track PPI data at
www.bls.gov/ppi.
- Retail sales data tracks information about (you guessed it) retail sales by large corporations and by small mom‐and‐pop retail outlets. The U.S. Census Bureau, which is a part of the Department of Commerce, surveys hundreds of firms each month using a random sampling of retail outlets that make federal insurance contributions to collect this data, which is particularly important whenever you’re trading stocks in the retail sector. The survey looks at changes in retail numbers from month to month. When the number is a negative number, it means sales levels decreased from the previous month. This type of negative news can be a shock to stock prices, especially for companies in the retail sector. The data is released about two weeks after it’s collected, or at 8:30 a.m. about the 12th of each month. You can track it online at
www.census.gov/retail.
Deflation
In addition to watching the economic indicators discussed in the previous section for inflation, traders also need to watch the numbers for signs of deflation. Serious concern about the possibility of deflation takes center stage when prices start falling. Deflation occurs when a sustained period of falling prices takes place. The Great Depression of the 1930s was a classic period of deflation. Many economists believe that printing more money cures deflation because (as mentioned earlier in the “Money supply” section) increases in the money supply normally lead to increases in prices when more money is around than goods to be purchased.
During periods of deflation, increasing the money supply isn’t necessarily the answer. Some economists believe injecting more money into the economy is risky, especially when production capacity is in excess and producers continue to produce goods even though prices are falling. Whereas, in other economic situations, producers commonly stop producing when prices fall.
In early 2004, Japan faced a continuing period of deflation even though its central bank had lowered rates to an effective negative interest rate and continued printing money in attempts to prop up its sagging pricing structure, and yet prices were continuing to drop. Some economists believe the Japanese experienced a liquidity trap. No matter how much money Japan printed, prices continued downward in a deflationary spiral.
Jobless claims
The Employment Situation Summary, another report from the Bureau of Labor Statistics (BLS), is one of the most important leading indicators to watch. This report is the first critical economic indicator released every month and frequently sets the expectations for the rest of the reports that month. For example, signs of a weak labor market reported in the Employment Situation Summary usually are a strong indication of poor retail sales and other possible negative reports later in the month. The summary also breaks down data by industry, such as construction and manufacturing. For example, a significant drop in employment numbers for the construction sector is a strong sign that the housing starts report will also be negative.
This report can send shock waves through the financial markets, especially if the numbers that are released vary greatly from expectations. Stock prices definitely fall whenever the report doesn’t meet expectations or employment statistics show signs of weakness. On the other hand, stock prices can rise dramatically whenever the report indicates better‐than‐expected numbers. As is true with any shock to the market, changes in prices are temporary unless other indicators also exhibit the same trend or tendency.
The reason why the employment report can drive markets so strongly is that the information it contains is a timely assessment of the overall market because it includes data that is only a few days old. This report is widely recognized as the best indicator of unemployment and wage pressure. Rising unemployment can be an early sign of recession, while increased pressure on wages can be an early sign of inflation. The report also is a broad‐based snapshot of the entire labor market, covering 250 regions of the United States and every major industry.
The BLS (www.bls.gov) releases the report at 8:30 a.m. on the first Friday of each month with data for the previous month. The two key parts of the report that traders need to watch are
- Unemployment and new jobs created
- Average weekly hours worked and average earnings
Another employment indicator traders like to watch is the employment cost index (ECI). It’s especially relevant during actual times of inflation or when fear exists that an inflationary period may be imminent. The ECI is a quarterly survey of employer payrolls that tracks movement in the cost of labor, including wages, benefits, and bonuses. Wages and benefits make up 75 percent of the index. The BLS surveys more than 3,000 private‐sector firms and 500 local governments to develop the index. The ECI, which reports data from the previous quarter, is released on the last business day in January, April, July, and October.
Consumer confidence
Keeping an eye on consumer confidence is another way of casting a glance into the future of the market. When confidence is high, consumers are more likely to spend. The best overall index for monitoring consumer confidence is the Consumer Confidence Index (CCI), which is put out by The Conference Board. This index is compiled through a sampling of 5,000 households and is widely respected as the most accurate indicator of consumer confidence.
Although minor changes in the CCI are not strongly indicative of a problem, major shifts can be a sign of rocky waters ahead. Most people who watch the CCI look for three‐ to six‐month trends. The Fed, as an example, looks closely at consumer confidence when determining interest rate policy, which as you know can greatly affect stock prices. When confidence is trending lower, the Fed is more likely to lower interest rates. Stock markets love to hear about the Fed lowering interest rates. Confidence levels that are trending higher can be a warning of a pending inflationary period. A rapidly rising trend in consumer confidence can lead the Fed to raise interest rates to cut off inflation; moreover, a rise in interest rates can send stock prices lower.
The Conference Board releases the CCI at 10 a.m. the last Tuesday of each month. The biggest weakness of this index is that it isn’t based on actual spending data. Instead, it’s a survey of planned spending. You can track the CCI online at www.conference-board.org/data/consumerconfidence.cfm.
Business activity
A number of key economic indicators can give you a good idea of what business is doing and how that information may impact the stock markets. Key business indicators to watch include
- The National Association of Purchasing Managers report (NAPM): One of the first economic indicators released each month is the NAPM report, which surveys purchasing managers and provides reviews of new orders, production, deliveries, and inventories. This report is released at 10 a.m. the first business day of each month and reflects data compiled from the previous month. You can track this report online at
www.ism.ws/ismreport/index.cfm.
- Durable goods orders: The Department of Commerce releases another critical economic indicator of business activity in the area of durable goods orders. This indicator measures the dollar volume of orders, shipments, and unfilled orders of durable goods, or types of merchandise that have a life span of three years or more. This report serves as a leading indicator of manufacturing activity and can move the stock market, especially when its numbers vary from expectations. You can track the durable goods orders online at
www.census.gov/indicator/www/m3/index.html.
Housing starts and building permits: This report is also released by the Department of Commerce. It can be a leading indicator of the direction the economy will take. When the number of permits rises, a positive economic indicator results. About 25 percent of investment dollars are plowed into housing starts, and that makes up about 5 percent of the overall economy. The report is broken down by regions — Northeast, Midwest, South, and West — so you can also get a strong indication of the strength of the economy on a regional basis. You can track this indicator online at www.census.gov/construction/bps/.
You can also track other reports on myriad industries at www.census.gov/manufacturing/cir/index.html.
- Regional manufacturing surveys: Each Federal Reserve Bank district compiles data from regional manufacturing surveys that can help you find a score of indicators including new orders, production, employment, inventories, delivery times, prices, and export and import orders. Positive reports indicate an expanding economy. Negative reports indicate a contracting economy. The most closely watched is the Philadelphia regional surveys at
www.philadelphiafed.org/research-and-data/regional-economy/. If you’re trading in regional stocks, following the manufacturing surveys from the Federal Reserve Banks in key regions that you follow can help you determine the direction of the economy for the areas most relevant to the stocks you’re trading.
You can get a lot of this information and more about the U.S. economy on the mobile app developed by the U.S. Census Bureau, Bureau of Labor Statistics, and Bureau of Economic Analysis. It’s called America’s Economy, and it’s available for Apple and Android at www.census.gov/mobile/?intcmp=sldr1. This app provides real‐time updates for 16 key economic indicators.