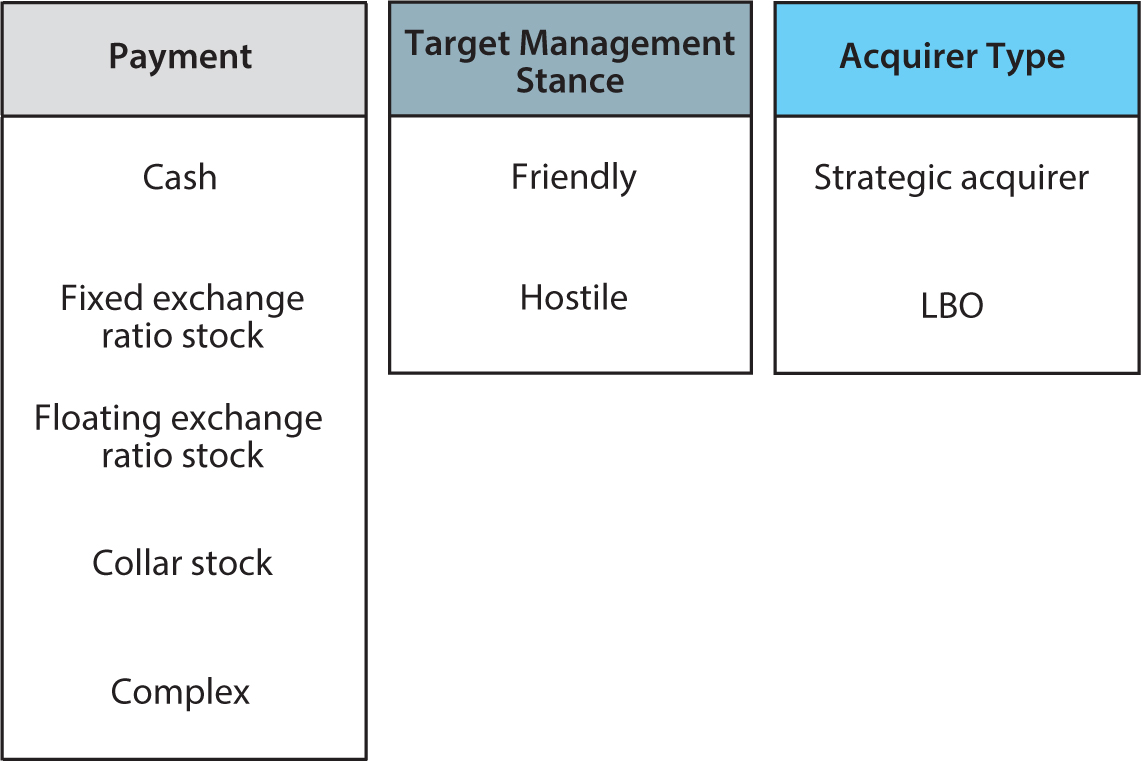
Figure 16.1. Types of merger deals.
Event-Driven Investments
Risk arbitrage, generally, is investing in securities of corporations going through a corporate event where the return is not based on the stock going up and down, but the success and completion of the event.
—John A. Paulson
Event-driven investment is an opportunistic strategy of investing around corporate-specific events and possibly marketwide events. Event-driven managers continually look for many types of “events” and try to find trading opportunities that arise in this connection.
The classic event-driven trade is merger arbitrage (also called “risk arbitrage”). Merger arbitrage tries to profit from the price moves that happen when a merger is announced. Just as the merger of two companies can lead to opportunities from the temporary price moves, so can corporate events that do the opposite, namely split a company into smaller pieces. Such events include spin-offs, split-offs, and carve-outs.
Another class of trades is related to changes in the capital structure of a firm, such as share buybacks, debt exchanges, security issuances, or other capital structure adjustments. Some event-driven managers specialize in distressed firms, trading in a range of securities when corporations face financial distress, bankruptcy, or lawsuits. Such distressed investment often requires an active involvement in the firm, leading event managers to serve on creditor committees, try to renegotiate debt, or find ways to turn the business around.
A third class of trades tries to profit from discrepancies between different types of securities. Capital structure arbitrage trades different securities issued by the same firm against each other, for instance, buying corporate bonds while shorting the stock. Event-driven managers sometimes also trade on specialized security structures such as closed-end funds, exchange traded funds (ETFs), special purpose acquisition companies (SPACs), and private investment in public equity (PIPE).
A fourth class of events relates to changes in the market structure for the securities, e.g., if a stock is included in an index such as the S&P 500 stock market index, or is excluded from an index.
Beyond corporate events, event-driven managers may also look for events in other markets or asset classes. The most famous example is the trade by the event-driven hedge fund manager John A. Paulson, which has been called “the greatest trade ever.” Paulson shorted derivatives related to subprime mortgages, which in 2007–2008 became one of the most profitable trades in the history of hedge funds, reportedly making more than $15 billion. This credit bet could also be considered a global macro trade.
While the events differ greatly across all these trades, they share a similar portfolio construction methodology. The portfolio is constructed based on two principles: (1) isolate the event-specific risk and hedge out market, interest-rate, and credit risks; and (2) diversify across many events to minimize idiosyncratic event risk. For example, the event manager constructs his portfolio such that he will profit if a merger is completed and lose if the merger fails. The risk associated with the failure of the merger is the risk he wants to be compensated for taking, and this risk cannot be eliminated—but it can be largely diversified away by holding many small positions related to many different mergers. Warren Buffett puts it this way:
Of course, some investment strategies—for instance, our efforts in arbitrage over the years—require wide diversification. If significant risk exists in a single transaction, overall risk should be reduced by making that purchase one of many mutually-independent commitments. Thus, you may consciously purchase a risky investment—one that indeed has a significant possibility of causing loss or injury—if you believe that your gain, weighted for probabilities, considerably exceeds your loss, comparably weighted, and if you can commit to a number of similar, but unrelated opportunities. Most venture capitalists employ this strategy. Should you choose to pursue this course, you should adopt the outlook of the casino that owns a roulette wheel, which will want to see lots of action because it is favored by probabilities, but will refuse to accept a single, huge bet.
—Warren Buffett, Annual Report, 1993
Let us discuss these strategies in more detail.
16.1. MERGER ARBITRAGE
Mergers and Acquisitions
Companies are being bought and sold all of the time. In many of these transactions, the buyer and/or seller is a private company, but merger arbitrage traders only get involved when the company that is being bought—the “target”—is a publicly traded company. As seen in figure 16.1, there are several types of mergers. The acquirer can be another company with potential synergies, that is, a strategic buyer, or the acquirer can be a (private equity) leveraged buyout (LBO) fund. The bid can be “friendly,” meaning that it is backed by the target company’s management and/or board, or it can be “hostile,” meaning that the target company’s management opposes the takeover. The type of acquirer and the stance of the management can significantly affect the chance that the deal goes through.
Deals also differ in the types of payments offered for the target company. Sometimes the acquirer offers to buy the company for cash. For instance, LBO deals are often done with cash as the acquirer does not have shares to offer. Alternatively, a strategic buyer may offer to pay for the target with its own shares. For instance, the acquirer may offer 2 shares of its own stock for every 1 share of the target company, called a 2-for-1 “fixed exchange ratio.” A stock deal can also have a “floating exchange ratio,” meaning that the number of shares depends on the acquirer’s stock price at some point after the merger announcement. For example, the floating exchange ratio can be set so that the offer price is $100 worth of the acquirer’s stock, where the number of shares is determined on February 1. Said differently, the offer is to give a number of shares equal to $100/P, where P is the acquirer’s stock price on February 1. Stock merger deals may also have optionality, e.g., to limit the value of the offer on the downside and upside. Such deals are sometimes referred to as collar deals. Merger offers can be rather complex and may involve other corporate securities, such as bonds issued by the acquirer.
Merger Arbitrage and Why It Works: Efficiently Inefficient Deal Spreads
When a merger is announced, the acquirer offers to buy the target firm at a premium to its current price to make the current owners willing to sell. For instance, if the stock price has been trading around $100 per share, an acquirer may offer $130 per share. After the announcement, the target stock price jumps up. It is important to recognize that this initial jump in the target stock price is typically not what merger arbitrage is about. It is very difficult for merger arbitrage traders to anticipate in advance which firms will be taken over (and those who really do know in advance often end up in jail for insider trading).
Merger arbitrage is about buying the target stock price after the announcement, i.e., after the target’s stock price has already jumped up. So why should this trade be profitable if the target price already reflects the merger offer? The reason is that the target price typically does not jump up to the value of the offer; it only increases part of the way. For instance, if the acquirer offers $130, the target price might jump up to $120. Hence, the merger arbitrage manager will make $10 per share if the merger is completed. This potential profit should naturally be seen in light of the potential risk. If the merger fails, the target stock price will likely drop back to around $100, leading to a loss for the merger arbitrage manager of $20. The offer value may also be renegotiated, up or down, or a competing bidder may offer a higher price. Hence, the expected profit of this merger arbitrage trade depends on the probability of a successful merger, the expected losses in case of failure, and the profit in case of completion.
While the expected profit of a merger trade is complex to evaluate, it is straightforward to compute the profit of the merger trade if the current merger offer goes through, which is called the deal spread:
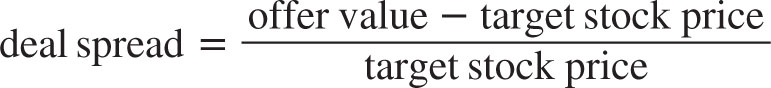
In the example above, the deal spread is $10/$120 = 8.3%. Hence, if the merger offer goes through as stated, the merger arbitrage manager stands to earn an 8.3% profit. This measure of deal spread can potentially be refined to incorporate dividend payments before the expected time of the merger and possible implementation costs.
Does the existence of a positive deal spread mean that merger arbitrage makes money on average? Not necessarily. After all, the deal spread reflects actual deal risk. In other words, the deal spread should usually be positive just to offset the losses from failed deals to ensure zero average profits for arbitrageurs. However, historically the deal spread has been wider than the break-even deal spread, meaning that merger arbitrage has been a profitable trade.
There are several reasons why merger arbitrage has been profitable historically, but the main reason is that, when a merger is announced, many existing investors sell their shares in the merger target. This selling means that the target price does not increase as much as it might have otherwise, leaving open a deal spread large enough to make merger arbitrage profitable on average.
Many investors sell the merger target because they recognize that the target company’s stock price can suddenly drop if the merger is called off. The typical owner of the stock, be it a mutual fund or an individual investor, bought the stock because she likes the company. When the acquirer offers to buy the whole company, such investors may feel vindicated in having bought the stock as the acquirer may like the company for the same reasons that the original owners did. However, even investors who had expertise in selecting the stock in the first place may feel that their expertise does not lie in evaluating the deal risk. Indeed, during the period of merger uncertainty, the key determinants of the target price are suddenly not its growth prospects and business efficacy; the key determinants become whether the target board and shareholders will accept the offer, whether the acquirer will revise or cancel the offer upon due diligence, the legal issues of whether the merger will be allowed by the regulator, and whether the acquirer will get the needed financing.
Since many stock owners are not comfortable with the deal risk, they will essentially demand “insurance” against the risk of deal failure. They get this “insurance” in the simplest possible way: they sell the stock. The price of this insurance is the deal spread.
Said differently, the natural owners of the stock suddenly become sellers for the stock. While new natural owners of the company will arrive after the merger is resolved (one way or the other), the market temporarily faces a significant demand for liquidity.
The merger arbitrage traders buy the target when other investors sell. Hence, they provide liquidity to all those who want to get out of the stock to avoid deal risk. Said differently, the merger arbitrage traders are providing insurance against the deal risk, and their average profit is the insurance return or the compensation for liquidity provision. How do merger arbitrage managers handle deal risk? They diversify across many deals, trying to make sure that no one deal failure will be detrimental for their overall portfolio.
The deal spread reaches an efficiently inefficient level where merger arbitrage managers are compensated for their liquidity provision. At times when the total number and risk of merger deals is large relative to the merger arbitrage capital, the expected return increases. The deal spread also tends to be efficiently inefficient when compared across different merger deals. Indeed, since merger arbitrage managers try to figure out which deals are more likely to fail and which are likely to go through, buying the target shares only in the deals they think will succeed, riskier deals tend to have wider deal spreads.
The Life of a Merger Arbitrage Trade
The life of a merger arbitrage trade starts when a merger is announced. This typically happens when the market is closed and, if the market is open, trading is temporarily halted. After the market opens, the merger arbitrage manager assesses the price and the target stock, weighing the deal spread and the possibility of an even higher bid against the risk of deal failure. If the manager likes the trade, he buys shares in the target stock and hedges by short-selling the acquirer in the amount described below (which can be zero). We will return to how to size the position and its hedge.
First, one of our analysts screens the tape for any new deals that are announced. Once a deal is announced, we do a detailed financial analysis. We examine the performance of the company, its growth in sales, EBITDA [earnings before interest, taxes, depreciation, and amortization], net income and earnings per share; we compute the merger multiples to EBITDA, EBIT and net income; we look at the size of the acquirer vis-à-vis the target, and the premium being paid. We then make an overall assessment of the financial merits of the deal. Generally, we look for healthy companies being purchased at reasonable multiples without excessive premiums. The second stage of our research is to participate in the management conference calls; review the Wall Street research, SEC filings and the merger agreement. In our review of the merger agreement, we look for any unusual conditions to the merger such as due diligence, financing, business or regulatory conditions. We are basically looking for solid merger agreements with minimal conditions. We also examine regulatory issues that could affect the timing or the ultimate approval of the transactions. We have very good outside anti-trust counsel and we have an in-house lawyer to look at any legal issue that may affect the outcome of a transaction. Generally, the focus of our research is to eliminate deals that are riskier and have a lower probability of being completed. We look at the remaining lower risk deals on a return basis and we try to focus on deals with lower risk and higher potential returns.
—John A. Paulson, 2003 (as quoted by Hedge Fund News)
When the merger arbitrage position is on, the manager waits for the deal to close, following the events as they evolve. In the meantime, the long position in the target stock earns any dividends paid by the target company while having to compensate for dividends paid by the acquirer. Furthermore, the merger arbitrage manager incurs transaction costs when buying the target and shorting the acquirer, short-selling costs, and funding cost.
The typical closure of the trade is simply that the merger is completed and the merger arbitrage earns the deal spread. However, several other outcomes are possible, as seen in figure 16.2. An even better outcome is that another potential acquirer makes a competing bid to buy the target firm, raising the offer value. Sometimes several bidders drive up the price such that the merger arbitrage profit increases significantly above the initial deal spread. If the market assesses the possibility of competing bids as very likely, the deal spread can occasionally be negative, meaning that the target price is above the current bid. Some merger arbitrage managers might liquidate their positions when the deal spread turns negative, while others might add to their positions, namely those who have strong views on the likelihood of competing bids.
A merger deal may also be renegotiated, which can lead to a higher or lower bid price, depending on the circumstances. The worst outcome is that the merger fails. This typically results in the target stock price falling back to the level it had before the merger announcement. The target stock price could drop even further, for instance, if the merger failed because of some bad news about the company, or because the preannouncement price already had a premium associated with the possibility of a merger, or simply because of general market movements. The target stock might also drop to a level above its premerger price, for instance, because the merger bid revealed a potential of the target company that may still be unlocked even without this particular merger.
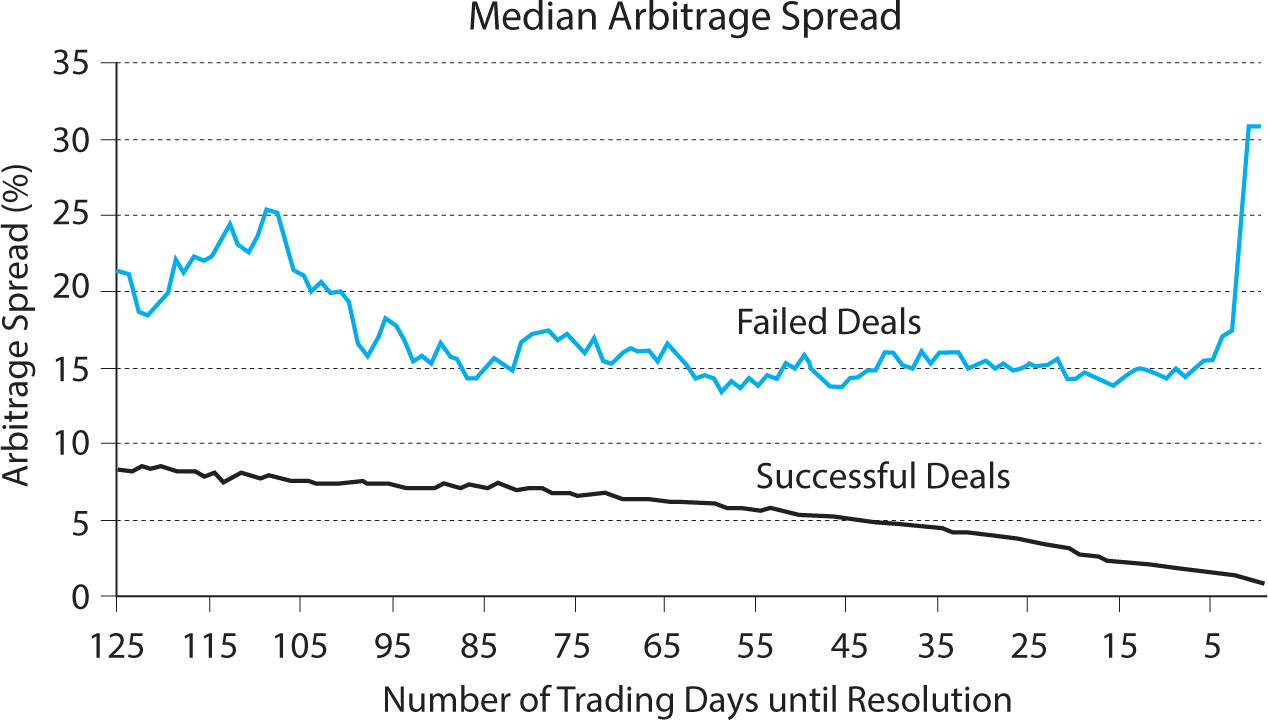
Over the life of the merger trade, the deal spread opens and narrows depending on how the likelihoods of the different outcomes evolve. Figure 16.3 shows the median deal spread among deals that ultimately succeed and fail, respectively. We see that successful deals tend to have lower deal spreads, which typically start around 8% and narrow gradually over time as success is ever more certain and each potential obstacle is overcome. Deals that ultimately fail tend to have larger deal spreads, starting around 20%. Hence, while the market does not know in advance which deals will fail, the market recognizes that certain deals are riskier and, naturally, the riskier deals are more often those that fail. As the deal fails, the deal spread widens more than 15 percentage points, gapping out to around 30%.
Figure 16.3. Evolution of the merger arbitrage deal spread before resolution.
Source: Mitchell and Pulvino (2001).
The Case of Arcata Corp.
Warren Buffett gives an interesting example of a merger arbitrage trade in the 1988 annual report of Berkshire Hathaway:
To evaluate arbitrage situations you must answer four questions: (1) How likely is it that the promised event will indeed occur? (2) How long will your money be tied up? (3) What chance is there that something still better will transpire—a competing takeover bid, for example? and (4) What will happen if the event does not take place because of anti-trust action, financing glitches, etc.?
Arcata Corp., one of our more serendipitous arbitrage experiences, illustrates the twists and turns of the business. On September 28, 1981 the directors of Arcata agreed in principle to sell the company to Kohlberg, Kravis, Roberts & Co. (KKR), then and now a major leveraged-buyout firm. Arcata was in the printing and forest products businesses and had one other thing going for it: In 1978 the U.S. Government had taken title to 10,700 acres of Arcata timber, primarily old-growth redwood, to expand Redwood National Park. The government had paid $97.9 million, in several installments, for this acreage, a sum Arcata was contesting as grossly inadequate. The parties also disputed the interest rate that should apply to the period between the taking of the property and final payment for it. The enabling legislation stipulated 6% simple interest; Arcata argued for a much higher and compounded rate.
Buying a company with a highly-speculative, large-sized claim in litigation creates a negotiating problem, whether the claim is on behalf of or against the company. To solve this problem, KKR offered $37.00 per Arcata share plus two-thirds of any additional amounts paid by the government for the redwood lands.
Appraising this arbitrage opportunity, we had to ask ourselves whether KKR would consummate the transaction since, among other things, its offer was contingent upon its obtaining “satisfactory financing.” A clause of this kind is always dangerous for the seller: It offers an easy exit for a suitor whose ardor fades between proposal and marriage. However, we were not particularly worried about this possibility because KKR’s past record for closing had been good.
We also had to ask ourselves what would happen if the KKR deal did fall through, and here we also felt reasonably comfortable: Arcata’s management and directors had been shopping the company for some time and were clearly determined to sell. If KKR went away, Arcata would likely find another buyer, though of course, the price might be lower.
Finally, we had to ask ourselves what the redwood claim might be worth. Your Chairman, who can’t tell an elm from an oak, had no trouble with that one: He coolly evaluated the claim at somewhere between zero and a whole lot.
We started buying Arcata stock, then around $33.50, on September 30 and in eight weeks purchased about 400,000 shares, or 5% of the company. The initial announcement said that the $37.00 would be paid in January, 1982. Therefore, if everything had gone perfectly, we would have achieved an annual rate of return of about 40%—not counting the redwood claim, which would have been frosting.
All did not go perfectly. In December it was announced that the closing would be delayed a bit. Nevertheless, a definitive agreement was signed on January 4. Encouraged, we raised our stake, buying at around $38.00 per share and increasing our holdings to 655,000 shares, or over 7% of the company. Our willingness to pay up—even though the closing had been postponed—reflected our leaning toward “a whole lot” rather than “zero” for the redwoods.
Then, on February 25 the lenders said they were taking a “second look” at financing terms “in view of the severely depressed housing industry and its impact on Arcata’s outlook.” The stockholders’ meeting was postponed again, to April. An Arcata spokesman said he “did not think the fate of the acquisition itself was imperiled.” When arbitrageurs hear such reassurances, their minds flash to the old saying: “He lied like a finance minister on the eve of devaluation.”
On March 12 KKR said its earlier deal wouldn’t work, first cutting its offer to $33.50, then two days later raising it to $35.00. On March 15, however, the directors turned this bid down and accepted another group’s offer of $37.50 plus one-half of any redwood recovery. The shareholders okayed the deal, and the $37.50 was paid on June 4.
We received $24.6 million versus our cost of $22.9 million; our average holding period was close to six months. Considering the trouble this transaction encountered, our 15% annual rate of return excluding any value for the redwood claim—was more than satisfactory.
But the best was yet to come. The trial judge appointed two commissions, one to look at the timber’s value, the other to consider the interest rate questions. In January 1987, the first commission said the redwoods were worth $275.7 million and the second commission recommended a compounded, blended rate of return working out to about 14%.
In August 1987 the judge upheld these conclusions, which meant a net amount of about $600 million would be due Arcata. The government then appealed. In 1988, though, before this appeal was heard, the claim was settled for $519 million. Consequently, we received an additional $29.48 per share, or about $19.3 million. We will get another $800,000 or so in 1989.
Implementing Merger Arbitrage: How to Determine the Hedge
Merger arbitrage is about earning the deal spread as a compensation for taking the risk that the deal fails. Hence, the risk that the deal fails cannot be hedged—this is precisely the risk that the merger arbitrage manager wants to take. In fact, event arbitrage is about isolating the event risk and hedging out other risks (and diversifying across a number of unrelated events, as discussed in more detail later). Let us see how to isolate the deal risk and hedge out unnecessary risks.
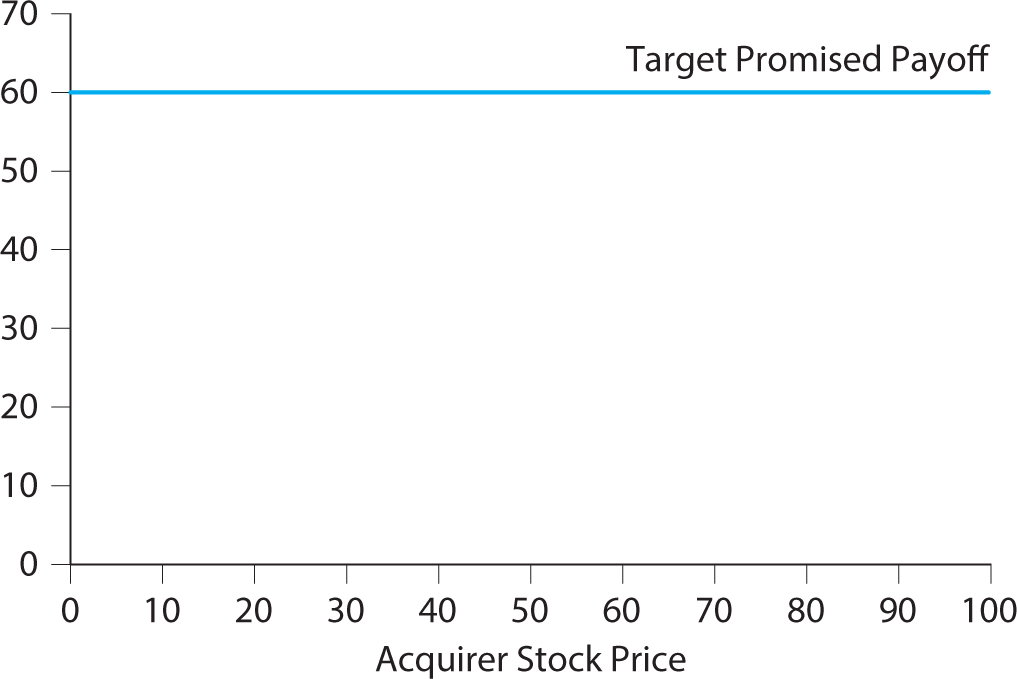
The right hedge depends on the type of payment in the merger deal. Recall that figure 16.1 gives an overview of the main types of merger payments. The simplest merger trades involve cash deals, that is, deals where the acquirer simply offers to buy the target for cash. Figure 16.4 shows an example in which the acquirer offers $60 per share for the target. Of course, the value of the offer is independent of the price of the acquirer in this case. Therefore, the merger trade is very simple: You buy the target and that’s it. No deal-specific hedge. (The manager may still apply some overall portfolio hedges as discussed below.)
Figure 16.5 shows the value of a fixed-exchange ratio stock deal. In this example, the acquirer offers 1.2 shares for each of the target shares. Hence, when the arbitrageur buys the target, she is clearly exposed to the risk that the acquirer’s stock price drops in value. To hedge this risk, she can simply short-sell 1.2 shares of the acquirer for every share of the target that she buys.
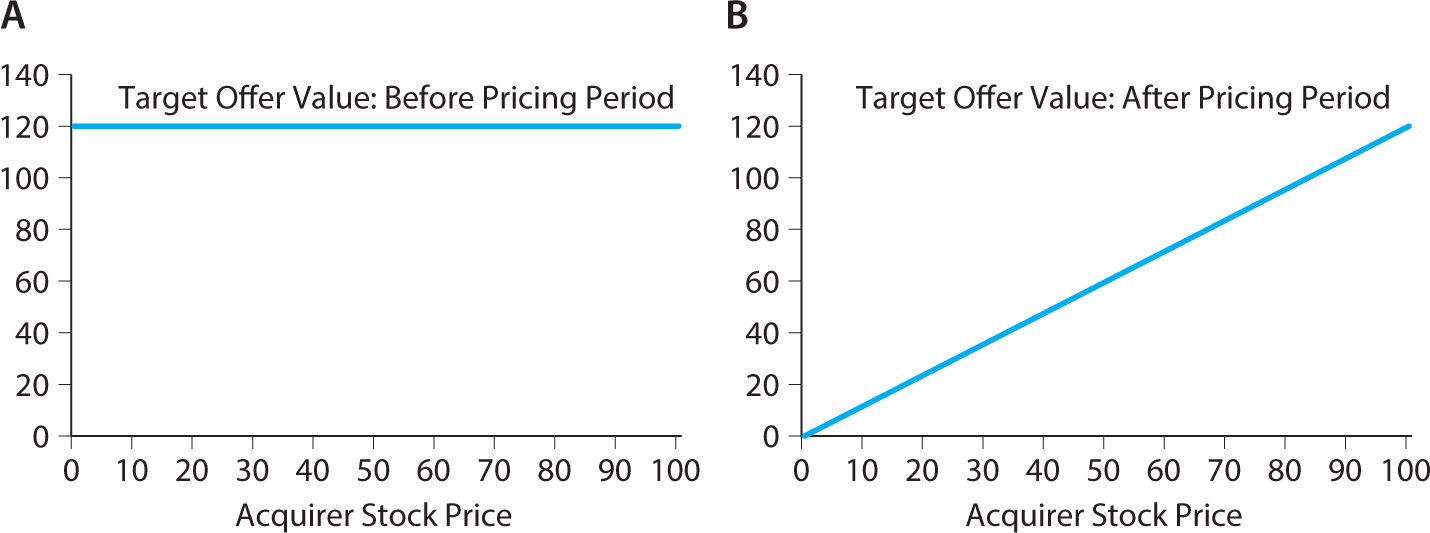
Figure 16.6 illustrates how to think of a floating-exchange ratio stock deal. The acquirer offers $60 worth of the acquirer’s stock based on average price over a pricing period. Initially, before the pricing period, this is just like a cash deal. Hence, no hedge is needed in this time period. After the pricing period, the deal becomes just like a fixed-exchange ratio deal. During the pricing period, the exchange ratio is gradually determined so that the merger arbitrageur gradually increases her hedge from zero to the full hedge.
Lastly, figure 16.7 shows the value of two different types of collar stock mergers, that is, mergers where the payment (the cash amount or the number of the acquirer’s shares) is adjusted depending on the circumstances. Hence, the promised payment has built-in option features like a collar option strategy. The payment structure in Panel A is sometimes called a “Travolta” deal, and the structure in Panel B an “Egyptian” deal (cf. the arm positions of John Travolta in Saturday Night Fever and a classic image of an Egyptian). The graphs show the values at the time of the merger completion, which are piecewise linear, like option payoffs. Hence, if options are available, such deals can be hedged using a portfolio of stocks and options that match the merger payoff. If options are not available or are expensive to trade, the merger arbitrageur can instead use the option technique called delta hedging. This means varying how much of the acquirer’s stock is shorted over time.
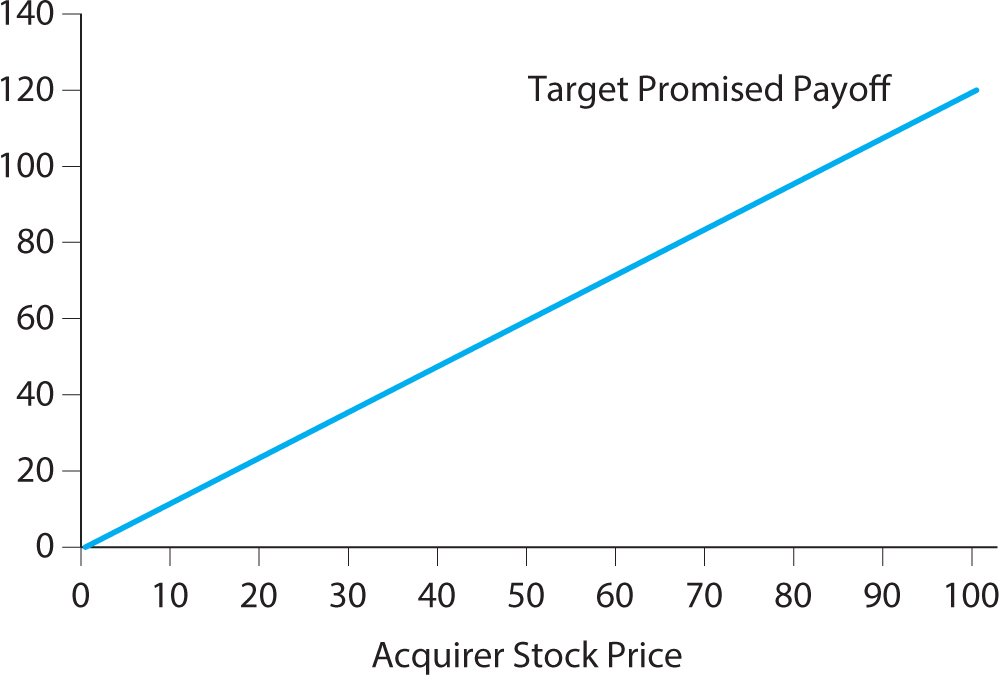
Figure 16.5. How the value of the offer depends on the acquirer’s stock price: Fixed-exchange ratio stock deal.
Figure 16.6. How the value of the offer depends on the acquirer’s stock price: Floating-exchange ratio stock deal.
Panel A: Before the pricing period.
Panel B: After the pricing period.
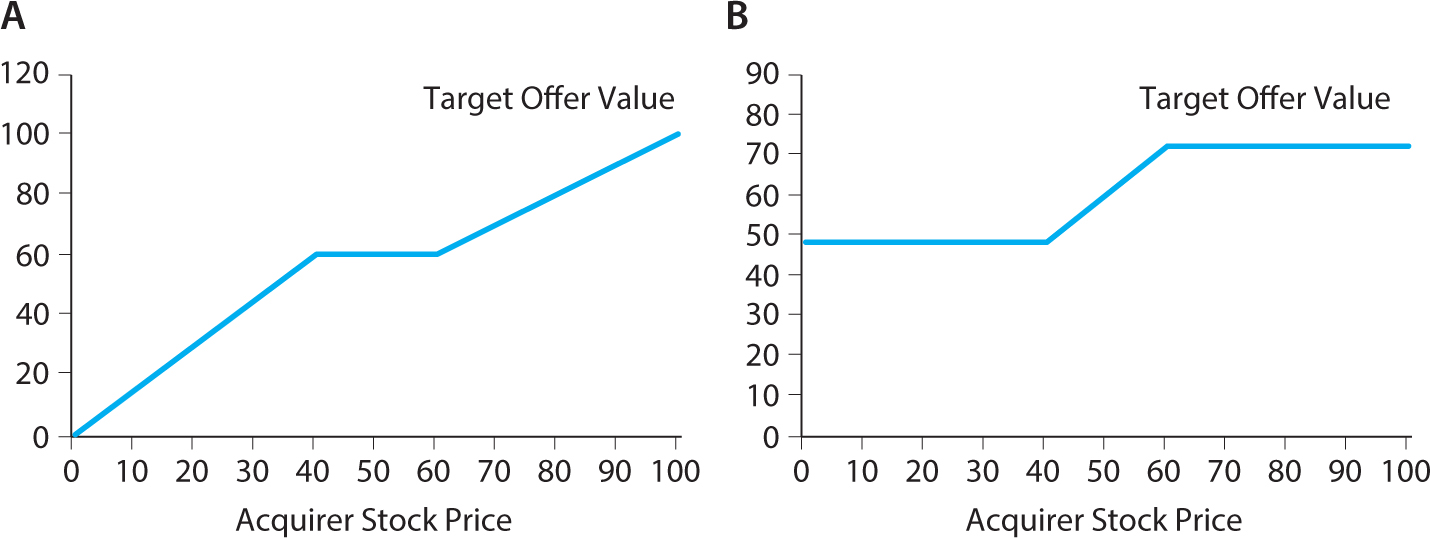
Figure 16.7. How the value of the offer depends on the acquirer’s stock price: Collar deals.
Panel A: “Travolta” collar deal.
Panel B: “Egyptian” collar deal.
Which Merger Acquirers Talk up Their Stock Price and When?
Acquirers in stock mergers have an incentive to boost their stock prices. Consistent with this, Ahern and Sosyura (2014) find that “fixed exchange ratio bidders dramatically increase the number of press releases disseminated to financial media during the private negotiation of a stock merger, compared to floating exchange ratio bidders, who do not have an incentive to manage their media during the merger negotiation. This effect is associated with short-lived increases in both media coverage and bidder valuation.” Furthermore, they find that floating-exchange rate bidders disseminate more news around the pricing period, perhaps trying to talk up their stock price when it matters the most.
Merger Arbitrage Portfolio
Portfolio construction is an important part of merger arbitrage. The merger arbitrage manager must decide which merger targets to buy and how to size the positions. To do this, the merger arbitrage manager must first consider the available universe of mergers at any given time.
There are a lot of mergers and acquisitions going on almost all the time. Mitchell and Pulvino (2001) identify 9,026 U.S. merger transactions from 1963 to 1998, corresponding to 251 transactions per year on average. The number of transactions was lower in the early time period, peaked in the late 1980s, and has remained relatively solid since then. Each deal lasts about 3 months on average. Hence, having 251 transactions per year at a 3-month average duration implies that about 63 mergers were going on at any point of time in the United States during this period. The last decade, there have often been more than 100 U.S. mergers going on at each time, and more globally.
Given the available universe of merger deals, the merger arbitrage manager must decide on the number of deals to invest in, the maximum weight in any one deal, and which deals to buy. Some merger arbitrage managers are relatively concentrated, viewing their edge as taking significant bets on deals that have been very carefully analyzed. However, many merger arbitrage managers prefer to be well diversified, limiting the maximum weight in any one deal to be no more than 3–10% of the overall portfolio. To see why, consider what happens when a merger deal fails. For instance, suppose that the target of a cash merger increases 20% in value following the merger announcement and, when the merger is called off, the target price drops 20%. If the merger arbitrage manager buys the target with 5% of his capital, his loss will constitute 5% × 20% = 1% of his capital. To consider a more extreme case, consider an investment of 10% of the assets in a deal, leading to a 50% drop in the target price (relative to a potential hedge in a stock deal)—this implies a 5% loss of the overall capital. While such losses are painful, the merger arbitrage manager can nevertheless still hope to be up for the year. Some managers find the potential loss of 5% of capital on a single deal to be too large, whereas others may want to take a significant bet on deals where they have strong conviction of completion. If the maximum position size is set more conservatively to 3%, then the merger arbitrage manager needs to invest in a wide variety of merger deals, covering a large fraction of all deals that take place, and this is in fact a typical behavior among merger arbitrage managers.
As we will see in the historical return numbers below, the return to a diversified portfolio of merger arbitrage deals has been very good. That is, merger arbitrage managers have done well simply earning the deal-risk liquidity premium, even without special information regarding particular deals. Consistently, Warren Buffett (1988 annual report) says of merger arbitrage that “the trick, à la Peter Sellers in the movie, has simply been Being There.”
Merger arbitrage managers also try to diversify across deal types and may size their positions differently across deal types. For instance, cash deals are more exposed to market risk (as explained below), so some merger arbitrage managers limit their overall exposure to cash deals. Furthermore, deal risk differs across deal types, as we discuss next.
Risk in Merger Arbitrage
The risk that any given merger deal fails is not negligible: about 10% of all deals fail. There exist some general patterns regarding which deals are more likely to fail (see Mitchell and Pulvino (2001), Table V). Naturally, hostile deals are more likely to fail than friendly deals as the acquirer must fight to gain control. LBOs are more likely to fail than strategic deals, likely because LBOs have a greater dependence on external financing and the deal may fall through if the acquirer cannot get financing. Also, smaller deals are more likely to fail, perhaps because large deals have been studied more carefully by the acquirer and the target has been subject to more general scrutiny by equity analysts. Furthermore, deals subject to more regulatory scrutiny are more likely to fail, e.g., deals that may be conceived as creating a monopoly. The simplest predictor of deal failure risk is the deal spread—deals with big spreads have big risk! Indeed, the market distinguishes good and bad deals ex ante, a sign of efficiently inefficient merger spreads.
Deal risk also changes over time, depending on the state of the takeover market. When the overall stock market is falling significantly, the risk of deal failure is higher. This is especially true for cash deals. To understand this, suppose that company A makes a bid to acquire company B for $100 million in cash, but before the deal is consummated, the overall stock market falls 30%. Then the bid may suddenly look too high—now the acquirer can consider buying another company for about 30% less than the time of the original offer. Therefore, the acquirer is likely to withdraw its offer or renegotiate it. If, on the other hand, the original merger offer had been to pay $100 worth of A’s own stock, then the situation would have been different. In this case, the value of the offer would have likely fallen with the market as A’s stock price would have adjusted. Therefore, the offer value might continue to look reasonable for A (and possibly B). Hence, deal failure risk depends on the overall market conditions, which shows up in the historical returns to merger arbitrage that we study next.
Historical Return of Merger Arbitrage
To evaluate the risk and return of a diversified merger arbitrage portfolio, Mitchell and Pulvino (2001) collect a large data set of mergers from 1963 to 1998 and construct a systematic strategy that they denote the “risk arbitrage index manager” (RAIM). The hypothetical RAIM invests in all cash and stock mergers available in each month (i.e., it excludes merger deals with more complex deal terms). The simulated strategy starts with $1 million in 1963 and invests in all deals, value weighting each deal subject to two constraints:
• Position limit 1: No deal can account for more than 10% of the simulated net asset value (NAV).
• Position limit 2: No deal must imply a trade so large that it would move the target or acquirer by more than 5% according to an estimated market impact function.
Based on these assumptions, the returns of merger arbitrage are simulated, accounting for transaction costs due to brokerage fees and market impact costs. The RAIM merger arbitrage index realizes an arithmetic average annual return of 11.1% (10.64% with geometric compounding) with an annual volatility of 7.74% over the time period from 1963 to 1998. Given the risk-free rate over this time period, this corresponds to an annual Sharpe ratio of 0.63 (0.57 with geometric compounding), which is higher than the Sharpe ratio of the overall equity market of 0.40 over the same time period.
Hence, merger arbitrage delivered significant positive excess returns after transaction costs. Let us see whether these returns were market neutral or exposed to market movements.
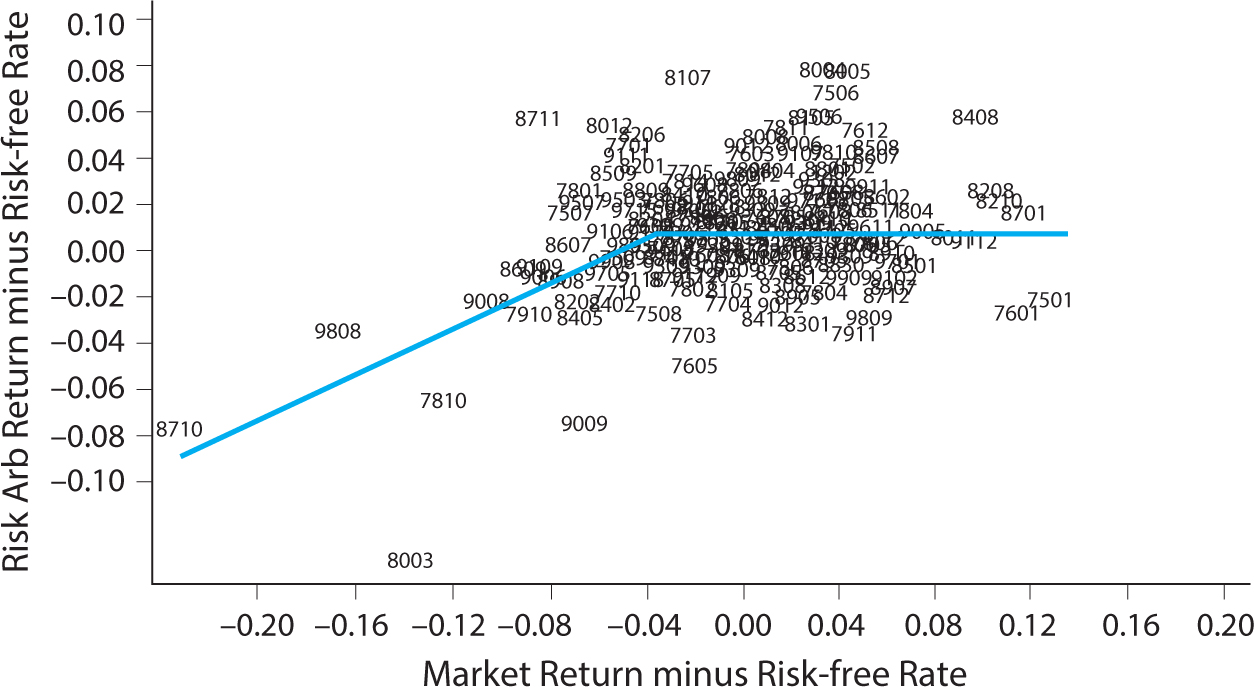
Figure 16.8 plots the excess returns of the RAIM merger arbitrage index vs. the excess return on the overall stock market. We see that merger arbitrage returns are largely uncorrelated with the market in mild bear markets and in bull markets. However, in significant bear markets—when the overall stock market drops more than 5% in a month—the correlation increases significantly.
Figure 16.8. The excess return for merger arbitrage vs. the market excess return. Each data point is marked by the year and month it occurred, YYMM.
Source: Mitchell and Pulvino (2001).
The return of a diversified merger arbitrage portfolio does not depend directly on the stock market since the merger portfolio is hedged (i.e., it is a long–short portfolio). However, the merger arbitrage portfolio depends indirectly on the stock market since the overall rate of deal failure does. When the market return is close to zero or positive, marketwide events have little effect on whether a merger is completed so the merger arbitrage return depends largely on idiosyncratic events. Hence, in this range of market returns, merger arbitrage has a stock market beta close to zero (indicated by the flat line segment in the figure).
But, as seen to the left in figure 16.8, merger arbitrage has a positive beta when the stock market is significantly down as merger arbitrage shares the overall market pain in significant bear markets. This market exposure happens because a large drop in the market increases the general risk of deal failure (as discussed above). In particular, acquirers are more likely to walk away from their bid in down markets, especially if they made a cash bid that suddenly looks too expensive. Furthermore, obtaining financing becomes more difficult in down markets, especially if a credit crunch hits the financial sector.
The non-linear market exposure means that the standard capital asset pricing model (CAPM) model is not appropriate to evaluate the performance of merger arbitrage. The merger arbitrage payoff resembles a risk-free bond plus idiosyncratic noise and less a short put option on the market. Hence, when computing the alpha of merger arbitrage returns, we need to take into account that simply selling put options on the market earns a risk premium. To do this, one can regress the merger arbitrage excess return on both the excess return of the stock market index and the excess return of shorting put options:
This regression shows a statistically significant loading on put options and a significant positive alpha. This implies that merger arbitrage has delivered positive excess returns even accounting for the non-linear market exposure. Hence, merger arbitrage managers earn a premium for providing liquidity to market participants who sell merger deals, essentially providing “insurance” against deal risk.
Portfolio-Level Hedges for Merger Arbitrage
As we have seen, a merger arbitrage portfolio has a non-linear market exposure even when every deal in the portfolio is hedged. This portfolio exposure is the result of the increase in the general risk of deal failure that happens in bear markets, especially for cash deals. To hedge this non-linear risk, the merger arbitrage manager can overlay the strategy with portfolio hedges such as selling equity index futures or buying index put options, but most managers don’t use such hedges as they tend to be expensive. If used, these hedges should be sized to remove the market-directional risk of the portfolio and therefore depend on the value of all the deals in the portfolio and the composition of deals across deal types.
16.2. SPIN-OFFS, SPLIT-OFFS, CARVE-OUTS
What Are Spin-Offs, Split-Offs, Carve-Outs?
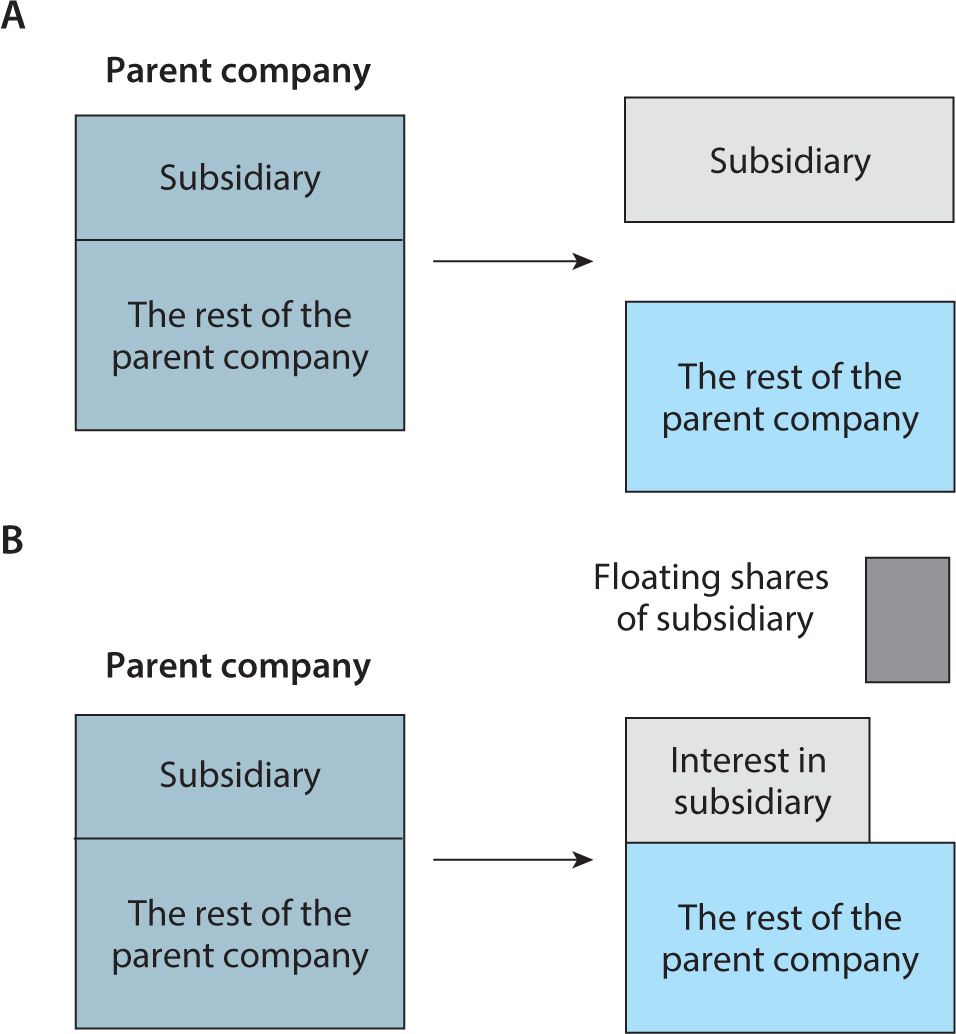
The opposite of a merger happens when a company is divided into separate pieces and, interestingly, both mergers and divestments create opportunities to event managers. A company can sell a subsidiary in various ways, for instance by selling to another company in a private divestiture or by selling to the public. Selling to the public can be done with several methods, including a spin-off, a split-off, or a carve-out. In a spin-off, a subsidiary of the parent company is made into a separate firm and the shareholders of the parent company receive shares in the subsidiary on a pro rata basis (so no cash changes hands). A split-off is similar, except that the shareholders of the parent company must elect whether or not to tender parent shares in exchange for shares in the subsidiary.
Spin-offs and split-offs are illustrated in figure 16.9, which also shows how carve-outs work. In an equity carve-out, the parent sells some shares of the subsidiary while retaining a fraction of the shares on its own balance sheet. The carve-out creates a market for the subsidiary shares, and it is commonly followed by a later spin-off or split-off of the remaining parent shares. The carved out shares in the subsidiary company can be sold in a so-called partial initial public offering (IPO) or can be awarded to parent shareholders on a pro rata basis.
Figure 16.9. Illustration of spin-offs, split-offs, and carve-outs.
Panel A. Spin-offs and split-offs.
Panel B. Carve-outs.
Trading on Spin-Offs and Split-Offs
Spin-offs and split-offs give event managers an opportunity to bet on the separate prospects of the subsidiary and the rest of the parent company, their separate management teams, and business potentials. Furthermore, the corporate event can initially lead to supply and demand imbalances as investors are re-optimizing their portfolios. For instance, the subsidiary often faces initial selling pressure as many investors want to keep their shares in the parent stock, not the subsidiary. This is especially the case if the subsidiary is in a different industry than the parent or if the parent is in an equity index and the subsidiary is not. Subsidiaries in a spin-off are likely to face greater selling pressure than those being split off because all original shareholders in a spin-off receive shares in the subsidiary, while shareholders must elect to buy shares in a split-off. Furthermore, investors may initially feel that they have insufficient knowledge of the subsidiary and the subsidiary typically has low analyst coverage in the beginning.
Over time, the selling pressure ends, investors learn about the subsidiary and its management, and analyst coverage picks up. Furthermore, the subsidiary and the rest of the parent each can benefit from being a more focused company with more incentivized management, fewer agency problems, and so on, leading to potential strong performance over the medium term.
Trading on Carve-Outs
While investments in spin-offs and split-offs are often not arbitrage trades, carve-outs can present more true event-driven arbitrage opportunities. Since the parent firm owns a significant fraction of the subsidiary, event managers can sometimes profit from trading the parent against the subsidiary.
Table 16.1 illustrates the balance sheet of the parent firm and the “stub,” that is, the parent firm excluding the interest in the subsidiary. Since assets always equal liabilities, we see from the balance sheet of the parent that the market values (MVs) of the various pieces must satisfy this equation:
![]()
Similarly, from the stub’s balance sheet we see that
![]()
Combining these relations gives the following natural relation:
![]()
Event managers really pay attention when they find a negative stub value. This means that one can buy the parent equity for less than the value of its stake in the subsidiary, which seems like a great bargain.
TABLE 16.1. STYLIZED BALANCE SHEETS OF THE PARENT FIRM AND THE STUB
Panel A. Stylized Balance Sheet of the Parent Firm
Assets |
Liabilities |
Other assets |
Liabilities |
Stake in subsidiary |
Parent company equity |
Panel B. Stylized Balance Sheet of the Stub (the Parent, Excluding the Subsidiary)
Assets |
Liabilities |
Other assets |
Liabilities |
|
Equity of stub |
A negative stub value is a real arbitrage when it is known that the parent will distribute its shares of the subsidiary. For instance, if the parent has N shares of the subsidiary for every parent share outstanding, then an event manager can buy shares in the parent and short-sell N times as many shares of the subsidiary. The event manager is essentially paid to take on this position because of the negative stub value (although the position nevertheless ties up capital due to margin requirements). When the parent distributes the subsidiary shares, the event manager can use these shares to cover her short positions. This leaves the event manager owning the shares of the rest of the parent, which is worth no less than zero (due to limited liability).
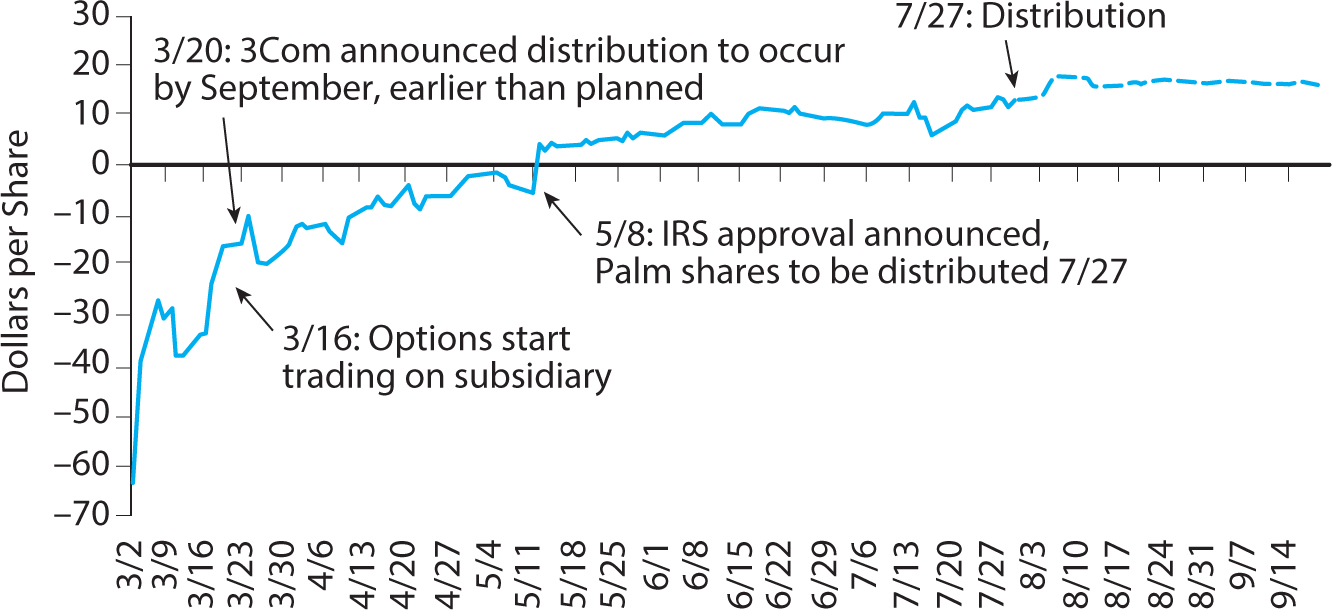
Such negative stub values occurred several times during the tech bubble when an “old economy” firm (“brick and mortar business”) carved out a tech subsidiary. The price of the tech subsidiary skyrocketed relative to the parent stock price, creating a negative stub value. Figure 16.10 shows an example of the stub value of 3Com/Palm during the end of the tech bubble. The stub value started highly negative and eventually turned positive.
Negative stub values are, however, not risk-free arbitrage opportunities. Several things can go wrong. First of all, the parent firm may not distribute the shares of the subsidiary even if the parent announces an intention to do so. For instance, the distribution can have negative tax consequences unless the IRS approves a tax-free distribution. What is worse, the parent company can go bankrupt or be delisted.
Furthermore, short-selling the subsidiary can be costly, difficult, and risky. Indeed, shares in a subsidiary with a negative stub value are often expensive to sell short, and sometimes it is even difficult to locate lendable shares for the short sale. (The capitalization of the high lending fee can even contribute to the high price of the subsidiary, as discussed in chapter 8.) Furthermore, if the event trader manages to put on the short position, she risks having her position closed down at the worst possible time if she can no longer borrow the share (a “buy-in”). Also, the stub value can fluctuate wildly, creating the risk of short-term losses and margin calls.
Studying 82 negative stub-value situations, Mitchell, Pulvino, and Stafford (2002) find that for “30 percent of the sample, the link between the parent and its subsidiary is severed before the relative value discrepancy is corrected. Furthermore, returns to a specialized arbitrageur would be 50 percent larger if the path to convergence was smooth rather than as observed.”
What happens if the parent retains the shares in the subsidiary? Is a negative stub value still an arbitrage opportunity in this case? Possibly, possibly not. If the parent is a sound firm with little debt, the market should recognize the discrepancy and the stub value turn positive over time. On the other hand, if the parent has large liabilities that are worth more than the value of its assets outside the subsidiary, then there is nothing strange about having a negative stub value. Or if the management is entrenched and expected to waste significant assets, then this can also explain a low stub value. That being said, event managers also sometimes get excited about buying positive stub values if the stub value seems low relative to the value of the rest of the parent company. When evaluating such cases, the event manager must consider the value of the subsidiary, value the rest of the parent, and consider the various liabilities.
16.3. DISTRESSED INVESTMENT AND OTHER EVENT-DRIVEN INVESTMENTS
Distressed Investments
Some event-driven managers specialize in distressed investments, often the debt of firms in financial distress. Distressed firms include both firms that are already in default (e.g., in Chapter 11 in the United States) and struggling firms that are getting close to bankruptcy. Such struggling firms are sometimes defined as those with a credit spread over comparable-duration Treasuries of more than 1,000 basis points (bps). This credit spread means that the price of the firm’s debt is so low that its yield to maturity is more than 10 percentage points higher than the yield on Treasuries. While this credit spread is large, so is the risk of not getting paid. In fact, a passive investment to distressed debt has historically not been well compensated according to some indices, surprisingly.
Hence, distressed managers must be active to add value. Indeed, companies in distress often present significant opportunities and risks as the underlying business is in flux and the various stakeholders may attempt to extract the remaining value. An event manager can approach a distressed investment in many different ways. In particular, an investor can take an ownership in debt or equity and attempt to help improve the business. For bankrupt companies, the event manager can try to help the company get a new start by securing debtor-in-possession (DIP) financing, which is more senior than all unsecured creditors (and therefore must be approved by the bankruptcy judge) or help the company emerge from bankruptcy with exit financing.
The event manager must also actively protect his investment, for instance, by serving on the creditor committee. Indeed, equity holders or other debt holders may try to extract value from the company, which can be detrimental to the remaining debt holders. Event managers can also try to renegotiate the debt or to buy securities directly from the firm, the firm’s bank, or other stakeholders (e.g., bond holders). The event manager can even seek to get control of the company.
Event managers also sometimes try to profit from the price pressure that occurs when companies are downgraded to speculative grade, enter financial distress, or go bankrupt. Such situations can lead to selling pressure as many investors need to, or want to, offload distressed securities. The event managers can provide liquidity, but they need to carefully study risk, including the chance that the business can be turned around so that the company becomes profitable, the chance that the company can survive until then, the recovery in case of default, and each security’s place in the capital structure.
Capital Structure Arbitrage
A classic arbitrage trade is to trade one security against another security issued by the same firm. For instance, to buy a corporate bond of a company while shorting the equity, to trade a company’s stock against its preferred stock, or credit default swap (CDS) against stocks or bonds. This so-called capital structure arbitrage is not a bet on whether the company is good or bad as a whole but rather a bet that one part of the capital structure is cheap relative to another.
This trade is based on the idea that all claims to the firm (equity and liabilities) are really derivatives of the firm value and arbitrage opportunities arise if these securities are not priced consistently. For instance, the event manager can consider the equity price, firm leverage ratio, and equity volatility to determine the fair value of the corporate bonds and then buy low and sell high.
Changes in Capital Structure
Another event arbitrage play is to trade around changes in a firm’s capital structure, for instance, share buybacks, share issuances, debt issuances, or debt exchanges. One set of event trades speculates that the capital structure change favors one part of the capital structure (at the expense of other parts). For instance, an equity issue may benefit bond holders and the market may not immediately fully price this in.
More broadly, when a firm buys back shares or retires debt, this often signals management confidence. On the other hand, issuance of securities, especially stocks, can signal that the securities are overvalued or that there are agency problems in the firm. However, participating in a security offering can be profitable if there is an average underpricing and if the event manager can avoid adverse selection in terms of allocation of shares—e.g., if the event manager is allocated shares even in the most oversubscribed offerings. Furthermore, the market for rights offerings sometimes involves arbitrage opportunities, as do when-issued markets.
Special Security Structures and Market Dislocations
Event managers also find opportunity in special security structures, such as ETFs and closed-end funds. Sometimes the value of the holdings of such securities differs significantly from the value of the shares, which gives rise to trading opportunities betting that the values will converge. Also, apparent mispricing can occur for special purpose acquisition companies (SPACs) and private investments in public equity (PIPEs), but these are highly illiquid investments subject to liquidity risk.
Event opportunities can also arise in connection with firm-specific or marketwide market dislocations. For instance, if a firm’s equity is included in a stock index, this has historically led to a predictable average increase in price around the inclusion date as index investors buy, although this effect is not strong anymore. Similarly, a stock that is excluded from an index may drop in price around the deletion. In terms of dislocations for a broader market, John A. Paulson’s subprime trade is the most famous and most profitable example.
16.4. INTERVIEW WITH JOHN A. PAULSON OF PAULSON & CO.
John A. Paulson is the president and portfolio manager of Paulson & Co. Inc., specializing in global merger, event arbitrage, and credit strategies. Founded in 1994, Paulson & Co. has received numerous awards and became widely known for the successful bet against the subprime market in a trade that has been called “The Greatest Trade Ever.” Paulson graduated from New York University in 1978 and received his MBA from Harvard Business School in 1980. Before forming his investment management firm, he was a general partner of Gruss Partners and a managing director in mergers and acquisitions at Bear Stearns.
LHP: How did you originally get interested in event-driven investment?
JAP: I first learned about risk arbitrage when I was a student at NYU and I signed up for a seminar-type course taught by Gustave Levy. He was the Chairman of Goldman Sachs and a graduate of NYU, and he had previously run the risk arb desk at Goldman Sachs. Unfortunately, right before the course started, Gustave Levy passed away. John Whitehead was made the Chairman, and John Whitehead stepped into Gustave’s shoes and took over the class.
John knew how important the class was. He taught and he also brought in the head partners in charge of mergers and acquisitions, risk arbitrage, and corporate finance to teach one class each. That partner who was running risk arbitrage at the time was Bob Rubin, who ultimately became Chairman of Goldman Sachs and then Treasury Secretary. So that was my initial introduction to risk arbitrage.
Risk arbitrage has been an important investment strategy for Goldman Sachs and Bear Stearns for—looking back—for approximately the last 80 years. And it has been such a profitable part of the firm that the successive chairmen and heads of the firm have tended to come from the risk arb department. That’s what happened with Gustave Levy, and that’s what happened with Bob Rubin. And it’s not hard to see why. If you’re allocated $1 billion in capital and you’re up 20%, then your group just produced $200 million of profits for the firm. It’s very hard to produce individually those kinds of fees as a traditional investment banker giving advice on mergers or corporate finance. So the risk arb departments at both Bear Stearns and Goldman, when they were partnerships, generally became the most profitable parts of the firms.
When hedge funds started, the partners or junior people left the banks and formed their own hedge fund to do this same strategy. As time went on, the investment banks had so many conflicts of interest that it became difficult for them to compete against the hedge funds, which didn’t have any conflicts of interest. And now these investment banks have gone public and they’ve become regulated by the government. And under the new rules, what’s now called the Volcker Rule, they’re not allowed to do proprietary trading any more. So the banks are sort of out of this business today. That has left hedge funds as the dominant players now in risk arbitrage.
LHP: Can you describe your investment process?
JAP: Risk arbitrage, generally, is investing in securities of corporations going through a corporate event where the return is not based on the stock going up and down but the success and completion of the event. The primary area of risk arbitrage tends to be merger activity. The second most important part for us is bankruptcy investing, when corporations go bankrupt and they reorganize in bankruptcy. This involves some very significant restructuring of the debt—either turning it into equity and reemerging as a private company, or other types of maneuvers. And then the third category would be more general, other types of corporate restructurings, which includes spin-offs and recapitalizations like the one at Apple, where companies borrow money and then pay their shareholders a big dividend.
LHP: How do you approach merger arbitrage?
JAP: In a merger situation, generally what happens is that the acquirer makes a bid for the target, either all cash bid, or a stock bid, or a combination of cash or stock, or any other form of consideration, where the target stock runs up close to the offer price but trades at somewhat of a discount to the offer price because of the risks of failure of deal completion.
LHP: And you seek to earn that spread?
JAP: Yes. That spread, adjusted for the time outstanding, becomes the annualized return from investing in a risk arbitrage situation. Take a simple example: Company A is trading for $30; it receives a $50 bid, and the stock goes to $49. And there’s a $1 spread left. You buy it for $49 to make $1 when you sell it for $50.
But if the deal breaks down, the stock could fall back to $30. So in this case, you would have $1 on the upside, but $19 on the downside. Obviously, it’s not a game for the faint of heart. Most people who owned the stock before, they don’t want to hold onto it. They don’t like that risk–return, so they sell it.
Now, why would I buy it? If I buy the stock for $49, I make $1; a dollar simply over $49 is about a 2% return. But let’s say the deal closes in 60 days, 2 months. It’s a tender offer. If you can make a 2% return in two months, that is equivalent to a 12% annualized rate of return. So it looks like a small amount of money, but on an annualized basis, could be a decent return. If you do that repeatedly, you could earn a return that on average is more than the return in the market.
The other advantage of this strategy is that it doesn’t depend on the overall market. Let’s say you buy the stock at $49, but after you buy it, the stock market falls 30%, the whole market crashes. Well, that shouldn’t affect the outcome of this particular transaction. The companies involved are not paying attention to the market. So sure enough, 60 days later, this deal closes, I’ve still made a 12% annual return in an environment where the market went down. So not only are the returns on average higher than the market, they’re also uncorrelated to the market. You don’t need the market to go up in order to make this return.
LHP: But there are risks, though?
JAP: Yes, and what you need is an expertise in evaluating deal completion risk. With 19 points in the downside and one on the upside, what is the actual risk of this deal being completed? What is the regulatory risk? Will they get antitrust approval? Assessing that risk is very specialized to our profession. For example, the average investors who owned the stock before the bid may have no idea about antitrust law. They don’t know what the issues are, how many deals have been approved, how many deals haven’t been approved. They don’t know the antitrust situation in the U.S. or Germany or China. Plus, there are many different regulatory approvals in addition to antitrust.
Average investors also don’t read the merger agreement, which dictates the terms upon which the merger would be completed. Certain merger agreements could have an out; for instance, if the market falls 10%, the buyer has the right to walk. Well in that case, with the stock market falling 30%, the buyer would say, “Hey, I don’t want to buy this anymore.” He has a legal right to exit.
So before you start playing the arbitrage, you certainly need to read the merger agreement, but to fully understand the merger agreement, you have to be a very good merger lawyer. To play this game, you need a lot of expertise related to the issues that affect deal completion. You have to be able to understand merger agreements. You have to understand regulatory issues. And it’s not just antitrust. There’s all sorts of banking regulations, insurance regulations; there’s federal regulations, and state regulations.
LHP: And the deal could fail because of problems with the financing of the trade?
JAP: Yes, it could be the financing. So you have to know does the acquirer have the money? Is there bank financing? Is it contingent on bank financing? Have you read the terms of the bank financing? Certain bank commitments are very tight, very difficult to get out of. Certain of them are very wide. So without doing all this work, you’re at a disadvantage in evaluating this particular risk.
So that’s where the experts come in. That’s all we do. So we have an advantage in playing this game against basically 99% of the market that’s getting engaged in the security after a bid is announced. And we can turn that knowledge into an investing advantage and use it to produce returns on an average better than the market that are also uncorrelated.
LHP: But you’re not just competing with the general public—there are other merger arb experts out there.
JAP: Yes, there are other merger arbs out there, but they have various degrees of expertise. Our advantage is our expertise. Now, where did I get my expertise? Before I started working in risk arbitrage, I was a partner in mergers and acquisitions. All I did was live and breathe mergers, financing agreements, merger agreements, hostile bids, friendly bids, spin-offs, etc. So I had a high degree of expertise in all these issues when I started the firm. Now, I’m not a lawyer, I’m a banker, and while I’ve negotiated a lot of legal agreements, I know my limitations so we hired top M&A attorneys to be our legal advisors.
LHP: So how do you apply this expertise in merger arbitrage? For instance, do you try to anticipate that bids will be topped by competing bidders?
JAP: Well, when we talk about deal spreads, it’s the initial way to look at merger arbitrage. But you also have to do the valuations. Say Company B is paying $50 a share for Company A, but what multiple of earnings is that? What multiple of EBITDA [earnings before interest, taxes, depreciation, and amortization]? How’s Company A growing? What other acquisitions occurred in this sector? Could there be someone else that could pay a higher price?
The first thing we do is we compute all the acquisition multiples: multiple of earnings, book value, EBITDA, EBIT. I compare it to the growth rate. And then we go into our proprietary database of all public data on acquisitions that have occurred in different industries. So if this is in, let’s say, the media industry or the telecom sector, I can immediately pick up a comp [comparison] sheet. I can see everyone that bought everyone in TV stations over the last 5 or 10 years and what multiple they paid. Let’s say, the average multiple is 12. And then I look at this deal. This deal’s being done at 10. This immediately raises a red flag—it seems to be somewhat underpriced.
Well, why is this underpriced? Was this an auction? When the company sold itself, did they hire a Goldman Sachs and shop it to all the media companies? If they did, then everyone already saw it and it’s unlikely someone else is going to bid.
If, however, we find that this was just a negotiation between the buyer and seller, then other people did not know this was for sale. So they’re going to hear about it the first time when this deal is announced. And they’re going to do the multiples, and they’re going to see this is trading for less than the others and may encourage some interest. Now all the other bankers, they’re going to want to get a fee. So they’ll likely go to their clients and say, “Do you see this company? It’s trading for 10x. You just bought someone at 12x in the same territory. Why don’t we see if we can make a higher bid?”
Then you’ve got to read the merger agreement. Is there any particular shareholder that locked up their stock? Is there voting stock and non-voting stock? What’s the agreement between the shareholders and the buyer? Is there a breakup fee in the merger agreement? If someone else comes in, do you have to pay a premium to the previous buyer, which may dissuade someone else coming in?
At the end of the day, if the deal looks cheap and you can identify other potential acquirers, then instead of taking an average position of 1% or 2%, you say: “You know what? I think it’s a very high probability this deal gets closed, and very, very low chance it’s not completed. And a reasonable probability someone else may come and bid.” In that case, I’m not just going to take an average position, I’m going to take a 10% position in this portfolio. I’m going to buy as many shares as I can get, maybe even up to 10% of the company.
LHP: So even when you really like a deal, you have a position limit, which is both 10% of your own assets and 10% of the company?
JAP: Yes, we do have position limitations. Because after all, no matter how sure you are or how sure you think you are, or how you think it could work out, you play this enough times, it’s not always going to work out as anticipated. So you always have to watch the downside. If you overconcentrate and you’re wrong, you could get hurt. We generally limit our largest position size to 10%, so we’ll always operate in a diversified sense. Now, obviously, if I put 100% of my money in a deal that gets a topping bid, I make a fortune. But if something goes wrong, something breaks the bid, you can lose a fortune. We’re not into losing a fortune.
The key thing in making money is not losing money. You have to think first about the downside and size your position to not how much money you could make, but how much money you could lose. You’ve got to set your limits based on your tolerance for loss within the overall portfolio.
LHP: So you overweight deals that could receive a topping bid while staying relatively diversified?
JAP: Yes. If I like the company, I’ll buy up to 10% of the company. When the deal is announced and the stock goes from $30 to $49, a lot of the institutions don’t want to hold it for the last dollar, so as they sell, I can quickly get 9.9% of the company. Now let’s say we’re right and someone else comes along, and instead of offering $50 they offer $60. So instead of making $1, I’ll make $11. If $1 was a 12% rate of return, $11 would be 120%. So this can turn into a very high-return strategy. Weighting your portfolio to that deal means that, if that happens, it’s going to have a disproportionate effect in your portfolio.
LHP: Can you give a specific example of such a trade?
JAP: We did it with Sprint last year. SoftBank made a bid to buy 70% of Sprint for $5.75 a share. So we did the multiples like I just described, and it was a low multiple relative to other wireless companies that traded. We thought there’s a chance someone else could come in. So we bought 220 million shares of Sprint. Obviously, we made a big investment. So let’s say $5.75 times 220 million, we put about $1.3 billion into this one stock. And then we waited. Well, lo and behold, Dish showed up and offered $7 a share. And that forced SoftBank to come back at $7.75 a share. We wound up making $2 a share very quickly on 220 million shares or, in real-life terms, $440 million in this one merger transaction.
LHP: What are the other elements of merger arbitrage?
JAP: Obviously, you can see when a deal’s announced, it could be at a 30%, 50%, or even higher premium to where the stock traded the day before or a week before the announcement. So this is a big payday if you could anticipate which company could be taken over next and then own that stock prior to the announcement of the bid.
Obviously, that’s where it creates a possibility for fraud; that’s where insider trading comes in, where people try to gain an advantage by trading on inside information. That’s something we’re not interested in. We have very strict policies here about having access to inside information. If, by any chance, we inadvertently get inside information, then we obviously won’t trade the stock. But that doesn’t mean you can’t try to figure out which company will be taken over next. There’s nothing illegal about doing that as long as you’re doing it based on an industry analysis and not on any special information.
We’ve set up our firm to have experts in each industry, so when there’s a merger announced in, say, telecom, we have people that only do telecom mergers. So we have both the industry expertise and the merger expertise. In the case of the telecom industry, by having people that focus just on that and meeting with all the executives and doing this for years and understanding who bought who, why they bought that company, and who may want to buy someone else.
LHP: So you try to anticipate mergers before they happen in an industry going through a consolidation?
JAP: Exactly. When you start to see consolidation in the industry, it starts to become kind of apparent who’s next. In the telecom sector, you have Verizon, which is biggest. Then you have AT&T. But then you have the smaller players. You have Sprint. You have T-Mobile. Before this, we had MetroPCS, and then Leap Wireless, then Clear Wireless, so you had seven national players. As the industry’s growth started to slow and the need for capex [capital expenditure] started to grow, it was apparent that these smaller guys could not survive as independents any more. So it was possible for us to anticipate, who is likely going to get acquired and acquire those stocks in anticipation of them being acquired. And then, the way it worked out, they were all acquired: Sprint by SoftBank, MetroPCS by T-Mobile, Clear Wireless by Sprint, and Leap by AT&T. In the case of Leap, we had a 9.9% stake and AT&T paid a 110% premium.
LHP: Let’s turn to distressed investment and bankruptcies. How do you trade these?
JAP: Bankruptcy investing is also a very attractive area where there’s a limited amount of expertise. When a company goes bankrupt, bondholders often don’t know what to do with the bonds. You get a lot of the traditional holders selling the securities. Then people who specialize in bankruptcies buy these securities and go through the process of restructuring the company, either reorganizing the company so it emerges as a well-capitalized, hopefully, healthy company or, on the other side if the business prospects are poor, investors may go through a liquidation. It’s very complex. You need a similar but different set of skills than a merger arbitrage. You need different legal expertise, although the financial analysis can be similar.
LHP: Can you give an example of a bankruptcy trade?
JAP: We have many examples, as we were very active in the bankruptcy investing in the last recession. I’ll give you one. It was a hotel chain called Extended Stay Hotels. They have about 670 owned and operated hotels across the U.S., and they were purchased in a leveraged buyout in 2007 for $8 billion, $7 billion of debt and $1 billion of equity. At the time, they were making about $550 million of EBITDA, so they were bought at a relatively high multiple of 15 times EBITDA, thinking that the earnings would continue to grow.
Lo and behold, the economy went into a recession after Lehman Brothers failed. As economic activity collapsed and business activity fell, people started traveling less. The occupancy at Extended Stay Hotels fell, and their EBITDA went from $575 million to $250 million. At $250 million, they couldn’t support $7 billion of debt, so they defaulted on their debt and went into bankruptcy.
We knew this company. We knew the capital structure. We also know that hotels are cyclical: They go down in recessions and they go up when the economy recovers. So there was nothing the matter with the chain. The problem was that they had too much debt and the cycle turned against them.
So we thought this would be an attractive company to control, and we bought a big chunk of debt in bankruptcy. There was another hedge fund that we knew that also bought a big chunk of debt in bankruptcy. As the economy started to recover, we decided we wanted to lead a reorganization of Extended Stay. But the other hedge fund also decided the same thing. Rather than compete, we decided to pool our respective debt positions together. By doing that, we controlled over one-third of the debt. In bankruptcy, you need two-thirds of the creditors to approve a bankruptcy plan. Controlling one-third of the debt essentially gave us veto power over any reorganization.
Since no one could reorganize this company without our approval, we were in the pole position to lead the restructuring. At the end of the day, we did that. We brought in Blackstone as a partner and wound up buying the company out of bankruptcy by paying off all the creditors for $3.9 billion in cash, down more than 50% from what their company traded for two years before. As part of this structure, we put up $500 million, Centerbridge put up $500 million, and Blackstone put in $500 million. Together we put in $1.5 billion of equity and then raised $2.4 billion of first mortgage debt.
So we had the $3.9 billion, and we bought Extended Stay, a 50% discount to the price paid three years before. We did some management changes, some restructuring, but basically, as the economy recovered, the earnings went up. Now Extended Stay is back to the level of profitability it was before, making roughly $600 million in profits. Then we took it public and with the proceeds we paid down the debt. Now the company again has a value of $8 billion. We paid off about $400 million of debt, so there’s only about $2 billion of debt. So that means the equity value is $6 billion. So we put in $1.5 billion in 2010, and now that $1.5 billion is worth $6 billion. That’s a good example of a bankruptcy reorganization.
LHP: Your most famous credit play is your subprime trade. When I interviewed Soros, he actually said that you sized that trade based on his ideas about how to go for the jugular when the payoff is very asymmetric—is that right?
JAP: Yes, it’s true. And it is important to read books like the one you’re writing. When I was starting in the business, I read a book on Soros, called Soros on Soros. It was his investing philosophy. I remember when he decided to short the pound, one of his analysts came in, they were discussing it, and George thought it was a great idea. The analyst suggested a certain size. George said well, that’s too small. Good investment ideas don’t come around that often. When you find a great one, you can’t be passive. You have to go for the jugular, he said.
LHP: So how did you apply this for the subprime market?
JAP: We had been involved in bankruptcy reorganizations, like the one I described before, coming out of the recession of 2002, but by 2006 the credit market had become so frothy and yields had become so tight that we sold our long positions. We felt that the best opportunities were on the short side. We did a pretty thorough analysis of all the credit markets and felt that the most overvalued securities were subprime mortgage securities. At the time, the BBB-rated tranches of subprime securities were trading only for 1 percentage point more than Treasuries, so if you shorted a subprime bond and went long a Treasury bond of the same maturity, you earned, let’s say, a 5% yield from the Treasury bond and paid a 6% yield on the subprime. Your net cost was 1% to be short the subprime.
We felt ultimately that these BBBs in a housing downturn could go to zero; we had found a tremendously mispriced security with a very asymmetrical return profile—if the worst happens, you pay 1%, and if what you expect to happen actually happens, you make 100%. It was 100-to-1 risk–return trade-off. And the more work we did on these subprime securities in the housing market, the more convinced we became that the probability of these going to zero was very, very high. The economics just didn’t make any sense at all. And we were right in the middle of a tremendous credit bubble.
So we initially shorted $100 million of these bonds, and $100 million is a lot of money. But, we said it’s only costing us $1 million. At the time we’re managing $6 billion. So we said, “Well, don’t look at the $100 million, just look at the cost of the trade: when you go long and short against Treasuries, we couldn’t lose more than $1 million a year.” So we said, “Let’s size it up.” We took it up to $500 million; still can only go down $5 million a year. So we took it up to $1 billion, $2 billion, $3 billion. As the work went on, we became more and more convinced this was going to happen. So how big should we get with this?
That’s when I remembered George Soros’s comment. When you really find the great investment, “you have to go for the jugular.” So I said, “You know what? Forget about the numbers. This is the greatest risk–return trade-off I’ve ever seen. I’m not going to sit here with this—we’re going to go for the jugular.” Ultimately, we took the position up to $25 billion short securities. George’s comment was a big part of us sizing up that position.
LHP: What analysis made you convinced that the subprime BBB securities would collapse?
JAP: It is worthwhile to understand what the structure of subprime securities were. These structures were amazing credit contraptions. Let’s say they took $1 billion of subprime mortgages and they put them into a pool, then they sold securities against that pool that were tranched into about 15 different layers. So that means if a loss happened, that started at the bottom; whereas the most senior tranches got paid off first. The top layer was AAA securities and then they had AAA1, 2, 3, 4, 5, and 6, which represented about 70% of the structure. After these seven layers of triple-A, they had AA-plus, AA-flat, AA-minus. And then they went to A-plus, A-flat, and A-minus. Then came the BBBs (BBB-plus, BBB-flat, BBB-minus), and, below these, the non-investment-grade BB securities and the equity tranche.
The BBBs had so much demand because they were the last investment-grade layer and therefore had the highest yield amongst all the investment grades. A lot of institutions globally wanted investment-grade securities but wanted the most yield they could get. So there was an enormous demand for the BBB securities.
But all you needed was a loss of 6% in the subprime pool and the BBB was wiped out. Losses first hit the equity layer. A 3% total loss and the equity layer would be wiped out. Then you had the BB tranches. Then BBB-minus, then BBB, then BBB-plus. Then you go to the A on up. But the cutoff point for the BBB securities was only about 5%, and it was only 1% thick, so a 6% loss would wipe it out.
When the market started to implode, the default rate in subprime securities went from 10% to 15% to 20% to 30% to 40%. Once a loan defaults and then you sell the house, the recovery on these loans was less than 50%. So if you take a 40% default rate and a 50% recovery, you’re talking about losses that are going to extend up to 20% of the capital structure. So that’s what was happening. The BBBs wiped at 5%.
LHP: How did you manage to stay in the trade to the end? As the crisis gradually unfolded, many investors might have been tempted to close the position halfway when you were already up tremendously.
JAP: That’s a very good question. When the BBB started to fall, they fell from par to 90, 80, 70, 60, 50—people were saying, “Why don’t you get out? You made all this money. Where are you going to take it?” They didn’t understand that the loss rates in these pools were now obvious. The default rates were so high. The foreclosures were happening, and our prediction was these pools were going to lose north of 20%. And that was just almost in the bag, if you just let the thing run out, the defaults run into foreclosures. That’s what you’re going to get. And all I needed was 5% to make 100 cents on the dollar. So I’m saying, “Why am I going to close that at 50? All I’ve got to do is be patient and as the default rate continues to rise, as house prices continue to fall, as losses build up, these securities are going to be wiped out.”
So I wasn’t looking at these and thinking “Those fell from 100 to 50. Oh, I’m scared, they may go back to 100.” If you knew the underlying collateral and had all the data, you knew they were toast. There was no hope of any recovery. And if we just waited, the market would eventually catch up and they’d go to zero. And that’s what we did. We waited and they went to zero.