Figure 1006: Android Studio, Android Monitor, Memory Tab
Android Studio’s heap analyzer is your #1 tool for identifying memory leaks and the culprits behind running out of heap space. Particularly when used with Android 3.0+ versions of Android, the heap analyzer can tell you:
Android Studio’s heap analyzer builds on the earlier Memory Analysis Tool (MAT), used by Java developers, and by Android developers prior to Android Studio.
However, Android Studio’s heap analysis leaves a lot to be desired. Not only do you have to manually examine and check heap dumps, but you get a lot of false positives due to bugs in Android. A library that helps with both of these issues is LeakCanary, and we will examine it in this chapter as well.
Understanding this chapter requires that you have read the core chapters and understand how Android apps are set up and operate, particularly the chapter on Android’s process model. Reading the introductory chapter to this trail might be nice.
The first question is: when do we bother looking for leaks? Complex apps are complex, and so we might spend a lot of time looking for leaks that either do not exist or do not matter much.
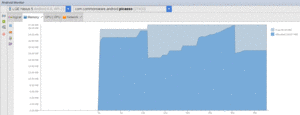
In Android Studio, tabs inside the Android Monitor tool allow you to examine the real-time behavior of your app with respect to various system resources, such as heap space in your app. These tabs appear alongside the “logcat” tab, in a tab strip towards the top of the Android Monitor tool frame.
Figure 1006: Android Studio, Android Monitor, Memory Tab
The darker blue shows how much heap space we have allocated, including outstanding garbage. The light blue shows how much free space is in the heap. The overall height indicates the size of our heap.
When you see the dark blue line drop, that means the system performed a garbage collection. Our heap size stayed the same, but memory moved from the allocated state to the free state.
When you see the light blue line rise, that means the system got more
memory from the OS and increased the size of our heap. This can continue
to the point of reaching the heap limit for the app (getMemoryClass()
on ActivityManager).
On Android 5.0+ devices, the light blue line can also fall… while your app is no longer in the foreground:
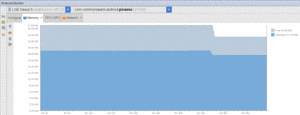
Figure 1007: Android Studio, Android Monitor, Memory Tab, Showing Shrunken Heap
Here, the app was moved to the background. A little while after that occurs, ART will do a more aggressive garbage collection run, including moving objects in heap space to coalesce free blocks. If this frees up some of the allocated pages from the OS, ART can then free those pages, returning the memory to the OS and reducing our app’s overall memory footprint.
You can also perform a manual garbage collection run by tapping the “garbage truck” icon in the toolbar in the memory tab (second down from the top, below the “pause” icon):
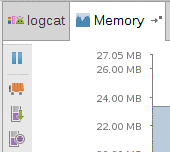
Figure 1008: Android Studio, Android Monitor, Memory Tab, Toolbar
Anything in dark blue that survives a full garbage collection (whether manual or ART-induced) represents objects that cannot be garbage collected. If, over time, the level represented by that dark blue area keeps climbing, that suggests a possible memory leak.
Note, though, that the Y axis will automatically rescale, as the overall heap size climbs. That affects everything currently visible in the graph, but that is only ~45 seconds of history. Pay attention to the numbers shown in the legend (in the screenshots, on the right) in addition to the apparent level based upon the graph itself.
If we have a leak, though, while the memory tab will suggest that we have a problem (ever-growing amount of allocated objects after a garbage collection), it will not tell us exactly what is going wrong. For that, we need to analyze our app’s heap.
The first step to analyzing what is in your heap is to actually get your hands on what is in your heap. This is referred to as creating a “heap dump” — what amounts to a log file containing all your objects and who points to what.
In the Android Monitor tool in Android Studio, when you have selected a process in the list, a “Dump Java Heap” toolbar button will be enabled in the Memory tab:
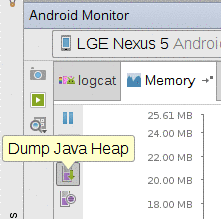
Figure 1009: “Dump Java Heap” Toolbar Button in Android Studio
Tapping that, and waiting a few moments, will show the results of the heap dump in a new tab. These results are also saved in your project and are available from the Captures tool later on:
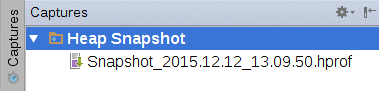
Figure 1010: Android Studio, Heap Snapshot in Captures Tool
The actual heap dump data itself — known as an HPROF file –
is stored in a captures/ directory off of your project root. If
you wish to use a different tool for analyzing the heap dump, such as
MAT, you may be able to use that HPROF file. Note, though, that HPROF
files are rather large.
Another possibility is to trigger the heap dump yourself from code.
The dumpHprofData() static method on the Debug class (in the
android.os package) will write out a heap dump to the file you
indicate. Since these files can be big, and since you will need to
transfer them off the device or emulator, it will be best to specify
a path to a file on external storage, which means that your project
will need the WRITE_EXTERNAL_STORAGE permission.
To view the results in Android Studio, you will need to transfer the file from wherever you saved it on the device or emulator to your development machine.
Having a heap dump is nice, but we need tools to determine exactly what is in there and what that means for our app. Fortunately, Android Studio nowadays has an integrated HPROF file tool to let us poke around with the contents of our heap and figure out where we are going wrong.
The tab that you get from viewing a heap dump is… a little difficult to understand at the outset:
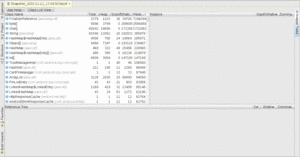
Figure 1011: Android Studio, Heap Snapshot Tab
Let’s break this down into component parts.
The table that comes filled in with data is a list of classes and primitive arrays, sorted by “retained size”. This indicates how much memory those objects, and everything that they point to, consume.
The other columns of particular interest here are:
(the difference between “Total Count” and “Heap Count” is undocumented, unfortunately)
The drop-down above the table that defaults to “App heap” will have other options on Android 5.0+ devices. Specifically, you can switch between the regular heap, the undocumented “image heap”, and the equally-undocumented “zygote heap”. The zygote is a core OS process, started when the device boots; all Android SDK apps are forked off of the zygote. Given that and other announced ART tidbits suggests that:
The drop-down above the table that defaults to “Class List View” can be toggled to “Package Tree View”, which turns the table into a tree-table, for navigation by Java package name, with primitive arrays interspersed alphabetically:
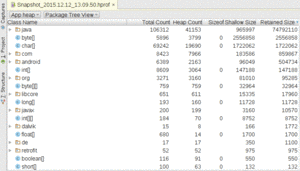
Figure 1012: Heap Snapshot Tab, Package Tree View, As Initially Launched
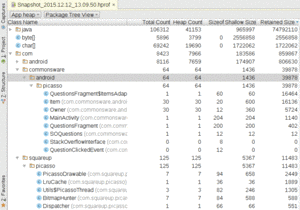
Figure 1013: Heap Snapshot Tab, Package Tree View, Drilled Down Into Packages
If you click on a class in either the class list view or the package tree view, a table on the right will show a list of the instances of that class that were found in your heap:
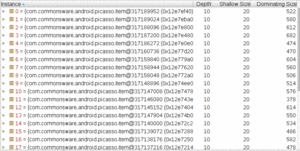
Figure 1014: Heap Snapshot Tab, Instance List
The “shallow size” refers to the number of bytes consumed directly by that particular instance, such as by primitive fields. The “dominating size” roughly equates to “how much memory can this object be blamed for”. In other words, if that object could be garbage-collected, how much would we recover, not only from the “shallow size” but from other objects uniquely referenced by this object?
The “depth” refers to how many hops away from a garbage collection root (“GC root”) this object is.
This table initially appears as a simple table. In reality, though, it is a tree table. You can expand nodes in the tree to drill down into all the objects referenced by a particular instance:

Figure 1015: Heap Snapshot Tab, Instance Tree
If you highlight an instance in the instance list — or if there is only one instance of the class — the Reference Tree view will be populated. This lists the instance you chose, and drills down into the objects that reference this instance. So, if the tree in the instance table shows you what Object X holds onto, the reference tree shows you what holds onto Object X:
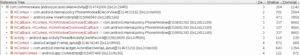
Figure 1016: Heap Snapshot Tab, Reference Tree
You can further expand the tree to see who references some of those references, and so on.
All of that is just great, but you still need to determine if you have a memory leak and, if so, where is it coming from.
Google recognizes that finding memory leaks is troublesome. The heap snapshot tab has an “Analyzer Tasks” view — by default docked on the right — to try to automate certain checks:
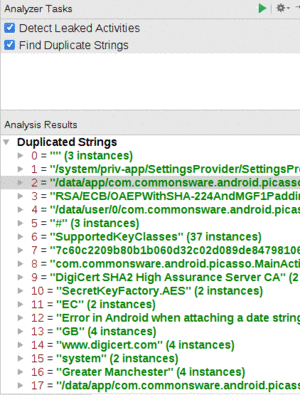
Figure 1017: Heap Snapshot Tab, Analyzer Tasks
Clicking the run button in the analyzer tasks toolbar will perform the automated checks.
The two checks that are automated today are finding leaked activities (i.e., activities that have been destroyed but cannot yet be garbage-collected) and duplicate strings. However, most of the duplicate strings are from the framework and zygote, not your code. So, while you may wish to skim through the list of duplicate strings to see if there are any that you recognize, in general they will not be all that useful.
We will see leaked activities more later in this chapter.
Since the automated checks only catch so many things, you may have to find leak candidates the old-fashioned way: by eyeball. Basically, you rummage through the class list or package tree, looking for classes that either:
Bear in mind that the act of generating a heap dump only logs objects that are reachable from other objects, or themselves are considered “garbage collection roots” (a.k.a., “GC roots”). Any objects that are actual garbage, but perhaps have not yet been collected by the garbage collector, do not appear in the dump. Hence, if you see it in the heap snapshot tab, the objects are “real”, not uncollected garbage.
Conversely, just because you find an object in the heap does not mean that it is truly “leaked”. For example:
With all that in mind, let’s look at a few common scenarios of leaking objects, to see what those leaks look like when we do a heap dump and analyze that dump in Android Studio.
The
Leaks/StaticWidget
sample project does something naughty:
package com.commonsware.android.button;

import android.app.Activity;
import android.os.Bundle;
import android.widget.Button;

public class ButtonDemoActivity extends Activity {
  private static Button pleaseDoNotDoThis;

  @Override
  public void onCreate(Bundle savedInstanceState) {
    super.onCreate(savedInstanceState);
    setContentView(R.layout.main);

    pleaseDoNotDoThis=(Button)findViewById(R.id.button1);
  }
}
We take a widget (specifically a Button) and put
it in a static data member, and never replace it with null.
As a result, even if the user presses BACK to get out of the
activity, the static data member holds onto Button, which itself
has a reference back to our Activity.
Because we are leaking an activity, the analyzer tasks can automatically find this leak for us:
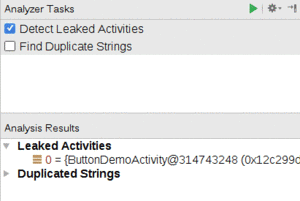
Figure 1018: Heap Snapshot Tab, Analyzer Tasks, Showing Leak
Tapping on that ButtonDemoActivity entry in the analyzer tasks
brings it up in the instance table and reference tree:
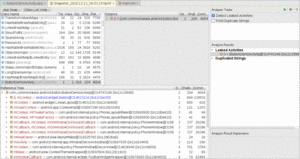
Figure 1019: Heap Snapshot Tab, Showing Leak
The reference tree is sorted in descending order by depth. Hence, usually, the source of your leak will appear fairly early on in the tree. In our case, it happens to be the first entry:
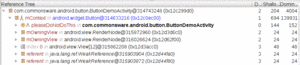
Figure 1020: Heap Snapshot Tab, Showing Leak and Path to a GC Root
The leaked object (ButtonDemoActivity) is referenced by an mContext
field in a static pleaseDoNotDoThis field in ButtonDemoActivity
itself. The latter item has a depth of 0, so we know that it is a
GC root. The hope is that you will recognize some of the items shown
here (e.g., field names like pleaseDoNotDoThis) and can see how those
items affect the ability for Android to garbage collect the leaked object.
The
Leaks/LeakedThread
sample project does something else naughty:
package com.commonsware.android.leak.thread;

import android.app.Activity;
import android.os.Bundle;
import android.os.SystemClock;

public class LeakedThreadActivity extends Activity {
  @Override
  public void onCreate(Bundle savedInstanceState) {
    super.onCreate(savedInstanceState);
    setContentView(R.layout.main);

    new Thread() {
      public void run() {
        while(true) {
          SystemClock.sleep(100);
        }
      }
    }.start();
  }
}
Here, we kick off a Thread from onCreate() of our activity and have
it enter a pseudo-polling loop, sleeping for 100ms per pass through the
loop.
This is naughty for all sorts of reasons:
Thread
The latter two flaws combine to cause a memory leak.
Once again, the analyzer tasks pick up on this leaked activity. However, not all leaks will necessarily show up in the analyzer tasks, in part because not all leaks are leaked activities. What if we were leaking something else?
One way to find leaks is to go through the package tree view, find your Java packages for your code, and see what objects from those packages are outstanding:
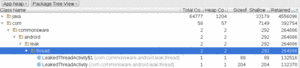
Figure 1021: Heap Snapshot Tab, Showing Classes In App Package
Here, we see that we have leaked two objects. One is LeakedThreadActivity.
The other is an anonymous inner class of LeakedThreadActivity
(assigned the name LeakedThreadActivity$1 by the Java compiler).
Clicking on the activity and expanding the first child in the reference tree once again discloses the leak:
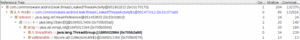
Figure 1022: Heap Snapshot Tab, Showing Another Leak and Its Path to a GC Root
Our zero-depth entry is threadRefs, which is basically the collection
of all Java Thread objects that are still alive in this process. One
of those is our anonymous inner class (LeakedThreadActivity$1), which
holds onto the activity instance.
To avoid this sort of leak:
The
Leaks/Downloader
sample project is a minor variation on a sample used in this book several
years ago, one of the precursors to the downloading samples, such as the
one shown in the chapter introducing services.
This early edition of the sample has lots of problems: using HttpClient, doing a bit of network I/O on the main application thread (now removed to avoid the crash), and so on. However, one of the more subtle bugs comes here:
  private Handler handler=new Handler() {
    @Override
    public void handleMessage(Message msg) {
      Toast
        .makeText(DownloaderDemo.this, "Download complete!",
                   Toast.LENGTH_LONG)
        .show();
      finish();
    }
Nowadays, this shows up with a yellow warning inspection in Android Studio, with the following explanation:
Since this Handler is declared as an inner class, it may prevent the outer class from being garbage collected. If the Handler is using a Looper or MessageQueue for a thread other than the main thread, then there is no issue. If the Handler is using the Looper or MessageQueue of the main thread, you need to fix your Handler declaration, as follows: Declare the Handler as a static class; In the outer class, instantiate a WeakReference to the outer class and pass this object to your Handler when you instantiate the Handler; Make all references to members of the outer class using the WeakReference object.
And, if you run the app, wait for the activity to finish() itself
(which it will do once a download operation completes), and then check
with a heap dump, you will see that the activity itself is leaked.
Unfortunately, the nature of Handler makes it a bit difficult to
see exactly why this results in a leak — the heap inspection tools
do not do a great job of pointing this out. With luck, this will be
added to a future set of automated checks.
In the chapter on threads, we had an AsyncTask demo
app that used a retain fragment to manage the task. That fragment was
a ListFragment, and it was responsible for displaying the Latin words
as those words were “downloaded” in the background by the task. Google
is not a fan of retained fragments having widgets… and the
Leaks/ConfigChange
sample project demonstrates why.
The change in this project versus the original mostly comes down to a
humble Button, which we will use to restart the download from the
beginning once it has completed:
  <Button
    android:id="@+id/again"
    android:layout_width="match_parent"
    android:layout_height="wrap_content"
    android:text="@string/btn_again"/>
</LinearLayout>
The Button itself is stored as a field in the fragment, named
btnAgain. This already raises some concerns, if we are retaining the
fragment. However, this approach is safe, if and only if we clear out
or refresh that field on a configuration change. For example, if you
used findViewById() to get the Button and assign it to btnAgain
in onViewCreated(), you would not have a problem, as onViewCreated()
is called as part of the configuration change, even for retained fragments.
However, this sample app instead lazy-initializes that data member, via
a getAgain() getter method:
  private Button getAgain() {
    if (btnAgain==null) {
      btnAgain=(Button)getView().findViewById(R.id.again);
    }

    return(btnAgain);
  }
That getter method is used in the rest of the fragment to retrieve the
Button, such as in onViewCreated():
  @Override
  public void onViewCreated(View v, Bundle savedInstanceState) {
    super.onViewCreated(v, savedInstanceState);

    getListView().setScrollbarFadingEnabled(false);
    setListAdapter(adapter);

    getAgain().setOnClickListener(this);

    if (task!=null) {
      getAgain().setEnabled(false);
    }
  }
…onClick() (as the fragment now implements the View.OnClickListener
interface):
  @Override
  public void onClick(View v) {
    getAgain().setEnabled(false);
    adapter.clear();
    task=new AddStringTask();
    task.execute();
  }
…and onPostExecute() of the AsyncTask:
    @Override
    protected void onPostExecute(Void unused) {
      task=null;
      getAgain().setEnabled(true);
    }
Nowhere do we set btnAgain to null, including after a configuration change.
So, when the activity starts up, everything is fine. However, when we
rotate the screen or otherwise undergo a configuration change, the fragment
misbehaves. getAgain() says “hey, btnAgain is already initialized, so
I can skip the findViewById() call”. But we have a different Button
now after the configuration change, and btnAgain is pointing to the
original Button. That original Button is tied to the original, pre-configuration
change Activity instance, and we have a leak, until the second
Activity is destroyed.
If you run the app, rotate the screen, and then capture a heap dump, the
snapshot will show two outstanding instances of AsyncDemo:
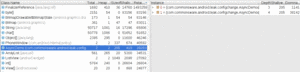
Figure 1023: Heap Snapshot Tab, Showing Two Activities Instead of One
However, this leak will be difficult to diagnose, for two reasons:
When the author of this book was testing the previous section’s demo,
he was trying to use Android Studio to confirm that the leak was caused
by the Button. As part of that analysis, he went back to the original
Threads/AsyncDemo
sample project… and Android Studio said that it was leaking the
activity.
At this point, a long series of expletives could be heard emanating from the author’s office.
To help try to suss out exactly what was going on, the author turned to a library that you may wish to consider: LeakCanary. And, as it turns out, LeakCanary indicates that the Android Studio-reported leak is a false positive, and that there is no serious memory leak.
LeakCanary is another library from the indefatigable developers at Square. It allows you to monitor certain objects to see if they get leaked. In particular, if you use the standard setup, it will automatically watch for activities that get leaked. When it detects a leak, it will dump the heap, then read in the heap dump on the device and try to determine where the leak is coming from. To help with that, it has a roster of known false positives that it can filter out, and the authors encourage the community to provide more false positives where possible.
If a leak is detected, but it is a false positive, a message will be
dumped to LogCat with the details. If a leak is detected that appears
to be genuine, a Notification will appear, leading to an activity that
will show you the source of the leak.
Adding LeakCanary to a project is fairly easy, courtesy of some well-designed defaults and a tricky use of build type-specific dependencies.
Unfortunately, LeakCanary has its own set of problems.
First, your project’s compileSdkVersion needs to be 21 or higher.
The author of LeakCanary elected to use Theme.Material on Android 5.0+
as the theme for the result activity. Even if you only plan on running
your LeakCanary-enabled app on Android 4.4 or below, to compile successfully,
you need to have compileSdkVersion set to 21 or higher, so that the
reference to Theme.Material can be recognized. If this is a problem
for your project (e.g., team decision to stick with an older
compileSdkVersion for a while), you are welcome to try to fork
LeakCanary and remove that theme.
LeakCanary also has bugs that you might trip over, including a bug that prevents it from working on low-memory environments, including some emulators.
We only want LeakCanary to be used in debug builds, not release
builds. Even if we are leaking memory, the effects of LeakCanary (including
slow heap dumps) are not the sort of thing that we should be putting users
through.
Yet, at the same time, we will need a bit of Java code to hook up LeakCanary
itself. Ordinarily, this would require setting up src/debug/ and
src/release/ sourcesets and trying to isolate the LeakCanary-specific
code to the debug build.
LeakCanary addresses this by publishing two versions of the artifact:
the real one (for debug) and a no-op one (for release). The public
API for each is identical, so your application code can build in either
case. It just so happens that the no-op artifact does nothing in response
to the API, as it merely contains stubs necessary to satisfy the API.
This is much simpler, and for coarse-grained APIs is a technique
worth emulating.
The
Leaks/AsyncTask
sample project is a clone of the Threads/AsyncDemo sample project,
but uses LeakCanary. In its app module’s build.gradle file, we have
the twin dependencies, scoped for the appropriate build types:
dependencies {
    debugCompile 'com.squareup.leakcanary:leakcanary-android:1.4'
    releaseCompile 'com.squareup.leakcanary:leakcanary-android-no-op:1.4'
}
If you have your own custom build types, you would need to adjust the
conditional dependencies to match, using the no-op one for any build
that should not have the real LeakCanary in it.
Usually, if you are going to use LeakCanary, it is with the intent
of availing yourself of its mostly-automatic detection of leaked activities.
The recipe for doing that involves calling install() on the LeakCanary
class when your process starts, such as in onCreate() of a custom
Application subclass.
The sample app has such a class, CanaryApplication:
package com.commonsware.android.async;

import android.app.Application;
import com.squareup.leakcanary.LeakCanary;

public class CanaryApplication extends Application {
  @Override
  public void onCreate() {
    super.onCreate();

    LeakCanary.install(this);
  }
}
This Application subclass is registered in the manifest, via android:name
on the <application> element:
  <application
    android:name=".CanaryApplication"
    android:icon="@drawable/ic_launcher"
    android:label="@string/app_name"
    android:theme="@android:style/Theme.Holo.Light.DarkActionBar">
    <activity
      android:name=".AsyncDemo"
      android:label="@string/app_name">
      <intent-filter>
        <action android:name="android.intent.action.MAIN"/>

        <category android:name="android.intent.category.LAUNCHER"/>
      </intent-filter>
    </activity>
  </application>
And that is all that you need, for basic integration.
LeakCanary.install() returns a RefWatcher object. If all you want to
do is use the semi-automatic activity leak detection, you can safely ignore
this return value.
However, if you would like to watch for other objects leaking — fragments,
domain model objects, threads, etc. — you can hang onto that RefWatcher
and, where needed, call watch() on it to add an object to watch for
leaks. Watching for leaks is not terribly expensive but not free, so be
judicious in what you are watching.
Once you have LeakCanary integrated, you can try out your app and see if it leaks.
Note that the quasi-automatic activity leak detection is based upon the activity lifecycle. LeakCanary considers an activity to be leaked if it is destroyed and there are still unknown strong references to it. This assume that your activity is destroyed in an ordinary fashion. Hence, how you use your app influences what leaks you find. For example, if you terminate the app process (e.g., swipe away the associated task in the overview screen), you will not find out if any live activities were leaked. Where possible, try to use the BACK button to step your way out of the app when testing, to ensure everything gets destroyed and the most leaks can be found.
You will not have a problem determining when a leak is suspected, as a
very large Toast-style window appears advertising the fact:
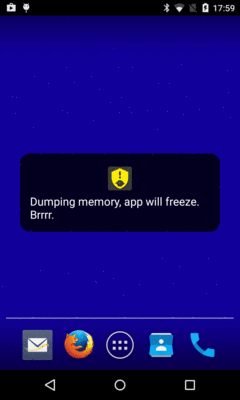
Figure 1024: LeakCanary Heap Dump Window
This is another reason not to watch too many objects, as if you get too many false positives, your productivity will suffer, waiting for all the heap dumps.
Note that it may take a few moments after the activity is destroyed before the message appears, and that it may take a long time after the message disappears before you get final results.
Whether the leak is “for realz” or a false positive, you will get a report in LogCat:
12-21 08:23:31.279 7192-8049/com.commonsware.android.async D/LeakCanary: In com.commonsware.android.async:1.0:1.
12-21 08:23:31.279 7192-8049/com.commonsware.android.async D/LeakCanary: * LEAK CAN BE IGNORED.
12-21 08:23:31.279 7192-8049/com.commonsware.android.async D/LeakCanary: * com.commonsware.android.async.AsyncDemo has leaked:
12-21 08:23:31.279 7192-8049/com.commonsware.android.async D/LeakCanary: * GC ROOT android.view.inputmethod.InputMethodManager$ControlledInputConnectionWrapper.mParentInputMethodManager
12-21 08:23:31.279 7192-8049/com.commonsware.android.async D/LeakCanary: * references android.view.inputmethod.InputMethodManager.mNextServedView
12-21 08:23:31.279 7192-8049/com.commonsware.android.async D/LeakCanary: * references android.widget.ListView.mAdapter
12-21 08:23:31.279 7192-8049/com.commonsware.android.async D/LeakCanary: * references android.widget.ArrayAdapter.mContext
12-21 08:23:31.279 7192-8049/com.commonsware.android.async D/LeakCanary: * leaks com.commonsware.android.async.AsyncDemo instance
12-21 08:23:31.279 7192-8049/com.commonsware.android.async D/LeakCanary: * Reference Key: bd3d11b6-2e49-460e-97f9-7b04de398a82
12-21 08:23:31.279 7192-8049/com.commonsware.android.async D/LeakCanary: * Device: LGE google Nexus 4 occam
12-21 08:23:31.279 7192-8049/com.commonsware.android.async D/LeakCanary: * Android Version: 5.1.1 API: 22 LeakCanary: 1.3.1
12-21 08:23:31.279 7192-8049/com.commonsware.android.async D/LeakCanary: * Durations: watch=5174ms, gc=203ms, heap dump=4795ms, analysis=20814ms
12-21 08:23:31.280 7192-8049/com.commonsware.android.async D/LeakCanary: * Details:
12-21 08:23:31.280 7192-8049/com.commonsware.android.async D/LeakCanary: * Instance of android.view.inputmethod.InputMethodManager$ControlledInputConnectionWrapper
12-21 08:23:31.280 7192-8049/com.commonsware.android.async D/LeakCanary: |   mActive = true
12-21 08:23:31.280 7192-8049/com.commonsware.android.async D/LeakCanary: |   mParentInputMethodManager = android.view.inputmethod.InputMethodManager [id=0x12c289a0]
12-21 08:23:31.280 7192-8049/com.commonsware.android.async D/LeakCanary: |   mH = com.android.internal.view.IInputConnectionWrapper$MyHandler [id=0x12cff5e0]
12-21 08:23:31.280 7192-8049/com.commonsware.android.async D/LeakCanary: |   mInputConnection = java.lang.ref.WeakReference [id=0x12cff5c0]
12-21 08:23:31.280 7192-8049/com.commonsware.android.async D/LeakCanary: |   mMainLooper = android.os.Looper [id=0x12c63de0]
12-21 08:23:31.280 7192-8049/com.commonsware.android.async D/LeakCanary: |   mDescriptor = java.lang.String [id=0x70f94d78]
12-21 08:23:31.280 7192-8049/com.commonsware.android.async D/LeakCanary: |   mObject = -1201196048
12-21 08:23:31.280 7192-8049/com.commonsware.android.async D/LeakCanary: |   mOwner = android.view.inputmethod.InputMethodManager$ControlledInputConnectionWrapper [id=0x12cfe490]
12-21 08:23:31.280 7192-8049/com.commonsware.android.async D/LeakCanary: * Instance of android.view.inputmethod.InputMethodManager
12-21 08:23:31.280 7192-8049/com.commonsware.android.async D/LeakCanary: |   static $staticOverhead = byte[] [id=0x717d01b1;length=240;size=256]
12-21 08:23:31.280 7192-8049/com.commonsware.android.async D/LeakCanary: |   static CONTROL_START_INITIAL = 256
12-21 08:23:31.280 7192-8049/com.commonsware.android.async D/LeakCanary: |   static CONTROL_WINDOW_FIRST = 4
12-21 08:23:31.280 7192-8049/com.commonsware.android.async D/LeakCanary: |   static CONTROL_WINDOW_IS_TEXT_EDITOR = 2
12-21 08:23:31.280 7192-8049/com.commonsware.android.async D/LeakCanary: |   static CONTROL_WINDOW_VIEW_HAS_FOCUS = 1
.
.
.
(the dump of static and instance fields of InputMethodManager goes on
for a really long time)
The fact that this just shows up in LogCat (and not via a Notification)
and that the LogCat dump has “LEAK CAN BE IGNORED” means that this leak
is a known Android issue and is not indicative of a leak in your app.
The
Leaks/StaticWidgetLC
sample project is a clone of the static widget leak scenario from
earlier in this chapter. This version has LeakCanary integrated in, though,
and LeakCanary catches this leak.
So, after the “Brrr…” window vanishes and you wait several moments
for the heap analysis to finish, you will eventually get a Notification
from LeakCanary. Tapping that shows a “timeline”-style list of objects,
starting with a GC root and ending in the leaked object:
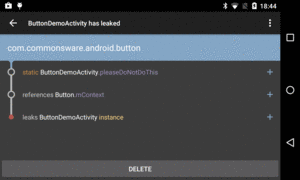
Figure 1025: LeakCanary Diagnostic Activity, As Launched From the Notification
Here, we see that pleaseDoNotDoThis holds a reference to the Button,
which holds a reference to the Activity.
This has two advantages over using Android Studio’s own leak analysis:
The “+” icons on the right edge of the rows simply toggle whether the full package name is included in class names:
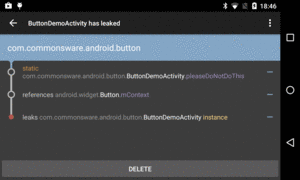
Figure 1026: LeakCanary Diagnostic Activity, Showing Full Package Names
The overflow menu has an option to “Share info”, which sends the same
information as appears in LogCat to your favorite ACTION_SEND
implementation (e.g., an email client). “Share heap dump”, also in the
overflow, forwards the heap dump itself via ACTION_SEND, for you to
perhaps get over to Android Studio for deeper analysis if that proves
necessary.
Pressing the up navigation arrow in the action bar brings up a list of the saved leak reports:
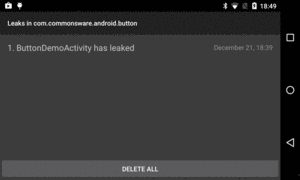
Figure 1027: LeakCanary Report Roster
The “DELETE” button on the diagnostic activity deletes that report;
the “DELETE ALL” button on the roster activity deletes all saved
reports. By default, LeakCanary saves seven reports and heap dumps, though
you can configure this by overriding the __leak_canary_max_stored_leaks
integer resource with some other value.
The LeakCanary project documentation outlines many other possibilities for tailoring LeakCanary’s behavior, including: