Readers who have digested the book to this point will be well aware that anechoic measurements can reveal most of what we need to know about the potential sound quality of loudspeakers as they are heard in normal rooms. The exception is bass performance, where there is no substitute for in-situ measurements and corrective actions. Enough anechoic measurements can allow us to predict steady-state room curves above a few hundred hertz, and, more importantly, to anticipate subjective ratings in double-blind listening tests. This did not happen by accident.
I did not intend for this to be my life’s work. Hi-fi was my hobby, but my research interest was sound localization; in particular, the manner in which sounds at the two ears are processed by the brain to yield perceptions of direction (Sayers and Toole, 1964; Toole and Sayers, 1965a, 1965b). All of the university experiments had been done with headphones, which allowed independent control of the signals to each ear.
A thrilling prospect of the job as a research scientist at the National Research Council of Canada (NRCC) was that there was an excellent anechoic chamber, within which the experiments could be extended to include natural listening, starting in a reflection-free environment, and then moving on to more complex circumstances. For this, loudspeakers were needed. When anechoic measurements were made on some highly rated audiophile loudspeakers of the time, the results were disturbing. The frequency responses were far from flat, and these were simple on-axis anechoic measurements made for the purpose of performing anechoic listening tests. Moreover, supposedly comparably good loudspeakers were very different from each other. Up to this point, the author had only seen “specifications” for frequency response and, if it were not for the unimpeachable pedigree of the measurement circumstances, it would have been possible to think that there had been a tragic error in making the measurements. Suddenly, claims that the loudspeaker was the “weakest link” in the audio chain rang true. But could these products really sound as bad as some of the curves looked?
A logical “Friday afternoon” experiment was to do a simple comparison listening test in one of the laboratory rooms. Having learned the basics of experimental psychology for the doctoral thesis work, it was obvious that this test had to be somewhat controlled. So, cotton sheeting was hung up to render the experiment “blind.” The loudspeakers were compared in monophonic A/B/C/D comparisons, and were adjusted to be equally loud. There was no statistical imperative for listening in groups of four loudspeakers; it just seemed convenient. Interestingly, three- or four-way multiple comparisons have remained the norm in our subjective evaluations ever since. A supportive technician built a simple relay switch box. After that, I and a few interested colleagues took turns listening, forming opinions and making notes. A “Gestalt” impression, a summarized overall rating, was required: a number on a scale of 10.
The results surprised all of us. The audible differences were absolutely enormous, but there was general agreement about which ones seemed to sound good. It remained a topic of discussion for days. Where was the much-touted individuality of opinion?
The need for loudspeakers for my anechoic sound localization experiments remained, and the winner of this simple test, a KEF Concord, showed promise. It was dismantled; I found the cause of the misbehavior (flexure along the vertical axis of the B139 woofer). A phase plug eliminated the cancellation and a new crossover resulted in a much-improved loudspeaker—my first loudspeaker “design.” The sound localization experiments proceeded.
Months passed before another listening test was staged in February 1966. By then I had learned that bed sheeting is not acoustically transparent and that music passages needed to be short and repeated. This meant that we needed a “disc jockey” to perform the tedious task; it was the LP era. Our agreeable technician did it. Word had spread and audio enthusiasts from within the organization lined up to participate, and in some cases bringing their personal loudspeakers to be evaluated. This test went on for days, and yielded enough subjective data to warrant rudimentary statistical analysis.
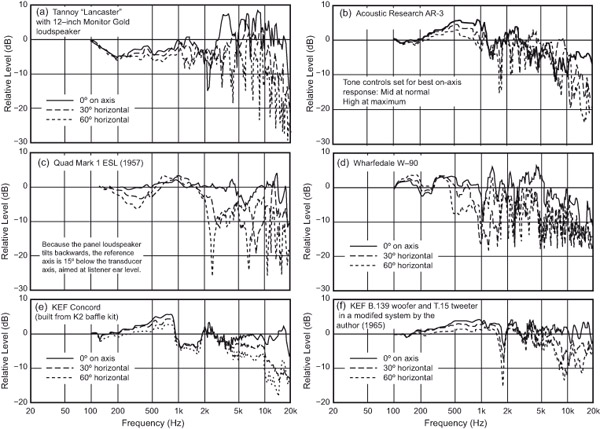
Again, there was good agreement about the products that were preferred and those that were not. The winning loudspeaker was the redesigned unit that was being used in my anechoic chamber tests. It also had the best looking set of measured data, assuming one puts any value in smooth and flat frequency responses on and off axis, Figure 18.1f. I still have the original hand written response sheets from these tests done 50 years ago.
The original Quad ESL Figure 18.1c may have set a standard for on-axis behavior, but the large radiating panels degraded off-axis performance, causing in-room performance to be compromised. The theoretically attractive “dual-concentric” Tannoy (a) radiated excruciatingly bright and colored high frequencies along with very boomy bass. The multi-driver large box Wharfedale (d) exhibited poor bass extension, numerous resonances and uncontrolled acoustical interference. It was very colored and lacked high frequencies. The original KEF (e) is what I purchased for my post-graduation hi-fi system, based on listening in tiny rooms at the 1964 audio show in the Hotel Russell in London. To my then uneducated ears, it simply sounded good. Raymond Cooke of KEF gave me a discounted price because it would be for “research.” I lied then, but it turned out to be true. I picked them up at the factory in Maidstone, Kent.
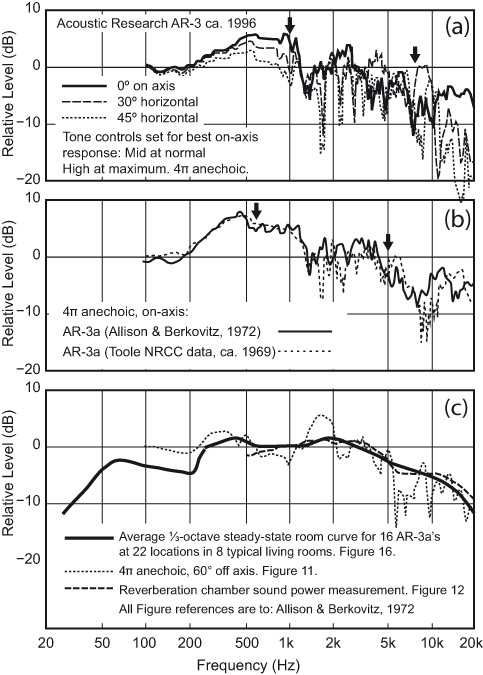
The Acoustic Research AR-3, which was already in the lab when I arrived at the NRCC, was highly regarded at the time. It embodied Edgar Villchur’s innovative acoustic suspension woofer, offering deeper bass in a small enclosure than had previously been possible. It also had dome midrange and tweeter units with uncommonly good dispersion. AR had upgraded the AR-3 to the AR-3a, and when I enquired about an upgrade, I was invited to visit. The loudspeakers and I arrived in Cambridge, Massachusetts, and while I was being toured around the engineering area and factory, they were converted to the 3a version and tested.
Roy Allison was a gracious host and provided insight into what was behind the design and their measurement philosophies. The high-frequency rolloff was explained as being a necessary compromise between a tweeter that had the desirable characteristics of smoothness, bandwidth and dispersion, and one that sacrificed some or all in order to gain output. AR decided to let the high frequencies roll off. But then, it was explained that doing so brought them closer to their design goal: “To produce the same spectral balance at the ears of listeners in both concert halls and living rooms” (Allison and Berkovitz, 1972). The paper shows curves for a few halls, and the high frequencies roll off by different amounts. Noting the variability of this and also of the bass responses of the halls, the authors said in closing, “we think that home listeners should be encouraged to make more liberal use of amplifier tone controls.” Forty-five years later, it is still good advice.
That said, the idea of rolling off the highs in the loudspeaker because mike placement can exaggerate the high frequencies in classical music seems odd. It is the role of the recording and mastering engineers to make whatever music is being recorded sound correctly balanced through the monitor loudspeakers. These almost certainly did not roll off the high frequencies. This is where equalization, if any, needs to be applied, not permanently in the customers’ loudspeakers. However, because the recording industry lacked any standards for monitoring (and still does), that may have been a motivating factor. In the case of the AR-3a, the intended optimization only considered symphonic music, and then only for recordings that they argue would otherwise be unpleasantly bright. What about the ones that aren’t bright, and what about the rest of the musical repertoire?
In any event the rolloff persisted in the 3a version, in which the crossover frequencies were lowered, moving the 1 kHz coloration down to about 400 Hz. Figure 18.2 shows a compilation of their measurements and mine. Given the possible sources of error, including production variations, the agreement is good.
According to listeners in my early blind listening tests, the significantly non-flat frequency response was a liability, with comments referring to mid-frequency coloration and high-frequency dullness. The program selections came from commercial LPs: Mozart’s Jupiter (symphony), Chopin’s waltzes (piano), Handel’s Messiah (choral), a military band march, and Billy Strange playing acoustic guitar.
Some fans point to the AR “live vs. reproduced” demonstrations as absolute proof of reproduction accuracy. However, as explained in Section 1.8, such demonstrations employ recordings made especially for those events, reproduced through specific loudspeakers in concert venues. Such demonstrations have every reason to succeed and apparently all of them, from different companies, did. There is really no excuse for failure so long as the loudspeakers are not corrupted by gross distortion or resonances. What matters in the consumer world is different: How do commercial recordings sound in homes?
The room curve data in Figure 18.2c is especially interesting. From what is now known, at the listening position in normal rooms, the mid- to high frequencies consist substantially of early reflections and direct sound (Section 5.6). In this case, the directivity of the loudspeaker is very uniform, at least above 1 kHz, so the on-axis, off-axis and sound power curves will have similar shapes. Fortunately Allison and Berkovitz published enough data to permit retrospective analysis. Figure 18.2c shows the average of many in-room measurements, with the anechoic 60° off-axis curve and the measured sound power superimposed. As anticipated, there is substantial agreement. The single 60° curve represents one possible early reflection. As shown in Section 5.6 the sum of early reflections in a normal room provide a good estimate of the steady-state room curve. The spinorama measurement method averages several such curves and such a spatially averaged curve would have been much smoother—not unlike the sound power curve. Allison (1974, 1975) correctly explained that the dip in the upper bass, around 100–200 Hz, was the result of adjacent boundary interactions; see Figure 9.4 and accompanying discussion. The acoustical interference roughness, the “grass,” in the curves was the result of reflected and diffracted sound from the protruding grille-frame. Measurements of the raw transducers on plain baffles were much smoother. Acoustic Research deserves credit for being pioneers in attempting to relate in-room measurements to measurements pertaining only to the loudspeaker and having the candor to publish honest and accurate data.
My next encounter with this loudspeaker came a few years later in England, when AR was under new ownership and Tim Holl was planning a new engineering lab. One of his first projects was to create an AR-3a Improved. It was to have a high-frequency driver capable of delivering a flatter overall response; by then the high-frequency rolloff was regarded as a problem. Apparently neither it nor the lab was achieved.
It needs to be emphasized that I am not documenting the history of loudspeakers. In those years I was, and still am, a research scientist seeking answers to significant questions relating what we measure to what we hear. I had the opportunity to evaluate numerous loudspeakers, brought to the NRCC laboratory by audio enthusiasts, retailers and loudspeaker manufacturers. But by far the majority were submitted for evaluation by Canadian audio magazines: AudioScene Canada, Sound Canada and Sound and Vision Canada. They published reviews displaying anechoic measurements and subjective comments resulting from double-blind listening tests. I had no role in selecting the loudspeakers. Those were exceptionally informative reviews, but sadly the market could not support the activity.
There were interesting loudspeakers that simply did not come my way, and I had no budget to purchase them. Some readers of my first book thought I was being prejudiced for not having commented on certain brands or models. Even with the expanded collection of loudspeakers that follows, several noteworthy products are missing. From my perspective, though, the population of loudspeakers I was able to evaluate embraced enough of the “junk to jewels” sound quality range for patterns in the measurements that represented excellence to be recognized. I got what I needed, and the results are published in the public domain for all to see.
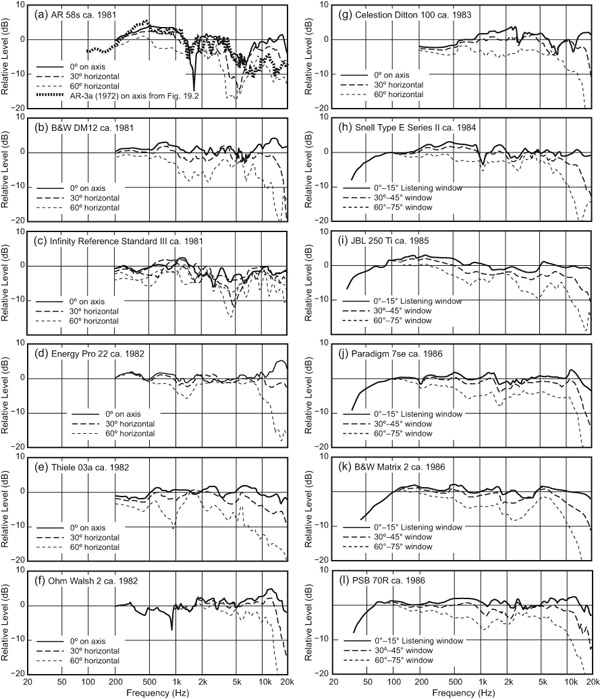
Figures 18.3 and 18.4 show some of the many loudspeakers that appeared in the years between my first tests and those published in Toole (1986). Measurements made after 1983 used a computer-controlled measurement system, and the anechoic chamber was calibrated so low frequency performance could be seen. Samples of the 1986 data are shown in Figure 5.2.
Several of these products performed well in double-blind listening tests at the time, but a few probably obvious ones had problems. Some were popularly priced and sold in large numbers. Others are products that showed evidence of serious engineering insight and effort. They came from the US, UK, Canada and Japan to indicate that nobody had a monopoly on making decent sounding loudspeakers—nor bad sounding ones either. I have not used valuable space to show poorly designed loudspeakers. They incorporate almost every conceivable flaw and a few display respected brand names. Price was an unreliable guide (see Figure 3.19). In the end, only data on specific models can be trusted. A good or bad result in one model conveys no dependable information about a brand so generalization is unreliable. Often, influential individuals insist on “voicing” the product, or marketing has seen what sold last year, and what is imagined to be the “sound of the season” gets delivered. In the early days, though, no loudspeakers were truly neutral; they all had distinctive sounds, and it became part of audio lore that one had to search for a loudspeaker that matched one’s personal taste.
What is rarely understood is that the sound of a loudspeaker is primarily determined by its direct sound frequency response (on-axis and listening window) and its directivity (off-axis performance or DI) as a function of frequency. The former can be altered by equalization. The latter is built into the loudspeaker; equalization cannot change it. So, if one purchases loudspeakers having well behaved directivity (constant or smoothly and gradually changing over the mid- and high frequencies) then an equalizer or tone control can be freely used to create whatever sound is desired.
Equalizers can be changed at will to follow moods or variations in recordings. Most importantly they can be turned off. A compromised loudspeaker or one compromised by inappropriate equalization is a permanent timbral distortion for all reproduced sounds. This is understandable in consumer audio, but inexcusable in professional audio.
The problem has two components:
Looking over the collections of curves, the one feature that stands out is that almost every designer set out to make a loudspeaker with a basically flat on-axis frequency response. Some succeeded better than others, but the underlying trend is there. They also differ in off-axis performance, and sometimes it was this, the spectrally uneven reflected sound, that differentiated how they sounded in a room.
In the very first evaluations shown in Figure 18.1, it was found that a loudspeaker exhibiting smooth and flat on- and off-axis performance consistently generated high subjective ratings. Looking at the data in Figures 18.1, 18.3 and 18.4, one can see that there was much progress toward this goal over the years. Figures 12.1 and 13.1 show that the progress in loudspeaker design and technology has continued, and the same pattern of subjective preference prevails. But, regrettably, everything in the marketplace is not better.
In Figure 18.3a a classic large horn loudspeaker exhibits evidence of acoustical interference and high directivity, both typical of the genre, but the underlying spectral balance was well maintained on and off axis. Very high sensitivity was a benefit at a time when amplifier power was limited. Loudspeaker (b), the Henry Kloss designed KLH 17 and (c), the Danish designed Dynaco A-25 were popular and affordable small loudspeakers of the period. Kloss also contributed the respected Advent (d), which, in a larger version, was often used in pairs—the “stacked Advents.”
The Yamaha NS-1000M (e) was a serious effort, with beryllium dome midrange and tweeter units, mounted to minimize diffraction, to maximize and maintain constant directivity, and with obvious care in crossover design. They exhibited the lowest non-linear distortion of any consumer loudspeaker I had tested up to that point. The designer (also of the very different sounding NS10M) visited me at the NRCC, modestly explaining that it was simply “good engineering.” It sounded good, but some listeners thought they could hear a “metallic” quality. In blind tests that problem went away. The curves show no evidence of resonances, metallic or otherwise, which was the point of using beryllium. The susceptibility of humans to biasing influences was and remains a major problem. A spectral balance that slightly favored the mid- and high-frequencies was audible, albeit easily correctable with some low frequency boost. It seems that the performance objective was a flat sound power curve for both the NS1000M and the NS10M, but that target was a better match for the almost constant directivity NS1000M than it was for the conventional small two-way NS10M, as illustrated in Figure 12.9. It was the wrong target, but an example of excellent engineering.
The BBC contributed several loudspeaker designs over the years, and the Chartwell licensed version of the LS3/5A was the “outside broadcast monitor” intended for use in small dead spaces. It was a small two-way, using KEF drivers, much like the midrange/tweeter combination in floor-standing loudspeakers. It sounded good at moderate sound levels, and acquired an enthusiastic following.
Figure 18.3h, the AR-9, was another serious effort, showing evidence of attention to both spectral balance and uniformity of directivity. Developed by Tim Holl, it embodied some control of room boundary interactions as advocated by Allison (see also Figure 9.12). This was another loudspeaker that anticipated the future: flat spectrum, constant directivity. It got high listener ratings.
The other loudspeakers in Figure 18.3, g, i, j, k and l, all show that the designers aimed at flattish on-axis frequency responses. Some came closer than others, but all lost control in achieving uniformity in off-axis radiation. In normally reflective rooms, these spectrally unbalanced reflected sounds affect the experience. Double-blind subjective ratings for the PSB Passif II (l) are in Figure 3.8 along with the AR-58s (Figure 18.4a) and the Quad ESL 63 (measurements in Figure 7.12).
Figure 18.4 continues the story, beginning with the AR 58s, which is dramatically different from the neutral spectral balance of the AR-9. Was it deliberately so? It was reminiscent of the AR-3a shown in Figure 19.2, so I superimposed the on-axis curve from that figure. Could it be that somebody wanted to revisit the sound of the legendary 3a in a new product? If so, it seems that the once desired AR-3a “improved” was achieved, because the tweeter now had more output.
The DM12 had good on-axis response, but exhibited the classic 6-inch (150 mm) two-way off axis misbehavior. The Infinity (c) had good directional control, but a mid-frequency hump determined the tonal balance of the product. The Energy (d) was uncommonly good in all respects: flat, smooth, almost constant directivity—it consistently scored well in listening tests. Others, as can easily be seen, were variations on a common theme.
The Ohm Walsh 2 shown in (f ) is an interesting design, being horizontally omnidirectional up to a crossover to a conventional tweeter. It was a simplification of the original single broadband driver invented by Lincoln Walsh, which worked but was impractical. It had a relatively spacious presentation, and because the reflected sounds had the same spectrum as the direct sound, the room was less obvious than might be thought. This was one of the experiences leading me to recognize that humans have an ability to “listen through” rooms, to separate the sound of the source from the sound of the room. This ability seems to be degraded when the direct and reflected sounds have different timbral signatures.
Notably absent from the displayed products are those from Bose. All of the tested products, especially the distinctive direct-reflecting 901, radiated sound in several directions, from multiple drivers, some or most of which are aimed away from the listener. In the 901 eight drivers addressed the wall in front of the listener, and one was aimed at the listener. To reveal useful performance data on such loudspeakers requires the digital measurement system that can perform spatial averaging and sound power calculation; it did not exist at the time I was doing these tests. Measurements on single axes show acoustical interference that is disturbing to the eye but not necessarily evident to listeners in normally reflective rooms. So, rather than show misleading data, I show none. The same applies to the image-stabilizing dbx Soundfield loudspeaker discussed in Section 15.3.1. These designs added interest to the panorama of products in the marketplace, appealing to some, not to others. The bipolar but essentially omnidirectional Mirage M1 that ended up in one of my listening rooms (Section 7.4.6) is another in this class of products. Measurements are in Figure 7.20.
All multidirectional loudspeakers energize the reflected sound field in rooms, and all of these did. For some kinds of program and for some listeners, that is a positive attribute. The topic of early reflections is discussed in considerable detail in Chapter 7, and it is clear that there is not a single solution so having alternatives is good.
Reviewing the collection shows convincing reasons why loudspeakers sound different from one another—they are different from one another—but it is unlikely that the differences were always deliberate. Nevertheless, it can be seen that as the years passed they became increasingly similar. Today, loudspeakers can be even more similar than these (see Figures 12.1 and 13.1) and products with very similar measurements are sometimes difficult to distinguish in double-blind tests. Often it comes down to a decision between sounds that are slightly different, but comparably good. In those cases the variations in program material become the deciding factor, favoring one or the other at different times, and the end result is a statistical tie. There is a point of diminishing returns. The most perfect loudspeaker will not always sound perfect because recordings are not consistent. And, as mentioned several times throughout the book, humans are remarkably adaptable. We “break in” to accept many innocuous spectral aberrations, so long as gross resonances or non-linear distortion are not involved.
Given that bass is responsible for about 30% of one’s overall assessment of sound quality, and that is primarily determined by the specific room and arrangement within the room (Chapters 8 and 9), it is clear that chance plays a large role in listening experiences. In controlled double-blind tests in which room effects have been rendered constant, it is possible to arrive at reproducible subjective evaluations that have a correlation with measurements such as these, and even better, with the spinorama style of data presentation. But this is a luxury that customers and reviewers do not have.
Some audio professionals believe that monitor loudspeakers are designed to a higher performance standard than consumer products. I have heard it said that one can hear more things in a professional monitor than one can in a (lowly) consumer loudspeaker. If the criteria for excellence include the ability to play very loud for long periods without stress or failure, they are possibly right. If the criteria include bandwidth, timbral accuracy and an ability to revel the subtleties of a recording there is reason to reconsider.
If one focuses on conventional consumer loudspeakers from respected brands that aspire to a semblance of “fidelity,” as was done in Figures 18.3 and 18.4, it is difficult not to be impressed by the overall uniformity of the performances and of the excellence of a few of the more recent ones. These products were mainly in the popular-price range because they were selected for readers of consumer audio magazines. Many consumers were listening to good sound. Today even more listeners are, including some bass and loudness limited small Bluetooth loudspeakers that sound better than they ought to.
Loudspeakers (e), (f ) and ( j) in Figure 18.3 are “crossover” products, having appeal to both consumer and professional users. My circumstances did not bring many large professional monitor loudspeakers my way, but over the years a few interesting examples were tested. Figure 18.5 shows 10 of them. It would be difficult to declare victory for the professional audio camp based on these data, although the 1987 product ( j) did very well. The most serious concern is that these were, and—incredibly—some still are, the “windows” through which recording engineers and artists “view” their creations. Some recording engineers developed serious love affairs with certain of these products—another example of the power of human adaptation.
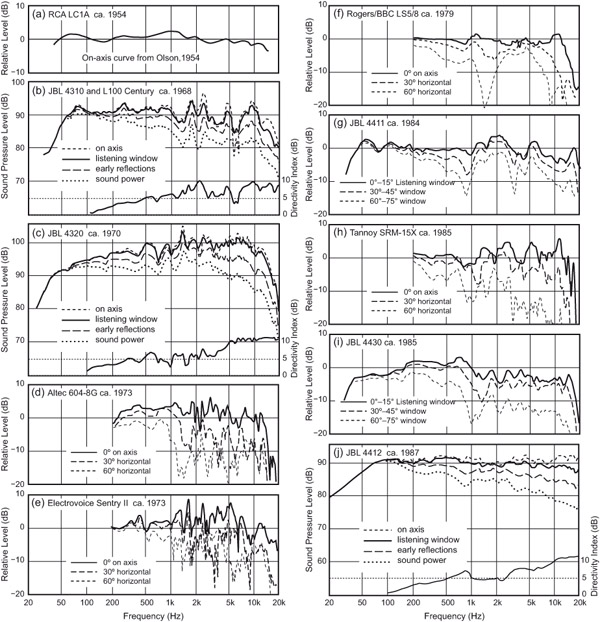
Harry Olson (1954, 1957) was a pioneer in sound reproduction, concluding in those early years that loudspeaker frequency response and directivity were the variables of greatest importance. However, measurement capabilities were limited, and Figure 18.4a shows an obviously artistically smoothed on-axis frequency response of the RCA LC1A, a 15-inch (380 mm) dual-cone loudspeaker in a low-diffraction enclosure. Directivity curves of both transducers are shown in the 1954 paper. Conical shapes on the woofer diaphragm broke up the regular interference effects that would have occurred from the central high-frequency driver. That driver was fitted with deflectors to broaden the dispersion above 10 kHz. The smoothing and the missing off-axis curves undoubtedly hide some sins, but it is evident that the designers had some of the right goals in mind.
Looking through the other loudspeakers over the 19 years from 1968 to 1987, there is a great deal of variation. The JBL 4310/L100 had a collection of strong resonances that were audible, but seemingly ignored or admired by many. The 4320, with its acoustic lens, was surprisingly well behaved, needing only an equalization tilt to make it competitive. To these should be added the Auratone (1960s onward) and the UREI 811B that appeared around 1979, shown in Figure 12.9. The UREI was based on the Altec 604(d), with a modified horn and crossover. These loudspeakers had strong “personalities,” and when inserted into double-blind comparison listening tests a couple of them were awarded the lowest subjective ratings ever noted.
Several can be seen to degrade very quickly as one moves away from the frontal axis. Such loudspeakers can only sound good in non-reflective rooms. Attempts at equalization using steady-state room curves cannot reliably succeed because of the frequency-dependent directivity exhibited by some of them. This, I suspect, had something to do with the tendency for many control rooms to be acoustically treated using what I call the “truckload of fiberglass” approach. Eliminate everything except the direct sound and equalize that. Directivity problems cannot be corrected by equalization. However, given the complexity of the problems in the direct sound from some of these loudspeakers it is evident that complete satisfaction would have been elusive.
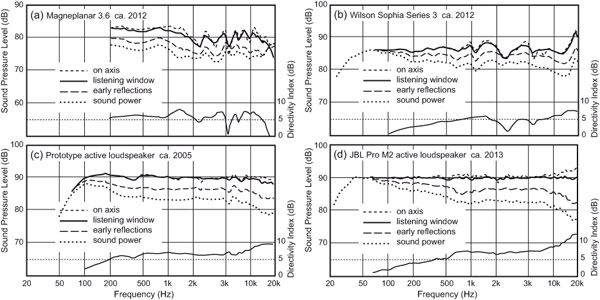
The JBL 4412 (1987) breaks the pattern, exhibiting the spectral and directional control of what I have called modern monitors in Section 12.5.2. Figures 5.12 and 18.7(d) show the JBL Pro M2, an example of a modern mid-field or main monitor that is inherently well behaved and is then, based on anechoic data, equalized in a dedicated digital processor/power amplifier package.
These and others now in the marketplace provide relatively neutral timbral quality that allows mixers to estimate what customers might hear. Section 12.5.2 has more discussion on this topic. The conclusion: if it is necessary to boost or cut specific frequency ranges to gain insight into a mix, do it with an equalizer, not a different loudspeaker. The physical and acoustical clutter in the control room can be reduced.
For me, those were years of gaining experience and learning. Part of this was a brief career as a moonlighting studio designer—applying the knowledge I thought I had in the real world. I designed three complete studio complexes, one of which had a studio large enough to hold a 75-piece chamber orchestra, and contributed to others. The data shown in previous figures indicate that the professional monitors of that period, the mid-1970s, left something to be desired. The ones I had access to routinely did poorly in double-blind listening evaluations, although they almost always could play louder than the consumer products.
It bothered me when one of my clients wanted to install Altec 604–8Gs (Figure 18.5d), because that was what his lead engineer and some of his customers liked. I took the challenge of designing something better. In my opinion the same principles that guide the design of the best sounding consumer loudspeakers could be applied to large monitors. I borrowed a large selection of driver samples, tested them and selected what I thought were the best performers. It ended up being a four-way tri-amplified system with a 15-inch JBL 2215 woofer with a 2290 passive radiator (no port misbehavior), a JBL 2120 8-inch midbass, a JBL 2397 “Smith” horn driven by a 2440 compression driver, and an ElectroVoice ST-350A high-frequency horn. All were selected on the basis of smooth frequency responses and uniformly wide dispersion. The Smith horn was significantly less colored than most of the conventional horns of the time, and had uniformly wide dispersion. The result is shown in Figure 18.6; it was May 1978.
Fortunately, in addition to swept-tone anechoic measurements I did some 1/3-octave curves. These, I have been able to combine by calculation into approximations of the spinorama listening window and early-reflections curves. As discussed in Section 5.6 steady-state room curves are often well estimated by the early-reflections curve.
Figure 18.6a shows a relatively smooth and flat direct sound loudspeaker with relatively constant directivity (no EQ). (b) shows pure-tone sweeps (no spectral smoothing) at six locations in one of the control room installations. The variations above about 1 kHz are relatively small and follow the shape of the curves in (a). The room was quite dead, RT around 0.2 to 0.25 s, and the early reflection surfaces were highly absorbing, so the evidence of accumulating reflected energy is mostly from the floor, the console surface, and other control room apparatus.
Figure 18.6b shows that the early-reflections estimate is a good match for the unsmoothed room curves. Also shown for interest is the idealized steady-state room curve from Figure 12.4d showing what can be expected from a state-of-the art, flat on-axis loudspeaker in a normally reflective room. If I had known then what I know now, I would have equalized the loudspeaker based on anechoic data, which would have delivered the idealized room curve almost exactly—except of course for the bass room-mode region.
After simple equalization to smooth the large undulations in the room curves, it sounded good enough for the senior recording engineer and the customers to give an enthusiastic go-ahead. In spite of the significant cost and complexity, six such systems were built into different projects. The results look much the same.
Lacking any entrepreneurial instincts, I never saw it as a product, only a proof of concept. It was just one more confirmation of trends that have continued since. Starting with a truly good loudspeaker, getting good sound is not difficult, except in the low-bass room-mode region.
Soon after this I published a deliberately provocative article (Toole, 1979) in which I challenged the professionals to move to the standard of sound quality being enjoyed by an increasing percentage of consumers; it was called “Hi Fidelity in the Control Room—Why Not?” I sensed that it went over like the proverbial lead balloon. I was rocking the boat.
This loudspeaker was just a basically neutral loudspeaker that differed from its hi-fi brethren in that it could play dangerously loud. Proof that I was right is that several present-day monitors make it possible to have the highest of fidelity in control rooms, if that is the choice.
A significant event in my career occurred when I conducted a massive monitor loudspeaker evaluation in collaboration with the Canadian Broadcasting Corporation (CBC) (Toole, 1985, 1986). The goal was to identify suitable large, medium and small monitor loudspeakers for use throughout the nationwide network. From the samples submitted by manufacturers and distributors 16 were selected as finalists. These were measured, and then subjectively evaluated by 27 listeners, 15 of whom were professional recording engineers and producers from the CBC. The others were colleagues and interested audiophiles well practiced in the double-blind listening procedure, which was an ongoing operation in my research. Subjective evaluations went on for two weeks. In the end the customer was satisfied that the results were conclusive. There was no major disagreement among the listeners about which were the most preferred products, which included loudspeakers from Figures 18.3, 18.4 and 18.5. The most memorable comment I heard was that some of the audio professionals thought that, during the tests, they had never heard such good sound in their lives. It turned out that most of the monitor loudspeakers with which the engineers were experienced did poorly in the tests, which, when the results were revealed, initiated a minor revolt. After some repeated tests using the engineers’ own tapes, they were persuaded. It was a learning exercise for us all. The highest rated loudspeakers included both domestic and professional products.
As discussed in Section 3.2 and Toole (1985) it was this evaluation that yielded definitive evidence that hearing loss affects one’s ability to form consistent opinions about sound quality, and introduces bias. Sadly it is an occupational hazard in the audio business (Chapter 17).
Loudspeaker design is now a mature technology. The trial-and-error, golden-ear phase is, or should be, long gone. Specialist manufacturers produce superb transducers, off the shelf or to order, and measurement and computer design aids provide enough trustworthy guidance to reliably yield neutral sounding loudspeaker systems. It requires skill and the desire to produce such loudspeakers. For some that is a problem. There is still a residue of the past, in which the sound of the loudspeaker is part of the magic, part of the art, even an emotional attachment to something real or imagined.
If we were perfectly successful in delivering uniform sound, neutral sound, from all loudspeakers professional and consumer, the art would be more likely to be communicated as it was created. This is good for the art, but from a loudspeaker marketing perspective this is a backwards step, because the “sound” of the loudspeaker has been a differentiating factor. People expect loudspeakers to sound different.
In spite of the folklore, electronics that are not misbehaving or driven beyond their limits are essentially transparent. Nobody builds electronics for an audio signal path that does not have a ruler flat frequency response over more than the audible bandwidth. They are becoming “invisible” parts of our systems, and if the future should include merging electronics with transducers in active loudspeakers that portion of audio tradition will fade. The result will be better sound, but something will have been lost.
To tour a state-of-the-art loudspeaker design lab is to see transducer and system measurement apparatus that did not exist until recent years. Computer-based simulation capabilities allow us to almost hear the product before a prototype exists. However, such a facility is expensive to build and expensive to populate with the skilled engineers necessary to operate the devices. Not everybody has it. It also requires a belief in science. Not everybody has that, either.
For some, loudspeaker design is portrayed as an art and the listening experiences that result are described in poetic terms. If the resulting sound is genuinely neutral, allowing listeners an opportunity to hear the real art—the recording—then all is well. If not, the customer is well advised to find another poet—or ponder reconsidering the value of science.
For now, and for the foreseeable future, there will be excellent passive loudspeakers from which to choose. Figure 12.1 shows examples of some passive loudspeakers that approach the performance of active ones. Traditionalists will not be deprived.
The message is unmistakable. Looking back over the collection of measurements in this chapter, one sees evidence of considerable improvement. But one also sees that some years ago progress seems to have plateaued. Good-sounding loudspeakers were being made, and still are, but they all have residual flaws of one kind or other. They may sound comparably good, but just not exactly alike—variations on the same theme.
Some of them require monster monoblock power amplifiers to drive the current-hungry low impedances, sometimes the consequence of the complicated passive crossover networks required to smooth the frequency responses. This is much easier and better if done as equalization in electronics upstream of the power amplifiers, with the power amplifiers optimally designed to match the load conditions and power needs of individual transducers. And, active crossovers are vastly superior to passive versions. The monster monoblocks get replaced by a number of much smaller, simpler, amplifier modules. Modern equalizers can be as complex as needed, and because transducers are minimum-phase devices over their operating frequency ranges a smooth frequency response is a good indicator of freedom from transient misbehavior.
Although some people are still catching up, one needs only to look back over the decades to see that the clues to good sound have been with us for a long time. As I point out in Section 5.1 the “ancients,” as I call them, had the right instincts as far back as 80 years ago (Brittain, 1936–37), even without the benefit of accurate measurements. Harry Olson (1954, 1957) provided more focused guidance accompanied by measurements. Gilbert Briggs (1958) of Wharfedale, assisted by Raymond Cooke (later of KEF), showed credible looking on and off-axis response curves and polar diagrams, and expounded with good sense and insight on enclosures, resonances, phase shift and other factors. Edgar Villchur (1964) of Acoustic Research, was an enthusiastic supporter of measurements, including the idea of integrating on and off axis radiated sound in a measure of the total sound power. He was right when he said: “Once a test has been validated as an index of performance, it can reveal information that might take many hours or even days of uncontrolled listening to discover.”
However, validation is difficult, especially acquiring reliable subjective data. Looking back it is evident that all of the technical metrics existed, but not all were equally useful indicators of sound quality as heard in typical semi-reflective listening rooms. When the subjective and objective data existed and were analyzed, as discussed in Chapter 5, everyone could take some credit in having “anticipated” at least portions of the solution. But until the proofs were in, the divergent claims were simply opinions, and some of them did nothing to advance the science of audio or the interests of consumers. Sections 5.7.1 and 5.7.3 illustrate the dangers of placing too much trust in a single metric, the wrong one, and failing to test it with ongoing rigorous subjective evaluations.
In the intervening years many others have added innovations to loudspeaker design and aids to making engineering measurements. The list of contributors is long and the results have been significant. In every case the ability to measure has been the foundation. Woofers and their enclosures are now designed in computers, with predictable performance. Transducers can be modeled from the magnetic motor systems through the suspension systems and diaphragm flexural modes to predictions of the radiated sound field. Complete systems can be measured in several ways, from anechoic chamber and outdoor free fields, through time-windowed in-room measurements, to the new mind-bending near-field scanning system (Klippel and Bellman, 2016). The merging of science, engineering and art has been exciting to witness and to be a small part of.
My contribution has mainly been to look, as dispassionately as possible, at the possibilities, to contrive and conduct experiments seeking answers to questions, and to offer results and explanations of what was observed. Sometimes this included evidence of who and what might have been right. Nobody has been completely wrong, as it turns out, and even then errors were most often associated with the incomplete information available at the time. Over the years this has often been the absence of unbiased subjective data. This is the scientific method.
Much has been learned about the human listener in terms of capabilities (considerable) and trustworthiness (only in blind listening tests). Chapter 5 shows what is needed to set the design objectives for neutral sounding loudspeakers, using measurement techniques that are available today. The problem for consumers, both domestic and professional, is the lack of useful measurements in specification sheets. Figure 12.3 compares where we are to where we need to be. The simplistic specifications offered by most manufacturers simply insult the intelligence. Choosing a loudspeaker is therefore consigned to the “listening test,” which in the real world is almost always sighted, subject to preconditioning by sales people, colleagues, friends, reviews and so forth. Equal level comparisons of products are rare, and listeners may or may not have time to adapt to the peculiarities of the listening environment. And we must not forget that any listening test includes all of the upstream activities in the recording process. The recordings and the circle of confusion are part of the test. The results of such tests are subject to variation, so in the end the choice involves considerable opportunity for disappointment.
This, I believe, is the true weak link in the audio industry. We know how to design, and to describe in measurements, neutral, accurate, high-fidelity loudspeakers for consumers and professionals. The problem is that the information is so rarely conveyed.
Marketing departments insist that graphical technical data are incomprehensible, so they deliver numerical data that are almost useless, but familiar. My assertion is that data in the form of spinorama or some other comparably revealing graphical format are easily comprehended with the simple guidance: flat and smooth are good, and the more similar all the curves look, the better the sound is likely to be. An engineering degree is not a requirement. However, I do understand why manufacturers are not rushing to reveal useful anechoic data in the ANSI/CTA-2034-A (spinorama), or any other, format. Some of them would be embarrassed, and all of them would have the commitment to maintain, in production, the performance of the “golden prototype.” Manufacturing variations in driver sensitivity and frequency response can be significant, but directivity is unlikely to change. This is yet another advantage of active loudspeakers: the ability to make them functionally identical at the end of the production line.
However, even if we had the ability to identify good loudspeakers, not even the best of them can recreate the subjective impressions of listening to live performances in stereo, the default musical format. There is no magic tweak, no spikes, wires, or exotic electronics that can compensate for a directionally and spatially deprived format. As has been discussed in Chapter 15, multichannel and immersive formats provide welcome added dimension and space. They can be very persuasive, but the musical repertoire in these formats is limited. In any event I intend to enjoy what there is and will be in my soon to be upgraded immersive, listening room—and movies of course.
Finally, if one has the good fortune to acquire excellent loudspeakers, there is still the need to deal with low-frequency problems in small rooms. These have been addressed in Chapters 8 and 9. Equalization is likely to be a component in that corrective action, but outside the bass region equalization needs to be employed with great caution. The widely used “room correction” algorithms assume that the definitive information about sound quality is in the steady-state room curves generated using an omnidirectional microphone. However, two ears and a brain are much more analytical, and in different ways. As has been discussed elsewhere in this book, there is a significant risk of these systems degrading good loudspeakers. Section 12.2.3 points out that some of these systems are installed as if they are program equalizers; adjust the curve until it sounds good. It is a subjective decision that includes the circle of confusion and is therefore biased by the music being listened to at the time.
Equalizers in the form of traditional bass, treble and tilt tone controls are useful to compensate for common spectral peculiarities in recordings caused by the circle of confusion, or to accommodate personal taste. They should be quickly accessible and easy to turn up, down, on or off, as required while listening. But, begin with resonance-free, low coloration—neutral—loudspeakers as the baseline. Audiophiles who reject tone controls in their electronics are simply ignoring the existence of the very real circle of confusion. They mistakenly assume that recordings are flawless.
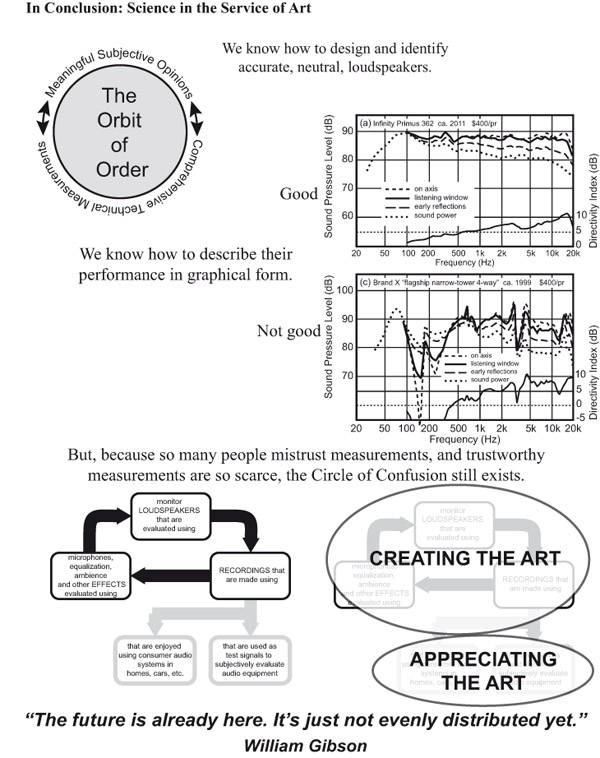
Figure 18.8The “not good” loudspeaker was from a very well-known brand. This product was the brainchild of the US distributor, having nothing to do with the competent parent company. A consultant was hired to design it and one suspects that he phoned the design in. Current Internet forum chat indicates that one person is recommending bi-wiring as an upgrade.
I could go on, but I won’t. It is time to wrap it up. Due to space limitations not all topics have been covered and others have been simplified. However, there is a supporting website where additional information can be found on some of the topics. In Chapter 1 I described the “circle of confusion” as a fundamental problem in the audio industry. It still is. However, over the years we have learned how to design and describe loudspeakers that listeners approve of when listening to a wide range of commercial recordings. They do so in a variety of rooms, without elaborate acoustical treatments, or anything not achievable with suitably arranged normal domestic furnishings. The better the loudspeakers, the more easily the room fades into an innocent context. The higher the channel count, the less the room contributes to the experience.
A good listening experience starts with good loudspeakers. The highly rated loudspeakers have been neutral reproducers—clear “windows” through which to view the art. It is all very sensible, which makes it all the more painful to hear some of the products in the marketplace, portrayed as something they are not. It is unlikely that this will go away. But with education and patience more people may yet hear truly good sound. The discouraging Circle of Confusion has been supplemented with the optimistic Orbit of Order. Good things can happen.
Figure 18.8 summarizes my view of where we are. If you are among those fortunate enough to have a good sound reproducing system, I suggest you join me in a toast, as we listen to music as it should be heard: “here’s to good sound, everywhere and always.”