
THE PERIOD from the end of the Civil War to the resumption of gold payments in 1879 is of unusual interest to the student of money. These were the formative years of the National Banking System and, more generally, of a banking structure that was to remain largely unchanged until the establishment of the Federal Reserve System.
The monetary standard of the period had unique features, some not to recur for many decades, others not at all. It was a fiduciary standard under which no agency of the government was committed to selling gold at a fixed price to all who offered legal tender. It involved freely floating exchange rates between U.S. currency and the currencies of other countries. A fiduciary standard did not recur until 1933. Freely floating rates between the dollar and such other major currencies as the pound sterling and the French franc did not recur until World War I. On no occasion since have they prevailed so long as they did after the Civil War. This was probably the only period of floating rates during which official U.S. transactions played no significant part in either the gold or exchange markets.1 It was certainly the only period in which two kinds of money exchanging at a fluctuating rate—greenbacks and gold—were used domestically side by side to any considerable extent.2
Finally, the price level fell to half its initial level in the course of less than fifteen years and, at the same time, economic growth proceeded at a rapid rate. The one phenomenon was the seedbed of controversy about monetary arrangements that was destined to plague the following decades; the other was a vigorous stage in the continued economic expansion that was destined to raise the United States to the first rank among the nations of the world. And their coincidence casts serious doubts on the validity of the now widely held view that secular price deflation and rapid economic growth are incompatible.
A good starting point for the analysis of both the period covered in this chapter and the longer period covered by this book is the composition of the money stock in 1867, the year our money series starts. The various types of money then in circulation mirror the Civil War financial developments and foreshadow future developments (section 1). The changes in the stock of money, in income, and in prices to 1879 (section 2) reveal some features that we shall find recurring again and again, others that are special to this period. Section 3 examines the politics of resumption; section 4, the factors accounting for the changes in the stock of money, and the concluding section, three problems special to this period: the premium on gold, the factors determining the stock of gold, and the economic bases for successful resumption of gold payments.
Throughout our analysis, we shall have occasion to divide the money stock into two major components: currency and deposits. The reason for the primacy of this division is clear. Since the Civil War, currency has consisted in the main either of specie or of a direct or indirect obligation of the government (for qualifications see below); deposits have been an obligation of privately owned and operated banks that have been legally required to hold assets in the form of currency or its equivalent equal to a fraction of their liabilities. As a result, the lending and investing activities of banks have been linked with the stock of money through deposit creation. In addition, under such a system of fractional reserve banking, the total amount of money is likely to be sensitive to the division of the total between currency and deposits. As we shall see in the course of this chronicle, changes in the public’s attitude toward these two forms of money and the resulting changes in the proportion in which it has desired to hold them have at times played a critical role in monetary developments.
In 1867, the public divided its stock of money almost equally between deposits and currency: it held about $1.20 of deposits for each dollar of currency (Table 1). In the five years after 1867, deposits rose to $2 for each dollar of currency. That increase reflects the rapid post-Civil War growth and spread of commercial banking. The deposit-currency ratio fluctuated around this level until 1880, and then began to rise again—a rise that was destined to continue, albeit with numerous short-term reversals, until 1929, when the public held about $12 of deposits for each dollar of currency. The ratio then fell. In 1960, it was about 6 to 1.
Of the total of commercial bank deposits held by the public, roughly 60 per cent were liabilities of banks that were part of the Civil War-created National Banking System. The rest were liabilities either of banks that were chartered under the laws of the several states or of private banks.
TABLE 1
COMPOSITION OF CURRENCY AND COMMERCIAL BANK DEPOSITS, END OF JUNE 1867 (millions of dollars)
SOURCE, BY LINE
TOTAL
| 1. | Annual Report of the Secretary of the Treasury, 1928, p. 552, less $19 million held against gold certificates (line 2), and less $25 million of gold coin assumed exported or used in the arts and manufactures. |
| 2. | Ibid., p. 550. |
| 3, 5, 6, 8. | Ibid., p. 552. |
| 4. | Ibid., less $7 million in vaults of issuing banks (difference between national bank notes outstanding, from A. P. Andrew, Statistics for the United States, 7867-7909, National Monetary Commission, 1911, Vol. 21, p. 43; and national bank note liabilities of those banks, from Annual Report of the Comptroller of the Currency, 1918, Vol. II, p. 248). |
| 7. | Annual Report (Treasury), 1928, p. 552, less $10 million estimated to have been lost by that date. |
HELD BY TREASURY
| 1-9. | Total, less amounts held by banks and public. |
| 10. | Annual Report (Comptroller), 1918, Vol. II, p. 249. |
| 11. | No Treasury deposits were held at nonnational banks at that time. |
HELD BY BANKS AND PUBLIC
| 1. | Historical Statistics of the United States, Colonial Times to 7957, Bureau of the Census, 1960 (Historical Statistics, 1960), Series X-285, less the $25 million deduction made in the “total” column. |
| 2-8. | Ibid., Series X-286, X-290, X-291, X-296-X-298, with same deductions that are made in the “total” column. |
| 9. | Banks: Sum of figures for national banks, nonnational commercial banks, and mutual savings banks. Vault cash of national banks, from Annual Report (Comptroller), 1918, Vol. II, p. 248, July 1, 1867 figures. For composition of national bank vault cash, see Table A-2, notes to col. 1. Vault cash of nonnational commercial banks was interpolated along a straight line between Jan. figures for 1867 and 1868 in James K. Kindahl, “Estimates of Nonnational Bank Deposits for the United States, 1867-1875” (unpublished Ph.D. dissertation, U. of Chicago, 1958). Vault cash in mutual savings banks was estimated as described for 1867-75 in Table A-2, col. 1. |
| 9. | Public: Currency outside the Treasury, minus currency in the banks. |
| 10. | Annual Report (Comptroller), 1900, p. 583. |
| 11. | Kindahl, “Estimates of Nonnational.…” |
| 14. | Repeats line 13. |
| 15. | The sum of gold coin plus gold certificates, held by banks and the public, times 38  , the premium on gold, from W. C. Mitchell, Gold, Prices, and Wages under the Greenback Standard, U. of California Press, 1908, p. 304. Gold coin and gold certificates held by the banks are assumed to equal gold deposits held by the public (see text). , the premium on gold, from W. C. Mitchell, Gold, Prices, and Wages under the Greenback Standard, U. of California Press, 1908, p. 304. Gold coin and gold certificates held by the banks are assumed to equal gold deposits held by the public (see text). |
The national banks grew rapidly immediately after the Civil War. First authorized in February 1863 to provide a uniform national currency and to aid in financing the Civil War by issuing bank notes secured by government bonds, few national banks were established until defects in the original act had been removed in the act of June 3, 1864.3 Shortly thereafter, in February 1865, a tax of 10 per cent was imposed on note issues of state banks paid out after July 1, 1866 (later changed to August 1, 1866), denying state banks de facto the privilege of note issue. At the time, such great importance was attached to the privilege of note issue that state banks converted to national banks in droves, and state banks were widely believed to be on the way to near extinction. The growing importance of deposits relative to currency and the less restrictive conditions imposed by state than by federal legislation combined to reverse the trend in very short order. By 1867, the decline in the deposits of state and private banks had ceased. These banks then expanded so rapidly that by 1871 the deposits of nonnational commercial banks roughly equaled national bank deposits. From then until now, the two classes of banks have remained roughly equal in the size of their deposits. Indeed, national banks have more frequently had the smaller total.
Private banks are chartered by neither the state nor the national government; they operate as individual proprietorships or partnerships. Once numerous and including some of the most influential banking institutions (J. P. Morgan and Company was probably the most widely known), private banks have played a negligible role in recent years.
The preceding comments all refer to currency and deposits held by the public, including in that term state and local governments but not the U.S. Treasury. In addition, in 1867 the Treasury held deposits totaling $33 million, or about 4½ per cent as much as the deposits of the public in commercial banks, and currency totaling $162 million, or nearly 30 per cent of the public’s holdings. The Treasury clearly held a much lower ratio of deposits to currency than the public, 20 cents in deposits for each dollar of currency compared to the $1.20 held by the public. The reason is twofold. First, as a monetary authority issuing currency, the Treasury’s balances were in part “inventory” and could at times be increased simply by printing more currency without issuing it to the public. Second, the low level of deposits was a consequence of the Independent Treasury System, which was first adopted in 1840 as a legacy of the Bank War over the renewal of the charter of the Second Bank of the United States, was discontinued in 1841, and was re-established in 1846. In the form that the Independent Treasury had assumed by 1867, disbursing officers were permitted to use national banks as depositories and the Treasury was permitted to deposit receipts from internal revenues in national banks provided the banks furnished security by depositing United States and other bonds with the U.S. Treasurer. However, the Treasury was prohibited from depositing customs receipts (which were paid in gold). The Treasury’s deposits remained small relative to either its currency holdings or the public’s deposits until near the end of the century, except for isolated occasions when they were built up as a deliberate act of monetary policy. For some years after the turn of the century, they remained relatively high as part of a deliberate policy of continuous Treasury intervention in the money market. They then relapsed until they rose to unprecedented levels as a result of the bond-selling drives of World War I.
Commercial banks also held deposits for one another. These interbank deposits are not recorded in Table 1. Since one bank’s asset is another bank’s liability, interbank deposits cancel when the accounts of banks are consolidated into the accounts of the banking system as a whole. The deposits recorded in Table 1 represent the liabilities of the commercial banking system as a whole to the public and the Treasury. The system as a whole can have no net liability to itself.
The banking system as a whole did, of course, hold currency. In June 1867, it held $247 million of currency, nearly half as much as the public held and equal to over a third of its net liabilities to the public. Currency constituted the whole of the banking system’s net cash assets, and we shall refer to it as the banking system’s “reserves”, recognizing that we are using this term in a sense that corresponds neither to an individual bank’s view of its cash assets—which would clearly include the amount due from other banks—nor to funds acceptable as satisfying legal reserve requirements—which generally included deposits at other banks within specified limits and sometimes did not include all types of currency.4 Unfortunately, available data do not permit division of each of the various kinds of currency between the banks and the public. So we have to deal with the combined totals (Table 1, lines 1 to 8).
The impress of the Civil War was even sharper on currency than on deposits: the three largest items in the list (national bank notes, U.S. notes, and other U.S. currency) and one of the smaller items (fractional currency) were all creations of the Civil War. Taken together, these four items account for over 90 per cent of the total currency in the hands of the public and in banks in 1867. If we apply the same percentage to the public’s holdings alone, nearly three-quarters of the total money stock—these items plus national bank deposits—was of Civil War origin, types of money that had not existed only six or seven years earlier.
The national bank notes were liabilities of the national banks, which could issue them by depositing with the U.S. Treasurer specified government bonds equal in face value to 111 per cent of the value of the notes issued.5 After 1874, the banks were also required to deposit with the Treasury a redemption fund in lawful money equal to 5 per cent of the value of their notes.6 In addition, the amount of notes a bank could issue was limited to nine-tenths of its capital until 1900 and the whole of its capital thereafter. First issued in 1864, the amount outstanding grew rapidly to nearly $300 million in 1866 and then increased more slowly but fairly steadily to $340 million in 1874.7 National bank notes played an important part in our monetary system for some six decades until 1935, when all United States bonds bearing the circulation privilege were called for redemption.
Though national bank notes were nominally liabilities of the banks that issued them, in effect they were indirect liabilities of the federal government thanks to both the required government bond security and the conditions for their redemption. Hence, their value did not depend on the financial condition of the issuing bank. If a bank failed, the law provided for the immediate redemption of all its notes at the Treasury and authorized the Comptroller of the Currency to declare the bonds securing the circulation to be forfeited to the United States. The Treasury was given a first lien upon the assets of the bank and upon the personal liability of the stockholders in order to make good any possible deficiency between the amount of notes it redeemed and the sum of the 5 per cent cash redemption fund which the issuing bank maintained with the Treasury (after 1874) and the proceeds from the sale by the Comptroller of the forfeited bonds.
National bank notes differed in usefulness from currency issued directly by the U.S. government in only one respect. Federal law did not permit them to be used to meet the legal reserve requirements of national banks, though most state laws did permit them to be used for this purpose by state banks. Only “lawful money” was acceptable for national banks and national bank notes were not lawful money. But inasmuch as the public at large regarded national bank notes as equivalent to other notes and other types of currency were always a multiple of bank vault cash, that restriction was of no great practical importance. We know of no episode after 1874 in which it raised any significant problems for banks.8 Consequently, national bank notes after that date circulated at parity with other currency; and we shall have little occasion subsequently to distinguish them from currency issued directly by the Treasury. There was no recurrence of the pre-Civil War phenomena of notes of different banks circulating at discounts or premiums with respect to one another, and at different discounts or premiums depending on the distance from the issuing bank, or of bank-note detectors to enable merchants and others to determine the value of particular notes. In this respect the Civil War and immediately post-Civil War legislation succeeded in one of its primary objectives—the provision of a uniform national currency.
National bank notes were like explicit Treasury currency, not only because they were obligations of the federal government at one remove, but also because the maximum possible amount outstanding was determined, also at one remove, largely by federal action, either administrative or legislative. This amount was determined by the volume of government securities bearing the circulation privilege. The fraction of this maximum issued might be expected to depend on the financial incentive to do so and this in turn to hinge partly on the terms on which bonds bearing the circulation privilege could be acquired on the market.
These expectations are not fully confirmed by the evidence. Before 1890 the amount outstanding ranged around 20 per cent of the possible maximum, by 1900 it had risen to about 28 per cent, and by World War I to about 80 per cent. The maximum was in fact approached only in the twenties, when for the first time U.S. bonds deposited to secure circulation and government deposits (which also required such security) nearly equaled the total of eligible bonds. Before 1905, the capital stock of national banks set narrower limits to their maximum possible note issue than did the total of eligible bonds, but the actual issue did not approach this lower limit either. Thereafter, the capital stock of national banks exceeded the total of eligible bonds and hence was not the effective limit on note issue. Yet, despite the failure to use fully the possibilities of note issue, the published market prices of government bonds bearing the circulation privilege were apparently always low enough to make note issue profitable except in the years 1884 to 1891. The fraction of the maximum issued fluctuated with the profitability of issue, but the fraction was throughout lower than might have been expected. We have no explanation for this puzzle.9
The United States notes are the “greenbacks” of Civil War fame. First issued to supplement tax and loan receipts in the financing of war expenditures, the total outstanding (in and outside the Treasury) reached a maximum of $449 million in January 1864. Under the terms of the act of April 12, 1866, the amount outstanding was reduced to $356 million by the end of 1867 and was then legally fixed at that level until 1873-74, when additional amounts were issued that raised the total outstanding to $382 million. As part of the Resumption Act of 1875, the retirement of the greenbacks was linked to the increase in national bank notes—for every five dollar increase in national bank notes the Treasury retired four dollars in greenbacks—and was to cease when the amount outstanding fell to $300 million. However, further retirement was suspended by an act of May 31, 1878, which established as a permanent issue the amount then outstanding, $347 million, the level at which the total issue of U.S. notes stands today. These repeated legal changes from 1865 to 1878 are a symptom of the political controversy about the greenbacks and about their role in the accompanying price decline, on which we shall comment further, below.
“Other U.S. currency” (Table 1, line 8) is a total of various Civil War issues that circulated as currency. It includes interest-bearing legal tender notes—one of the few instances we know of in which hand-to-hand currency paid interest—government demand notes, and other obligations that were not a legal tender.10 These issues reached a maximum of almost $240 million in 1865; by 1867, they had been cut in half. Their retirement was substantially achieved by 1872 and only negligible amounts were outstanding thereafter.
Gold aside, the only other items of any size are fractional currency and subsidiary silver. The former, as noted, dates from the Civil War, when coins were exported because subsidiary silver became more valuable as metal than as money. Postage stamps and privately issued “shinplasters” came into use as a substitute until the Treasury began to issue fractional currency in the denominations previously used for subsidiary silver.
The final item in the inventory is gold coin and certificates,11 the estimates for which during that period of a fiduciary currency are most unreliable. This statistical uncertainty is matched by uncertainty about the economic role of gold and about the appropriate way to treat it for monetary analysis.
The major monetary use of gold was for foreign transactions. For foreign payments, gold was equivalent to foreign exchange since a number of important countries, notably Great Britain, maintained a gold standard. The leading traders in foreign exchange quickly adopted the practice of hedging against exchange fluctuations by buying and selling gold to offset changes in their liabilities in foreign currencies.12 (The risk to be hedged was particularly great before the completion in 1866 of the first successful trans-Atlantic cable.13 Before cable transfers were possible, it took about two weeks for dealers in New York to learn exchange rates on the London market and for dealers in London to learn New York rates. The completion of the cable made it possible to reduce the information lag to a matter of minutes or hours.)
Dealers as well as others having extensive foreign transactions therefore found it convenient to maintain gold balances as well as greenback balances. To accommodate them, New York banks, and perhaps others as well, had two kinds of deposit accounts: the usual deposits payable in greenbacks or their equivalent, and special deposits payable in gold. The gold deposits were expressed in “dollars” like the greenback deposits, but that dollar meant a very different thing. It stood for the physical amount of gold that had corresponded to a dollar before the Civil War and was to again after 1879. During the period of suspension, this physical amount of gold was worth more than a dollar in greenbacks—it was worth well over two dollars in greenbacks from mid-1864 to early 1865, and about $1,383 in June 1867, the date to which Table 1 refers (see the dashed line on Chart 5 below, which gives the greenback price of gold from 1861 to 1879. The line shows the prices in current paper money of the weight of gold which cost $100 before the Civil War and after resumption).
Gold also retained an appreciable, though minor, role in domestic payments. Customs duties were payable in gold. In addition, throughout the suspension period, the Treasury made virtually all interest and principal payments on its debt in gold at the pre-Civil War monetary value, though there was some dispute about whether it was legally required to do so.14 Some private debt instruments required payment of interest or principal in gold. Finally, the West Coast remained largely on a specie basis. In the rest of the country, prices were quoted in greenbacks, and gold offered in payment was valued at its current market premium in greenbacks. On the West Coast, by contrast, prices were quoted in gold, and greenbacks offered in payment were valued at their current market discount in gold.15
In essence, there was a dual monetary standard—the greenback dollar and the gold dollar—the one official, the other unofficial, and the price of the one in terms of the other determined in a free market—the market for gold, or, equivalently, British sterling. The two kinds of money were not interchangeable at a fixed rate. That is why they could coexist side by side without either driving the other out.16 The total of the two obtained by treating one greenback dollar as equal to one gold dollar, as is done in calculating entries in Table A-l, in lines 9-14 of Table 1, and in every other summary of monetary statistics for the greenback period we know of, is, strictly speaking, meaningless: it is like adding current Canadian or Hong Kong dollars to U.S. dollars on a one-for-one basis. In order to get the total greenback value of the money stock in the hands of the public, the public’s holdings of gold coin and gold certificates and also of deposits payable in gold should be raised by the premium on gold, approximately 38.3 per cent at the end of June 1867, the date to which the figures in Table 1 refer. Unfortunately, we cannot make this correction at all accurately, even if we assume that the gold stock figures in Table 1 are correct, because there are no adequate data on either the subdivision of the gold stock outside the Treasury between the banks and the public or the division of total deposits between greenback and gold deposits. The correction entered in line 15 of Table 1 assumes implicitly that the banks held one dollar in gold coin or certificates for each dollar of gold deposits. One might expect this to be an underestimate of the correction, since at first glance there seems no reason for banks that held fractional reserves against greenback deposits to hold an amount of gold equal in value to the deposit liabilities payable in gold. However, some empirical evidence suggests this is roughly what they did, and banking practice and legal requirements suggest some reasons it might have been sensible for them to do so.17
The correction required to allow for the excess value in greenbacks of gold counted as money almost certainly declined over time along with the greenback price of the gold dollar. Gold deposits may have increased as the premium on gold declined, because that reduced the risk of holding liquid funds in the form of gold as a reserve for liabilities expressed in greenbacks.18 However, it seems unlikely that any such increase, if indeed there was one, could have been large enough to offset the decline in the premium. In consequence, while our estimates of the stock of money from 1867 to 1879 underestimate the economically relevant total throughout, they probably do so by successively smaller amounts.19 The understatement, while appreciable, cannot at any time be substantial, as the smallness of our approximate correction in Table 1 shows, which is why we have felt no serious compunction about making no such correction in the figures entered in Table A-l.
The stock of money in January 1867, when our series starts, was probably lower than it had been in the North at the end of the Civil War. It continued to decline to January 1868, according to the annual figures for those years plotted in Chart 3, then rose, at first mildly, then sharply, then mildly again, to a temporary peak in 1873. After a mild relapse and mild further rise, the stock of money reached a peak in 1875 from which it declined by some 9 per cent to a trough in early 1879.
CHART 3
Money Stock, Income, Prices, and Velocity, in Reference Cycle Expansions and Contractions, 1867–79

NOTE: Shaded areas represent business contractions; unshaded areas, business expansions.
SOURCE: Wholesale prices, Historical Statistics of the United States, 1789–1945, Bureau of the Census, 1949 (Historical Statistics, 1949), p. 344. Other data, same as forChart 62.
This behavior is in one respect most unusual. There are 5 calendar years in which the money stock declined and 7 in which it rose. The rises were on the average larger than the declines, but even so the money stock in February 1879 was only 17 per cent above its level 12 years earlier in January 1867. By comparison with later experience, this is an extraordinarily high ratio of declines to rises and a small total rise. One must go more than half a century forward from 1879 all the way to 1933 to find another 12-year period within which the money stock declined in as many as 5 calendar years. In the whole 81 years from 1879 to 1960 there are only 13 single years of decline.20 As to the size of the rise, the only other period in our subsequent history when the money stock was as little as 17 per cent above its level twelve years earlier is from 1931 to 1939, reflecting the sharp decline in the stock of money from 1929 to 1933.
As this final comment suggests, although the fraction of years of decline from 1867 to 1879 is atypical, the circumstances under which the declines occurred are not. Most of the declines during that period came during the contraction of 1873 to 1879 (designated in Chart 3 by the shaded area), one of the longest on record and generally regarded as one of the more severe. All except three succeeding declines also took place during unusually severe business cycle contractions.21In the remaining business cycle contractions, the stock of money continued to grow though at a slower rate than during expansions. The contrast between the slow rate of growth from January 1868 to January 1870—which is to be associated with the business contraction from June 1869 to December 1870—and the more rapid rate of growth from January 1870 to January 1872—which is to be associated with the business expansion from December 1870 to October 1872—is rather typical of subsequent experience.
The timing of the rate of change in the stock of money in relation to the cyclical movements is fairly typical of later experience: the rate of growth of the stock of money accelerated well before the cyclical trough in December 1870, decelerated well before the cyclical peak in October 1873, and accelerated well before the trough in March 1879. For the 1879 trough, the acceleration consisted of a slower rate of decline than earlier, so that the absolute trough in the level of the money stock just about coincided with the trough in business, so far as we can tell from our semiannual figures (see Chart 3). We shall find these phenomena of acceleration of the money stock preceding a cyclical trough and deceleration preceding a cyclical peak, both by sizable intervals, repeated time and again in subsequent experience.22We shall find also in subsequent deep depressions that the absolute trough in the money stock often coincided with the cyclical trough as, for example, it did in 1933.
The unusually slow rate of rise in the money stock and the unusually large fraction of declines from 1867 to 1879 are paralleled by and connected with the unusual behavior of prices. As Chart 3 shows, wholesale prices fell sharply from 1867 to 1879. The decline was interrupted significantly only during the cyclical expansion beginning December 1870, the interruption following by a year the one segment of the period (1870–72) when the money stock rose sharply. And the decline in prices was especially sharp from 1873 to 1879, the period when the money stock first rose very mildly and then fell for some four years. There is no subsequent period of comparable length during which wholesale prices fell fairly continuously at a rate approaching the average rate of 6½ per cent per year at which they fell in the fourteen years from 1865 to 1879.23
Though the movements in both money and prices differ in the same way from subsequent experience, there is a sharp contrast between their absolute behavior. From January 1867 to February 1879, the money stock at nominal value rose at the rate of 1.3 per cent per year; the price index fell at the rate of 5.4 per cent per year. Part of this contrast probably reflects statistical defects in our estimates. We have seen that our money figures overstate the rise in the money stock by failing to allow for the excess of market over nominal value of gold. But this would have only a minor effect in bridging the gap between the changes in money and in prices, at most reducing the estimate of the rate of rise in money from 1.3 to 1.1 per cent per year. We shall assume that the lower figure measures the true rate of growth of the money stock over this period.
Probably more serious are defects in the plotted index as a measure of wholesale prices in general, let alone as a measure of a broader concept of the price level. The unavailability of monthly data limited sharply the commodities included in the index, and enforced disproportionate emphasis on farm products and raw materials.24 But this was a period when improvements in transportation were reducing prices of such products by lowering the cost of shipment from areas cultivated earlier and, even more, by making it feasible to cultivate commercially new areas containing highly fertile land. In addition, technological improvements were probably producing a decline in the price of commodities in general relative to services that would have considerable weight in a consumer price index. Alternative indexes available on an annual basis suggest decidedly smaller price declines—of the order of 2.3 to 3.9 per cent per year rather than 5.4 per cent.25 We shall assume that a 3.5 per cent annual rate of decline in prices is a reasonable estimate of the change from January 1867 to February 1879.
The rest of the contrast, that between a rise of 1.1 per cent per year in the money stock and a decline of 3.5 per cent per year in prices, must, as a matter of arithmetic, reflect either a rise in output and so in the “work” to be done by the money stock, or a rise in the amount of money balances in real terms that the public held per unit of output, which is to say, a decline in the velocity of money, defined as the ratio of money income to the stock of money. As a matter of economics, there can be little doubt that it reflects primarily a rise in output.
A rough guess of the size of the rise can be obtained by estimating on the basis of later data the change in velocity from 1867 to 1879. As we shall see in later chapters, velocity is a relatively stable magnitude that has declined secularly as real income has risen, and that has a fairly regular cyclical pattern, falling during contractions and rising—or falling at a lower rate—during expansions. Later experience suggests that the relevant secular decline for the period 1867–79 is about 1 per cent per year, whether estimated crudely or in a more refined way.26 Both 1867 and 1879 contain cyclical troughs. Even so, some allowance for the influence of cyclical factors should in principle be made, since 1867 is the trough of a mild depression cycle and 1879 is the trough of a deep depression cycle. However, we made no such allowance, since our estimate of what it should be turns out to be negligible—about one-tenth of 1 per cent per year.27 One might therefore infer that of the 4.6 percentage point gap to be explained, about 1 percentage point can be attributed to velocity, leaving 3.6 percentage points to be accounted for by a rise in output.
We need not rely solely on this indirect inference since there is much direct evidence of a rapid rise in output from 1867 to 1879 to confirm the inference. Population rose by more than 30 per cent or at the unusually high rate of 2.3 per cent per year, so that it alone accounted for half of the gap of 4.6 per cent to be explained, and output per capita was surely rising. The population rise is itself indirect if somewhat ambiguous testimony; it seems probable the wave of immigration that contributed to it was attracted by rising per capita income, though it is possible it was attracted simply by higher per capita income in the United States than in the country of origin. The latter part of the period was after all regarded as a period of depression throughout the world.
There are many other signs of rapid economic growth. This was a period of great railroad expansion dramatized by the linking of the coasts by rail in 1869. The number of miles of track operated more than doubled from 1867 to 1879, a rate of expansion not matched subsequently.28 In New York State, for which figures are readily available, the number of ton miles of freight carried on railroads nearly quintupled and, for the first time since the figures began, exceeded the number of ton miles carried on canals and rivers.29 The outcome of the Civil War terminated the political controversies that had raged about the manner of settlement and development of the great plains west of the Mississippi. The political developments combined with the great cheapening in transportation to produce a rapid extension of the area under cultivation. The number of farms rose by over 50 per cent from 1870 to 1880 for the U.S. as a whole. The average value per acre apparently increased despite the sharp decline in the price of farm products—clear evidence of a rise in economic productivity. The output of coal, pig iron, and copper all more than doubled and that of lead multiplied sixfold.
Manufacturing shared in the expansion. The Census reported 33 per cent more wage earners engaged in manufacturing in 1879 than in 1869, though 1879 was a year containing a cyclical trough and one following an unusually long contraction, while 1869 was a year containing a cyclical peak. An index of basic production compiled by Warren and Pearson nearly doubled from 1867 to 1879 (since 1867 also contained a cyclical trough, comparisons between 1867 and 1879 are freer from distortion by cyclical change than comparisons between 1869 and 1879). The rapid progress of the United States in manufacturing was clearly reflected in international trade statistics. Despite a decline in prices, exports of finished manufactures were nearly 2½ times as large in gold values and 1¾ times as large in greenback values in 1879 as in 1867. These increases are certainly not too small to be consistent with the rise of 3.6 per cent per year in total output—equivalent to a 54 per cent increase in total output over the 12-year period—and of about 1.3 per cent per year in per capita output suggested by indirect inference from the rates of change in money and in prices.
Beginning with 1869, annual estimates are available of net national product, in both current and constant prices, constructed by Simon Kuznets (worksheets underlying his Capital in the American Economy).30These estimates, plotted in Chart 3, are admittedly highly tenuous for this early period, which is why we have not wished to rely on them alone. Indeed, Kuznets himself has been most reluctant to use them except in the form of averages for groups of years, and even then only for the study of secular trends.31 He notes that a major reason for questioning the accuracy of the figures for the early decades is the extraordinarily large increase in estimated real income from 1869–78 to 1879–88. “The rise in gross and in net national product is close to 40 per cent of the mid-decade base. No comparable rises occur in any other decade in the period.”32 Kuznets points out that “this large rise is directly traceable to that shown for the 1869–79 decade” by the series on commodity output constructed by Shaw and incorporated in Kuznets’ estimates.33 He cites the opinions of Shaw and Francis A. Walker that the 1869 Census of Manufactures was understated relative to the 1879 Census, quoting estimates of the extent of understatement ranging from 5 per cent to 13 per cent; but he concludes, “We did not make the adjustment [for understatement] here, because we had no firm basis for 10 per cent in 1869 and 0 per cent in 1879, and because the effect on the decade averages was relatively minor.”34
According to these annual estimates, net national product in current prices rose at the rate of 3.0 per cent per year from 1869 to 1879,35and net national product in constant prices rose at the rate of 6.8 per cent per year, implying a decline in prices at the rate of 3.8 per cent per year (Table 2, lines 2–4). Since population grew over the decade at the rate of 2.3 per cent per year, the implied rate of growth of real per capita income is no less than 4.5 per cent (Table 2, lines 6–7). The qualitative conclusion is the one we reached before, but the quantitative result is far more extreme. The result is rendered even more surprising by the cyclical characteristics of the initial and terminal years. According to National Bureau monthly reference dates, June 1869 was a cyclical peak and March 1879 a cyclical trough, though the subsequent upturn was so rapid that 1878 is listed as the trough year in the annual reference dates. Moreover, the contraction terminating in 1879 was the longest experienced by the United States from at least the Civil War to the present. In consequence, a comparison between 1869 and 1879 might be expected to understate the secular rate of growth. These are among the considerations that have led Kuznets and others to question the accuracy of his estimates for the early decades.36
TABLE 2
KEY ECONOMIC VARIABLES IN 1869 AND 1879
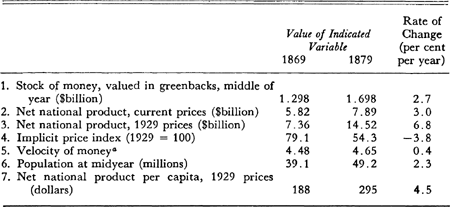
NOTE: Annual rates of change are continuously compounded.
a Differs from velocity figures used elsewhere in this study, which are based on nominal values of money stock.
SOURCE, BY LINE
| 1. | Straight-line interpolation to end of June between figures in Table A-l, col. 8, with addition for 1869 of the sum of gold coin (corrected) and gold certificates outside the Treasury, times the premium on gold (Mitchell, Gold, Prices, and Wages, p. 310). |
| 2–4. | Same as forChart 62. |
| 5. | Line 2 divided by line 1. |
| 6. | Historical Statistics, 1960, Series A-2, p. 7. |
| 7. | Line 3 divided by line 6. |
Our money estimates provide some evidence on the possible error in the net national product figures for the decade 1869–79. We earlier derived from these figures the estimate that real income grew from January 1867 to February 1879 at the rate of 3.6 per cent per year—or by a total of 54 per cent in the 12-year period. Since there was a cyclical upswing from 1867 to 1869, real income must have grown during those years. Hence, on this score, 54 per cent is an overestimate of the growth from 1869 to February 1879, and probably also, though less certainly, to calendar 1879. Yet Kuznets’ estimates show a growth of 97 per cent from calendar 1869 to calendar 1879.
Instead of drawing an inference from the 1867–79 estimates, we can use the money and price figures to derive corresponding estimates directly for calendar 1869 to calendar 1879. This time crude and refined estimates of velocity yield somewhat more divergent results (see Table 3).37 For net national product in current prices, these estimates imply a rise of 12 or of 5 per cent from 1869 to 1879; Kuznets’ estimates show a rise of 35 per cent. For net national product in constant prices, these estimates imply a rise of 63 or of 54 per cent; Kuznets’ figures, as just noted, show a rise of 97 per cent. The lower of these estimates is identical with the one we extracted crudely from our 1867 to 1879 money and price data.
It should be emphasized that the crude monetary estimate of the annual rate of change in net national product in current prices, 1.1 per cent (Table 3, line 1, column 2), is statistically completely independent of the net national product figures indicating a rate of growth of 3.0 per cent. With but a negligible exception, not a single number used in the calculation of the net national product figures for the decade 1869 to 1879 has been used in computing the crude estimates.38For the refined estimate of 0.5 per cent, the price index implicit in the net national product series was used in the derivation of velocity, so that estimate is not completely independent of the net national product series. But it is completely independent of any of the quantity data entering into the net national product series. This is equally true of the other estimates based on the monetary figures in the table.
TABLE 3
ALTERNATIVE ESTIMATES OF CHANGE IN NET NATIONAL PRODUCT FROM 1869 TO 1879

SOURCE: Friedman, “Monetary Data and National Income Estimates,” p. 280, Table 2.
The estimates based on the monetary figures confirm one striking finding of the Kuznets estimates, namely, that the decade from 1869 to 1879 was characterized by an extraordinarily rapid growth of output: at a rate of 4.3 or 4.9 per cent per year in total output, and 2.0 or 2.6 per cent per year in per capita output. Such rapid growth from a year at the peak of a cycle to a year following an extremely long cyclical contraction is no mean accomplishment. In this respect, the monetary estimates confirm the general reliability of the Kuznets estimates for precisely the use for which Kuznets designed them.
At the same time the monetary estimates also indicate that the rate of growth was appreciably lower than that shown by the net national product estimates, and that the margin of error in the latter may well have been higher than the maximum estimate of error cited by Kuznets. If they are taken as entirely accurate, the monetary estimates in Table 3 imply that the ratio of the 1869 to 1879 net national product estimate understates the “true” ratio by 18 per cent, according to the crude estimate, or by 22 per cent, according to the refined estimate. The maximum estimate of error cited by Kuznets is 13 per cent.
The monetary estimates so far cited give no basis for distributing the indicated error between 1869 and 1879. So far as they go, the error may arise entirely from underestimation of the 1869 net national product, and the 1879 figure may be correct; or the 1869 figure may be correct and the error arise entirely from overestimation of the 1879 net national product; or any of an infinite number of other combinations may be valid. However, a similar analysis for the next decade suggests that the 1879 net national product figure is high relative to the 1889 figure.39 If we suppose the 1889 figure to be accurate, this would imply that the 1879 figure is too high. Hence, a division of the indicated error between 1869 and 1879, so as to raise the 1869 figure and lower the 1879 figure, could render the income figures consistent simultaneously with the monetary figures for the decades 1869–79 and 1879–89.
The monetary figures for 1869 to 1879 give reason to question not only the change in income shown by Kuznets’ figures but also the pattern within that decade as depicted in Chart 3. Consider the velocity series on that chart. Velocity declines from 1869 to 1871, rises to 1873, and declines to 1875. So far, so good. June 1869 marked a cyclical peak, December 1870, a cyclical trough, and October 1873, a cyclical peak, so these movements conform to the cycle in the same direction as later movements. But then comes a serious discrepancy. Velocity rose some 17 per cent from 1875 to 1879, bringing the terminal velocity to a level 4 per cent higher than in 1869 and 8 per cent higher than in 1873, both cyclical peak years. Such a rise in velocity during the later stages of a contraction is unique in the statistical record from that time to the present: in subsequent contractions, velocity rose in only one out of twenty contractions (1899–1900) and then by less than 2 per cent. Even this exception may reflect only the defect of annual data for such a short contraction.
The movements of velocity suggest that much of the overstatement of the rate of growth may be concentrated in the net national product estimates for the years 1875 to 1879. And this is also the impression given by the annual net national product estimates themselves. In constant prices, these show no decline at all during the contraction of 1873 to 1879, only a slowing down of the rate of growth during the initial years from 1873 to 1875. The estimates show a very rapid rate of growth from 1875 to 1879—indeed, that rate of growth was exceeded in the whole decade only from 1871 to 1872. During those final four years of the supposed contraction the indicated rate of growth was nearly 9 per cent per year. The only other four-year period in the peacetime record showing a more rapid rate of growth of real income is 1933–37, the recovery period after the severe 1929–33 contraction.
Of course, the monetary estimates, too, are subject to error and cannot be taken as entirely accurate. Errors in the figures on the stock of money or the failure of velocity to behave during this decade as it did during others may have produced an overestimate of the error in the net national product figures. But, equally, they may have produced an underestimate. The fact that the monetary estimates indicate an error in the net national product figures in the same direction, and of roughly the same order of magnitude, as that suggested by independent evidence is some testimony to both the accuracy of the underlying monetary data, and the validity of the relations used to convert the rate of change in the money stock into an estimate of the rate of change in income.
Whichever estimate of net national product one accepts, the major conclusion is the same: an unusually rapid rise in output converted an unusually slow rate of rise in the stock of money into a rapid decline in prices. We have dwelt on this result and sought to buttress it by a variety of evidence, because it runs directly counter both to qualitative comment on the period and to some of the most strongly held current views of economists about the relation between changes in prices and in economic activity. Contrast, for example, this result with the widely accepted interpretation of British experience in the 1920’s, when Britain resumed specie payments at prewar parity. The prewar parity, it was said, overvalued the pound by some 10 per cent or so at the price level that prevailed in 1925 at the time of resumption (prices by then having fallen about 50 per cent from the postwar price peak); hence, the successful return to gold at the prewar parity required a further 10 per cent deflation of domestic prices; the attempt to achieve such further deflation produced, instead, stagnation and widespread unemployment, from which Britain was unable to recover until it finally devalued the pound in 1931. On this interpretation, the chain of influence ran from the attempted deflation to the economic stagnation.
In the greenback episode, a deflation of 50 per cent took place over the course of the decade and a half after 1865. Not only did it not produce stagnation; on the contrary, it was accompanied and produced by a rapid rate of rise in real income. The chain of influence ran from expansion of output to price decline. From 1869 to 1873, the money stock rose on the average by more than enough to match the estimated rise in population and presumably also the rise in the labor force, so money wages did not have to fall. This doubtless eased the process of adjustment, since it required flexibility only in product prices in response to rising output per worker. After 1873, the stock of money rose less rapidly and then fell, while population continued to rise, so money wage rates did fall; and this was connected with the severe contraction beginning in 1873. But even so, wages apparently fell fast enough to avoid continued severe unemployment or industrial stagnation.40
Though declining prices did not prevent a rapid rise in real income over the period as a whole, they gave rise to serious economic and social problems. The price declines affected different groups unevenly and introduced additional elements of uncertainty into the economic scene to which adjustment was necessary. Moreover, as we have seen, neither the decline in prices nor the rise in real income proceeded regularly. The beginning of cyclical contraction in 1873 was accompanied by a financial panic in September 187341 and by numerous business failures, and was followed by a resumption of the decline in prices—which had been interrupted briefly during the expansion of 1870–73. The business contraction did not end until March 1879.
Accustomed as we are to viewing economic affairs through a monetary veil, the steady decline in prices from 1873 to 1879 probably led contemporary observers and has certainly led later observers to overstate the severity of the contraction in terms of real output. As we have seen, Kuznets’ estimates show no decline in net national product in constant prices at all, only a slowing up of the rate of growth in 1874 and 1875, and an exceedingly rapid rate of growth thereafter. Although these estimates almost surely paint too rosy a picture, only retinting, not repainting, is needed. Some physical-volume series decline during 1874 and 1875, but some rise throughout the contraction and most do so after 1875.42
The contraction was severe. Yet an analyst who assessed the contraction on the basis of physical-volume series alone would regard it as shorter in length and far less severe than it has generally been judged. The decline in prices and the monetary uncertainty from 1873 through 1878 converted it into an episode regarded by contemporaries as the onset of the Great Depression, and influenced the choice of dates assigned to the contraction in the National Bureau chronology.
Contemporary discussion of that difficult period attributed falling prices and depressed conditions largely to the behavior of the stock of money—and rightly so in the sense that, given the rapid rate of economic growth, the price decline could have been avoided only by a more rapid rate of rise in the stock of money. Attention centered almost entirely on greenbacks, as our earlier listing of legislation indicates, and hardly any notice was taken of the decline in deposits after 1875.43
The political agitation for expansion of the currency which was to mark the last three decades of the century had its inception in the period immediately after the Civil War.
At the close of the Civil War, the Administration, Congress, and the public at large were all generally committed to resumption of specie payments, and regarded contraction of the currency as a necessary step toward that end. In his annual report issued in December 1865, Secretary of the Treasury Hugh McCullough wrote that “The present legal-tender acts … ought not to remain in force one day longer than shall be necessary to enable the people to prepare for a return to the constitutional currency,”44 and recommended measures directed toward the early retirement of the greenbacks. The House of Representatives promptly resolved by a vote of 144 to 6 that it cordially concurred in these views,45 and a few months later Congress passed the act of April 12, 1866, which was intended to put into effect the policies recommended by McCulloch. As to the public, bankers and business men—later to be deeply divided on the question—were at the time as one in favor of resumption; and labor and agrarian groups—later to be in the forefront of the drive for expansion of the greenback issue and for free silver—were at the time still committed to hard money, as they had been since at least the Bank War.46
The sharp decline in prices and the business contraction that followed the end of the Civil War produced, after some lag, a marked change in sentiment. In February 1868, Congress suspended the retirement of greenbacks. Prominent, though ultimately unsuccessful, candidates for both the Republican and Democratic Presidential nominations proposed that government bonds be paid in greenbacks instead of gold. Indeed, the Democratic platform contained a provision to that end —“one currency for the government and the people, the laborer and the office-holder, the pensioner and the soldier, the producer and the bond holder”—though its nominee, Horatio Seymour, was strongly opposed.47 The Republican platform opposed this step and, after the Republican victory, Congress passed the act of March 18, 1869, pledging repayment in specie, except only for securities issued with an express provision for some other payment.
Needless to say, public controversy continued. Currency contraction was strongly advocated as a step toward immediate resumption, especially by persons engaged in foreign trade, eastern bankers, and some manufacturers, predominantly New England textile men. Currency expansion was just as strongly advocated, to offset the baleful effects of deflation, by an even more mixed lot—agrarian groups that had initially been strong proponents of currency contraction, spokesmen for labor groups, western merchants and bankers, Pennsylvania ironmasters, and businessmen men with interests in western real estate and transportation.48 Still others favored leaving the currency alone—in the phrase used by George Opdyke, of this group, “masterly inactivity” with respect to the currency—with resumption as an ultimate albeit distant goal.49
In Washington, the bone of controversy was the right of the Secretary of the Treasury to reissue the $44 million of greenbacks that had been retired by 1868. While Democrats tended to support that right and Republicans to deny it, there were no hard and fast lines dividing the parties, and Republican-appointed secretaries from time to time exercised the right.50
While these disputes raged, a related issue was under consideration in the courts: Was it constitutional for Congress to make greenbacks a legal tender in payment of all debts, public and private, even those contracted before the Legal Tender Acts (the name for the acts authorizing the greenback issues) were passed? In the first of the famous greenback cases, Hepburn v. Griswold, decided on February 7, 1870, a majority of the Supreme Court declared it was not constitutional. Perhaps the most fascinating aspect of this decision is that it was delivered by Chief Justice Salmon P. Chase, who had been Secretary of the Treasury when the first greenbacks were issued. Not only did he not disqualify himself, but in his capacity as Chief Justice convicted himself of having been responsible for an unconstitutional action in his capacity as Secretary of the Treasury!
The first decision caused little stir because, at the time it was delivered, it was assumed that it applied merely to contracts made before the war—the question at issue in Hepburn v. Griswold—but soon it was realized that the reasoning of the majority made the Legal Tender Acts unconstitutional also for contracts entered into after the war. To obtain a reversal of what was believed to be a disastrous decision, a drive was undertaken to get the Court to review the whole question on argument of other legal-tender cases pending on its docket. Supporters of that drive were encouraged by the fact that two vacancies on the Court had been filled sinced the decision.51 In Knox v. Lee, decided on May, 1, 1871, which gave the enlarged Court the opportunity to rule on the question, it affirmed that making greenbacks a legal tender was constitutional, reversing the earlier decision by a majority of five to four, with Chief Justice Chase as one of the dissenting justices.
The banking panic in September 1873 and the subsequent economic contraction stimulated renewed attempts to expand the greenback issue. In 1874, a bill initially designed to require specie resumption by January 1, 1876, was converted into a bill to expand the greenback issue, known as the Inflation Bill. It was passed by both Houses of Congress under Republican sponsorship, was then vetoed by President Grant, and was followed by the act of June 20, 1874, fixing the maximum greenback issue at the amount then outstanding.
The Republicans were badly beaten in the Congressional elections of 1874, losing control of the House for the first time since 1860. In the final weeks of the legislative session, before the new Congress took office, the “lame duck” Congress reversed course and passed the Resumption Act of January 14, 1875, which announced the intention to resume specie payments at the prewar parity on January 1, 1879, and authorized the Secretary of the Treasury both to use surplus revenue and to sell bonds in order to accumulate a gold reserve. At the time, the act was little more than the expression of a pious hope and, insofar as it had any contemporary effect, it was to heighten the opposition to resumption.52
The importance of the currency issue was reflected in the organization in 1875 of the Greenback party, which captured third parties formed in different states during the early seventies under various titles—Independent, Anti-Monopoly, Reform, and Farmers. Greenbackism had spread rapidly after the panic of 1873. Its goals included a plentiful supply of currency, destruction of the “money monopoly,” elimination of foreign capitalists as investors in the United States, and reduction of the burden of debt. The party adopted the view that resumption was a bankers’ conspiracy to contract the money supply, and nominated Peter Cooper for President in 1876 to run on a platform demanding unconditional repeal of the Resumption Act.53 The party got few votes—less than one per cent of the total cast for President—but greenback agitation provoked concern among business groups that had earlier favored currency expansion. Pennsylvania ironmasters, for example, reversed their views. The fortunes of the Greenback party were at a high point in the elections of 1878, when it polled about 10 per cent of the votes and won 14 seats in Congress. By 1880, denunciation of the Resumption Act was no longer a live issue; instead the party platform called for a government monopoly of paper currency and for unlimited coinage of silver. Thereafter Greenback party agitation waned, although its financial program lived on.
The much-disputed Presidential election of 1876, in which Samuel J. Tilden received a majority of the popular vote but Rutherford B. Hayes was elected President by a margin of one electoral vote, left the Republicans in command of the White House, the House with a Democratic majority, and the Senate with thirty-eight Republicans, thirty-seven Democrats, and one Independent (a Greenbacker).54 Late in 1877, the House passed a bill to repeal the Resumption Act. The bill was defeated in the Senate by one vote. This paper-thin decision turned out to be politically decisive. The subsequent act of May 31, 1878, which forbade any further retirement of greenbacks, did not alter the legal commitment to resume on January 1, 1879, though it was widely doubted at the time that the commitment could be honored.
Side-by-side with the controversy over the greenbacks and resumption, there arose, from about 1875 on, pressure to give silver a larger place in the monetary system and to establish a bimetallic rather than a gold standard. The United States had been on a nominal bimetallic standard until 1873, when silver was demonetized by the Coinage Act of 1873 (to be discussed in more detail in the following chapter). At the time, demonetization occasioned little comment, but the subsequent decline in the price of silver created a political issue about its enactment. In 1876, Congress established a monetary commission to hold hearings and report on the role of silver and related issues. The eight-man commission included three members each from the House and the Senate, and two nongovernment experts. Its majority report, submitted in 1877, favored the adoption of bimetallism but opposed greenback issues. George S. Boutwell, then Senator from Massachusetts, submitted a minority report favoring bimetallism only if international, and opposing unilateral action by the United States. Professor Francis Bowen of Harvard and Representative R. L. Gibson of Louisiana submitted a second minority report opposing bimetallism as impractical because the market ratio would diverge from the mint ratio, with the result that one or the other would in fact become the standard.55 These three reports fairly accurately represented the range of contemporary opinion.
The near-success of the “free silver” movement of the national bimetallists is discussed at length in the following chapter. The international bimetallists never matched their record. They won appropriations from Congress over the next two decades for the conduct of negotiations with foreign governments for international remonetization of silver. They organized international conferences with the hope of establishing a common set of mint ratios in the countries participating. They never came close, however, to achieving effective international monetary cooperation.
As is clear from this account, the politics of resumption was confused and contradictory. Moreover, the political measures taken bore a rather tenuous relation to the economic factors that ultimately made resumption possible, as we shall see when we discuss the economics of resumption toward the end of this chapter.
So far, we have taken for granted the movements in the stock of money. We turn now to an analysis of the factors that account for these movements.
Ever since the Civil War, the United States has had a monetary system in which hand-to-hand currency consists of specie or of fiduciary money which is a direct or indirect liability of the government,56 and deposits held by the public consist of promises to pay hand-to-hand currency on the part of fractional-reserve commercial banks. In such a system, it is useful to distinguish three major channels through which any changes in the stock of money must, as a matter of arithmetic, occur.57
1. High-powered money: The total amount of hand-to-hand currency held by the public plus vault cash plus, after 1914, deposit liabilities of the Federal Reserve System to banks. The two final items constitute bank reserves, which, in our terminology, exclude interbank deposits and before 1914 consist only of vault cash.58 This total is called high-powered money because one dollar of such money held as bank reserves may give rise to the creation of several dollars of deposits. Other things being the same (namely, the items to be specified below), any increase in the total of high-powered money involves an equal percentage increase in the stock of money.59
2. The ratio of commercial bank deposits to bank reserves: The higher this ratio, the larger the amount of deposits that is outstanding for a given amount of reserves. However, the quantitative effect on the money stock of a change in this ratio cannot be stated as simply as can the effect of a change in high-powered money because, other things being the same, any increase in the ratio of deposits to reserves tends to drain currency into public circulation and hence changes the amount of reserves. The effect of a change in this ratio is, therefore, connected with the size of the next ratio.
3. The ratio of commercial bank deposits to currency held by the public: The higher this ratio, the larger the fraction of high-powered money that will be in use as bank reserves, and hence the larger the money stock, given the other two items. The quantitative effect of a change in this ratio is connected with the size of the preceding ratio.
These three items determine the stock of money in the arithmetic sense that knowledge of their numerical values permits computation of the numerical value of the money stock.60 For this reason, we shall call them the proximate determinants of the money stock.
This particular triplet of proximate determinants is economically useful because it corresponds to a classification of more basic factors affecting the money stock into three separate and largely, though not entirely, independent sets of forces influenced by or under the control of different economic actors.
1. Under a fiduciary standard, as from 1862 to 1879, the amount of high-powered money is determined by governmental action. The government may not formulate any explicit policies with respect to high-powered money; the amount outstanding may be the net result of many other actions affecting taxes and expenditures, borrowing and repayment of debt. Yet, ultimately, government has the power to make total high-powered money anything it wishes by its decisions about how much fiduciary money to issue to the public and the banks. In this respect, the Greenback party and its predecessors were right in their emphasis on greenbacks.
As we shall see in more detail in the next chapter, a specie standard offers a sharp contrast to a fiduciary standard. Under an international specie standard, the amount of money in any one country must be whatever is necessary to maintain international balance with other countries on the same standard, and the amount of high-powered money will alter through imports and exports of specie in order to produce this result. Under a specie standard confined to a single country, or for the world as a whole under an international standard, the existing amount of specie is determined by the available physical stock plus the relative demand for monetary and other uses; and changes in the amount of specie, by relative costs of production of specie and other goods and services. In either case, the amount of high-powered money is a dependent rather than an independent variable, and is not subject to governmental determination. The flexible exchange rates between the dollar and other currencies in the greenback period cut the mechanical link between external conditions and the stock of money, and permitted high-powered money and the stock of money to be determined by domestic considerations alone. The link that remained was not mechanical but political: a governmental policy of seeking restoration of a specie standard at the prewar parity.

2. The ratio of deposits to reserves is, in the first instance, determined by the banking system—not, of course, through concerted action but through the combined effect of the actions of individual banks. Each bank may pay explicit attention to the absolute volume of its deposits and its reserves separately rather than to their ratio; and any one bank can make the volume of its reserves, at least, anything it wants within limits set only by its total assets. The situation is quite different for banks taken as a whole. The total reserves available to all together are limited by the amount of high-powered money available for banks and the public, and the share the banks can acquire will depend not only on their own actions but also on the willingness of the public to hold deposits rather than currency. What the banking system as a whole can determine is any ratio of deposits to reserves. It can achieve any ratio that is the implicit or explicit objective of its component units regardless of what the two other sets of actors—the government and the public—do. The level at which the banks will seek to maintain that ratio is linked to the government by the requirements imposed by law; and is linked to the public by the expectations of bankers about likely variations in the public’s desire to add to or withdraw deposits, which is to say, to change the ratio of deposits to currency. In addition, of course, the desired reserve ratio will be affected by the profitability of alternative uses of assets.
3. The ratio of deposits to currency is, in the first instance, determined by the public—again, not through concerted action, but through the combined effect of the actions of individual holders of money. The public as a whole cannot determine the absolute volume of either its deposits or its currency, though each individual separately can, since these will depend on the willingness of the banks to create deposits relative to their reserves and on the amount of high-powered money available. The public can determine only the ratio of its deposits to its currency. The level at which it will seek to maintain this ratio is linked to the other two sets of actors: to the government, by the legal conditions under which currency and deposits may be issued, insofar as these affect their relative desirability; and to the banks, through the terms they offer depositors, in the form of services rendered and of interest paid on deposits.
The joint determination of the two ratios reflects the necessity for the reserves and currency in their denominators to add up to the quantity of high-powered money. The terms on which banks can make loans or acquire investments, their costs of operation, and the competitive conditions they face will combine to induce them to offer some rate of interest and some free services in order to attract deposits. In response to these terms the public will seek some deposit-currency ratio. If the public’s adherence to this ratio leaves less high-powered money in the banks than the banks desire to hold under the stated conditions, banks will dispose of assets in the attempt to acquire reserves, which will reduce total deposits and thereby lead the public to hold less currency at the given deposit-currency ratio. If the deposit-currency ratio leaves more high-powered money in the banks than banks desire, banks will use the extra reserves to acquire assets which will expand deposits and thereby lead the public to hold more currency. Under equilibrium conditions, banks will have that volume of deposits and that volume of reserves which will make the marginal cost of a dollar of deposits equal to the marginal yield, as they value it, from a dollar of nonreserve assets or from a dollar of reserves, where both cost and yield include, of course, both direct and indirect costs and yields.
As these brief comments suggest, and as we hope the rest of the book will demonstrate, this framework of proximate determinants is designed to facilitate analysis of the simultaneous interaction of the various forces determining the money stock, not to separate them into watertight compartments.
Chart 4 plots the stock of money and the three proximate determinants for the period 1867–79. The most striking feature of this graph is the mild and almost horizontal movement in high-powered money up to the cyclical trough in February 1879 (the movements after the turn are considered along with the subsequent expansion, in the following chapter). The rise in the stock of money from 1867 to this trough reflected the behavior of the two deposit ratios and occurred in spite of a decline in high-powered money. From January 1867 to February 1879, high-powered money fell by 1 per cent per year. That is how fast the stock of money would have fallen if the two deposit ratios had remained the same. In fact, the stock of money rose 1.3 per cent per year. The two deposit ratios contributed about equally to the conversion of the decline in high-powered money to a rise in the stock of money.61
The impact of high-powered money is clearest from 1867 to 1868, when its decline was offset only partly by a rise in the two ratios and so produced a decline in the stock of money. For the rest of the period, high-powered money leaves less of an imprint on the stock of money than do the deposit ratios. The stock of money moves in the same direction as high-powered money only in those years when the deposit ratios do also (1870 to 1873, 1878 to 1879) or when the deposit ratios are roughly constant (1875 to 1876).
The initial decline in high-powered money from 1867 to 1870 was produced by the retirement of the miscellaneous remnants of Civil War financing, listed in Table 1 under “Other U.S. currency” held by banks and the public, and therefore reflected the final and quasi-automatic liquidation of these highly transitory wartime expedients. The rise from 1870 to 1874 was produced by roughly equal rises in national bank notes and greenbacks, and the subsequent decline, primarily by retirement of greenbacks. The fluctuations in greenbacks were partly a result of the legislative measures mentioned above—the act of 1874 that authorized additional issues, the Resumption Act that specified a limited retirement, and the act of May 1878 that suspended further retirement. But they were also partly a result of the exigencies of the Treasury’s needs and the policies of its officers that determined how much of the amount authorized was held in the Treasury. In particular, the final reduction from August 1878 to February 1879 in the greenbacks held by banks and the public resulted from an increase in the greenbacks held by the Treasury; the fixed total amount authorized remained unchanged. The fluctuations in high-powered money mirror the political struggle over greenbacks and resumption. The mildness of the fluctuations and the rough constancy of the total show how close and relatively stable was the political balance.
CHART 4
The Stock of Money and Its Proximate Determinants, 1867–79

NOTE: Shaded areas represent business contractions; unshaded areas, business expansions. SOURCE: Tables A-1 (col. 8) and B-3; monthly figures for high-powered money beginning June 1878 from same source as for Table B-3.
The balance might not have been so close, and political imperatives might have produced a very different behavior of high-powered money, if rises in the deposit ratios had not permitted a rise in the stock of money, despite the rough constancy or decline in high-powered money. These rises in the deposit ratios owed little to contemporaneous governmental action. They were linked mainly to the prior governmental measures that affected the development of the banking structure. The one appreciable exception is a change in 1874 in the provisions governing national bank notes which reduced national bank reserve requirements.
The initial rise in the deposit-currency ratio doubtless reflected the rapid spread of commercial banking and hence the greater usefulness of bank deposits. The tapering off of the rise from 1872 to 1874 probably helped to produce and then was intensified by the banking difficulties in 1873, which culminated in the banking panic of September, set off by the failure of a number of banking houses. The most important house that failed was Jay Cooke and Company, which had become nationally famous through its role in pioneering the widespread public distribution of government bonds during the Civil War. Annual data are too crude to reveal accurately the reaction to such an episode. In general, however, any widespread banking difficulties that weaken the public’s confidence in banks can be expected to be followed by a fall in the ratio of deposits to currency, as the public seeks to convert the one into the other, and this is quite clearly what happened after subsequent episodes for which we have monthly data. The decline after 1876 may very well have a similar explanation. In 1877–78, there was a notable increase in commercial bank suspensions.
The rise in the deposit-reserve ratio from 1867 to 1873 reflects partly a rise in the ratio for national banks, partly a sharp increase in the relative importance of nonnational banks measured by their share of total reserves. Though the ratio for nonnational banks was roughly constant, it was, throughout, two to four times as high as the ratio for national banks, hence an increase in the relative importance of nonnational banks tended to raise the average ratio for both groups combined. The ratio for national banks roughly doubled, from 2.0 to 3.8, their deposits rising 12.5 per cent, and their reserves falling 41 per cent. This change was presumably part of the maturation of national banks. As their rapid growth tapered off and they were able to adjust to their experience, they found it possible and profitable to operate with a smaller volume of reserves relative to their deposits. The much higher ratio for nonnational than for national banks reflected mainly differences in the legal reserve requirements to which each was subject. As of 1879, only six states had legal reserve requirements against deposits, and only three required total reserves as large as those specified in the National Banking Act.62 From 1867 to 1873 the share of total bank reserves held by nonnational banks rose from 13 to 33 per cent. Of the two factors producing the rise in the deposit ratio from 1867 to 1873, the rise in the ratio for national banks was somewhat more important quantitatively than the rise in the relative importance of nonnational banks.
The sharp decline in the deposit-reserve ratio from 1873 to 1874 is almost surely a response to the banking panic of 1873. In its initial stages such a panic is accompanied by a reduction in bank reserves as the public seeks to convert deposits into currency, which by itself would make for a rise in the deposit-reserve ratio. But banks very quickly seek to strengthen themselves by acquiring greater liquid resources and succeed in doing so, so that their reserves generally rise relative to their deposits shortly after a panic. For some time thereafter, their reserves generally remain at a higher level than one would expect from earlier experience. For example, from 1873 to 1874, banks absorbed an increase in high-powered money plus the currency released by a decline in the public’s holdings, while deposits decreased slightly.
The sharp rise in the deposit-reserve ratio from 1874 to 1875 is no doubt partly a reaction to the prior search for liquidity on the part of the banks. But it probably owes more to a change in the provisions of the law governing the issue of national bank notes. Before 1874, national banks were required to apply the legally specified reserve percentages to the sum of their deposits and note circulation; thereafter, only to their deposits. This reduction in legal reserve requirements led the banks to raise the deposit-reserve ratio to a new and higher level after 1874 than they had maintained earlier.
The decline in the deposit-reserve ratio after February 1877 was an indirect consequence of the banking suspensions referred to earlier. These were concentrated among nonnational banks, and were accompanied by a decline in the relative importance of deposits in such banks which, as we have seen, would tend to lower the average ratio for all banks because of the high deposit-reserve ratio of nonnational banks. In addition, the suspensions induced nonnational banks to achieve greater liquidity and so led to a decline in their deposit-reserve ratio.
To summarize: The sharp rise in the stock of money from 1868 to 1872 was primarily a consequence of the spread of deposit banking. This both induced the public to hold a larger ratio of deposits to currency and enabled the banking system to create more dollars of deposits per dollar of vault cash. The decline in the stock of money from 1877 to 1879 was primarily a consequence of a series of nonnational bank failures that produced a reverse movement in these ratios. The monetary authorities contributed to and lengthened both the rise and the decline in the money stock: the first, by an increase in high-powered money that began in 1870 and continued to 1874; the second, by a decline in high-powered money that began in 1874. In addition the monetary authorities were entirely responsible for the initial decline in the money stock from 1867 to 1868.
From 1862 to 1879, gold was a commodity in the domestic economy. But it was also more than a commodity: for external and some internal purposes it was a second species of money; and it was recognized as the legitimate, if temporarily dethroned, sovereign. In consequence, special monetary significance attached to its price, or the premium on gold, as the difference between its market price in greenbacks and its prewar nominal monetary value was always referred to in a community that regarded any such differences as a temporary hang-over from wartime.
The key to understanding the behavior of the premium on gold during the greenback period is that the price of gold was to all intents and purposes the dollar-pound exchange rate. It was therefore determined by the forces underlying the international balance of payments, and its movements reflected changes in those forces: the comparative advantage of the United States (the northern states during the war) and the outside world in various lines of production; the relative price levels in the U.S. and the outside world; and movements of capital between the U.S. and the outside world. These are not the forces stressed by either contemporary or most subsequent writers. They have tended rather to stress the shifting expectations about the prospect of eventual redemption of the greenbacks in gold. Those expectations certainly played a role but not as a factor in addition to the ones just listed. Such shifting expectations could affect the price of gold only as they affected the demand for or supply of foreign exchange; for example, by producing a greater or lesser willingness on the part of foreigners to hold assets whose value was fixed in terms of greenbacks, or on the part of U.S. citizens to hold assets fixed in terms of foreign currencies.
At the outbreak of the Civil War, the price of the pound sterling in terms of the dollar varied in a narrow interval around $4.86. This was the price that the U.S. Treasury was willing to pay or receive for the amount of gold for which the Bank of England would pay or receive one pound sterling; it was, that is, the mint par.63 The interval about the mint par was determined by the cost of exporting or importing gold; these determined the so-called gold points. Any tendency of the exchange rate to move outside this range would lead to the import or export of gold and set in motion the classical gold standard adjustment mechanism involving both capital movements and changes in prices and incomes in the U.S. and the rest of the world.
The unwillingness or inability of the United States to permit the adjustments required to keep the exchange rate within the former gold points made departure from the gold standard inevitable.64 Once the U.S. went off gold in 1862, the exchange rate was free to move outside these limits and, of course, did so. The dollar depreciated, which meant that the greenback price of the pound rose and hence so did the greenback price of gold, since the pound price of gold was fixed within gold points by the Bank of England’s buying and selling rates. Thereafter, until resumption in 1879, the exchange rate—and hence the premium on gold—was determined by the demand for and supply of foreign exchange.65
We stress the identity of the premium on gold with the exchange rate because there has been so much confusion and misunderstanding about the relation between changes in the domestic demand for and supply of gold and changes in the premium on gold. Because gold was primarily a commodity for internal purposes and not money, there is a temptation to try to explain variations in its price by changes in its domestic demand and supply conditions—to analyze its price as one would analyze house rents or the price of bricks. This approach is wrong, not primarily because it treats gold as a commodity, but because it treats gold as a domestic commodity rather than an internationally traded commodity. Like many another internationally traded commodity, the domestic stock of gold was small relative to the world stock. Hence, as for such other commodities, changes in domestic demand and supply had a negligible effect on its value in terms of internationally traded goods. This value depended on world demand and supply, and world demand was mostly for monetary use.
Further, since the British maintained the gold standard, changes in domestic demand for or supply of gold had no effect at all on its price in terms of sterling—except within the narrow limits set by the British official buying and selling prices of gold. They affected the greenback price of gold only insofar as they affected the pound-dollar exchange rate. In this respect, such changes were strictly on a par with changes in the supply of any other export or in the demand for any other import. They had special significance because, and only because, gold was a U.S. export. An increase in the quantity of U.S. wheat exported, for example, had exactly the same effect on the greenback price of gold as an increase in the quantity of U.S. gold exported of equal value in pounds sterling. The only feature not shared by other internationally traded goods was that gold was one form in which it was convenient to hold foreign exchange. In consequence, a change in the demand for or supply of foreign exchange for capital or speculative purposes often took the form of an offer to buy or sell gold. In these cases, gold was the medium through which speculative forces affecting international capital movements expressed themselves.
The demand for and supply of foreign exchange, which determined the exchange rate, reflected the U.S. demand for goods and services from abroad, the supply of goods and services in the United States for export, the demand abroad for U.S. goods and services, the supply abroad of goods and services for export to the United States, the desire of foreigners to transfer capital or make unilateral transfers to the United States, and of U.S. residents to transfer capital or make unilateral transfers abroad. Each of these in its turn was critically dependent on the relative level of internal prices at home and abroad. A doubling of the internal price level in the United States, for example, with no change in internal prices within Britain would make U.S. goods twice as expensive in Britain at any given exchange rate and so reduce the amount the British would desire to import from the United States. It would make British goods half as expensive in the U.S. relative to domestic goods and so increase the amount the U.S. desired to import from Britain. It would mean that a given number of dollars transferred by immigrants, for example, to their families abroad would constitute only half as large a fraction of the immigrants’ wages and so would tend to increase the amount sent. Conversely, it would mean that a given number of pounds sterling intended for capital investment in the United States would buy only half as much physical capital while still commanding an unchanged amount at home and so would discourage capital investment in the U.S. And so on, for other items in the balance of payments. A simultaneous doubling of the greenback price of sterling would exactly offset these effects and leave the real amounts demanded and supplied unchanged. Other things being the same, the exchange rate would tend to vary with relative internal prices—this is the famous purchasing-power parity theory of exchange rates. Of course, other things were not the same during the greenback period and, as we shall see, they produced significant deviations from the changes in exchange rates that would have been strictly in accord with changes in purchasing-power parity. However, as in most periods of widely varying prices, the relative movement of internal price levels in the United States and in gold-standard countries was, far and away, the most important factor affecting exchange rates with the currencies of such countries and hence the premium on gold.66
In order to see how much of the movement in the greenback price of gold can be accounted for by movements in relative price levels, we have approximated purchasing-power parity by the ratio of the Warren-Pearson wholesale price index for the United States to the Sauerbeck wholesale price index for Great Britain. The ratio was adjusted so that the average value of the resulting purchasing-power parities for the period 1861 through 1879 would equal the average value of the actual price of gold in terms of greenbacks for the same period.67 The resulting purchasing-power parity price of gold is plotted along with the actual price of gold in the lower part of Chart 5, and the ratio of the actual price to the hypothetical price in the upper part.68
We use Britain as the basis of comparison primarily because of its importance in U.S. trade, and partly also because it was the only major country that was on gold throughout the period. For the years 1861–78, over one-third of U.S. imports came from Britain and over one-half of U.S. exports went to Britain.69 The area under the gold standard widened notably during the greenback period: Germany adopted gold in 1871— 73; the Latin Monetary Union (France, Italy, Belgium, Switzerland), in 1873–74; the Scandinavian Union (Denmark, Norway, and Sweden) and the Netherlands, in 1875–76; and this list is not exhaustive, though it does include the major changes.70
It is clear from Chart 5 that movements in relative price levels account for the greater part of the movement in the price of gold. Whereas the price of gold varies over a range of more than 2 to 1, the ratio of the actual to the hypothetical price varies over a range of only 1.3 to 1. To some extent, this residual variation may reflect the crudeness of our calculation of purchasing-power parity. It seems most unlikely, however, that it can be wholly accounted for by such statistical errors.71
CHART 5
Actual and Hypothetical Purchasing-Power Parity Price of Gold in Greenbacks, 1861–79

SOURCE: Price of gold in greenbacks, Mitchell, Gold, Prices, and Wages, p. 4.
Purchasing-power parity price of gold, U.S. wholesale price index, in greenbacks, for all commodities (from Historical Statistics, 1949, p. 232, Series L-2), was divided by Sauerbeck’s index of wholesale commodity prices in Great Britain (from Sauerbeck, “Prices of Commodities,” p. 648). The quotient was converted to the base 1861–79 = 100 and multiplied by 124.57, the average price of gold in greenbacks in the period.
There are two major discrepancies between the actual and the hypothetical purchasing-power parity price of gold: the relatively high actual price of gold during the Civil War itself, and the relatively low actual price of gold from then through 1871. Both are readily accounted for.
1861–64
Before the Civil War, cotton was the United States’ major export commodity and it alone accounted for something like one-half the total value of merchandise exports. The typical pattern of trade was that the North had a deficit abroad and a surplus in trade with the South, the South had a surplus abroad and a deficit in trade with the North. The war cut off almost wholly the foreign exchange that the North had formerly received indirectly from cotton exports without curtailing to any similar extent its demand for imports. The war therefore left the North with an exchange deficit at the former exchange rate and relative price levels.72
Under a gold standard and stable foreign prices, the result would have been internal deflation produced by an outflow of gold. Under the actual fiduciary standard, the result was a greater rise in the price of gold (i.e., the price of foreign exchange) than in domestic prices. Indeed, it seems remarkable that so sizable a decline in the supply of goods for export produced a rise of only about 20 per cent at most in the ratio of the price of gold to its purchasing-power parity, especially when political attitudes of the ruling groups in England were on the whole unfavorable to the North and so inhibited foreign loans.73 Part of the explanation may well be that we underestimate the extent of the depreciation because of defects in the price indexes.74 But correction for even a substantial understatement would not change the general tenor of the results.
One possible explanation for a relatively small exchange depreciation is that suspension reduced domestic monetary demand for gold and so added to the supply of goods for export, offsetting to some extent the loss of cotton. However, the recorded figures do not support this explanation. They show no sustained rise in gold exports over prewar levels.75 Apparently, the small depreciation reflected, rather, a combination of highly elastic demands for and supplies of commodity imports and exports and an elastic supply of capital.
The role played by capital movements is particularly interesting, because of the light it throws on both the behavior of interest rates during the war and the character of speculative capital movements under floating exchange rates. A capital inflow might have been induced in either of two ways: first, by high interest rates in the United States; second, by an expectation that the price of gold in terms of greenbacks, which is to say, the price of foreign exchange, would fall, thereby making it profitable for foreigners to hold greenback funds.
It is clear from Chart 6 that interest rates could hardly have been an attracting force during the Civil War. On the contrary, yields on railroad bonds fell from the end of 1861 to early 1863, and were decidedly lower throughout 1863 and 1864 than either before or after the Civil War. Call loan rates (not shown on this chart) show a slight rise in 1863 and 1864, but even so these rates were not at an unprecedentedly high level. Government bond yields are more difficult to describe because of the ambiguity about whether to regard the bonds as gold bonds, as they ultimately turned out to be, or as bonds whose principal at least and perhaps interest coupon as well would be paid in greenbacks, as was widely anticipated at the time. We shall return to them subsequently. For the moment, it will suffice to note that if regarded as greenback bonds, their yields, too, were relatively low.
CHART 6
Bond Yields in Gold and Greenbacks, and Price of Gold in Greenbacks, Monthly, 1861–78

See opposite page for notes.
The relevant consideration for capital movements is not the absolute level of interest rates in the United States but the difference between U.S. rates and foreign interest rates. However, examination of British rates does not alter the picture just drawn. Long-term rates in London were stable or, if anything, rising over the period; they certainly show no decided fall such as would have been required to make the American capital market more attractive relative to the London market than it had been earlier.76
The behavior of interest rates in the United States is one of the most interesting features of the Civil War period and has puzzled most of its historians,77 A priori, one might expect the rapid rise in prices during the Civil War—a more than doubling of prices within less than four years—to have produced, after some lag, a substantial rise in money interest rates as lenders sought to protect themselves against inflation, and as borrowers were willing to pay higher rates in the expectation of further inflation. In addition, the government was acquiring a large fraction of the nation’s resources for war purposes and was financing the great bulk of the corresponding expenditures by borrowing rather than by either explicit taxation or the taxation implicit in money creation. The resulting demand for loan funds must surely have been larger than any private demand that was suppressed by the diversion of resources to war use. Surely, the combination of these forces might have been expected to produce a substantial rise in interest rates. Yet interest rates were unusually low.
Notes to Chart 6.
SOURCE: Price of gold in greenbacks, same as for Chart 5.
Currency yield on railroad bends, F. R. Macaulay, The Movements of Interest Rates, Bond Yields, and Stock Prices in the United States since 1856, New York, NBER, 1938, pp. A143-A147; all bonds in the index in those years were currency bonds.
Currency yield on U.S. bonds of 1881, from quarterly yield tables, using averages of monthly high and low prices in Annual Report of the Comptroller of the Currency, 1902, pp. 129–131. June 1, 1881, maturity was used through July 1861, June 30 thereafter, maturity date for bulk of issue authorized at that time.
Gold yield on U.S. bonds of 1881, same, except that the monthly average price of the bond was divided by the monthly average price of gold in greenbacks. A nomograph was used instead of yield tables for part of the period.
Far from explaining the capital movements, the level of interest rates is, in our view, itself explained by speculative capital movements induced by the rise in the greenback price of gold, i.e., the depreciation in the foreign exchange value of the dollar. Such a depreciation can have very different effects according to the expectations about future exchange rates that it generates. If an initial rise in the greenback price of gold had produced expectations of further rises, the result would have been to establish an incentive to convert greenbacks into gold or foreign exchange in order to benefit from the subsequently higher price. On the other hand, if a rise in the greenback price of gold produced an expectation of a return to an earlier level, if the emphasis was on the fact that the price was high rather than that it was rising, the result would be to establish an incentive to convert gold or foreign exchange into greenback funds in order to benefit from the subsequently lower price of gold. It seems likely that the latter kind of expectation was generated and hence that the rise in the greenback price of gold produced speculative capital inflows, which helped to finance a deficit in the balance of trade and which explain why the depreciation in the exchange value of the dollar, over and beyond that to be expected from purchasing-power parity, was so mild—given the drastic change in the North’s international trade position. Such capital inflows would also have constituted a demand for U.S. securities, which explains why interest rates were so low despite the rise in commodity prices and the extensive government borrowing.
A strong piece of indirect evidence favoring this interpretation is the movement of the yield on railroad bonds. A foreigner who expected the greenback price of gold to be lower at a later date had an incentive to convert assets which were fixed in terms of gold-standard currencies into assets fixed in greenbacks. He could have done so by selling his assets for foreign currencies, using the foreign currencies to buy gold in, say, New York, and the gold to buy greenbacks. But there was no necessity for him to keep the proceeds in cash or as deposits in commercial banks. It was more profitable to acquire assets such as railroad bonds which paid a much higher rate of interest than he could earn on bank deposits. He could then sell these and use the proceeds to repurchase gold or foreign exchange when and if his expectations were realized and the price of gold fell.78 An inflow of speculative capital induced by an expectation of a subsequent fall in the price of gold, therefore, constituted a demand for U.S. securities and tended to raise their prices and depress their yields; an outflow of speculative capital had the opposite effects. Insofar as expectations about the future price of gold were linked to the level rather than the direction of change of the price of gold, this factor would tend to produce an inverse relation between the greenback price of gold and the yield on, say, railroad bonds. As Chart 6 shows, this is precisely the relationship that prevailed throughout the war, and, to a much lesser extent, some years thereafter. The greenback price of gold reached its peak in July 1864 and the yield on railroad bonds, its trough in the same month; and the lesser ups and downs in the greenback price of gold left an equally clear impress on the yield of railroad bonds. Moreover, this interpretation is also consistent with the different behavior of short-and long-term interest rates from mid-1862 to mid-1864, the period of the rise in the greenback price of gold. Call money and commercial paper rates were rising during that period, as might have been expected from the concurrent inflation and the large government borrowing. At the same time, yields on railroad bonds and currency yields on government bonds were falling, which would be understandable if they were the means used for investing speculative funds, but hardly otherwise.
As already noted, U.S. government bonds raise a special problem. As we have seen, both interest and principal were in fact paid in gold. If this outcome had been completely anticipated at the time, the greenback prices of government bonds should have fully reflected the premium on gold. For example, consider the 6 per cent U.S. coupon bonds of 1881.79Suppose the market is pricing comparable greenback bonds to yield 6 per cent, i.e., a $100 bond with a 6 per cent coupon is priced at $100 in greenbacks. Then an equivalent price for the government bond would be $100 in gold since this would mean a yield of $6 in gold. The greenback price of the government bond would then be 100 times the greenback price of gold. If, for example, the price of gold in greenbacks is $1.50, then the price of the government bond would be $150 in greenbacks. This bond would yield $6 in gold, worth $9 in greenbacks; hence its current yield would be 6 per cent whether calculated in gold or greenbacks.80 Under these circumstances, government bonds would have been useless as a means of speculating on a future fall in the price of gold. Holding government bonds would have been equivalent to holding gold, not to holding greenbacks.
If the actual situation had conformed to that described, the market gold yield on government bonds (i.e., the yield calculated by expressing interest, the final principal payment, and the current market price all in gold) would have roughly approximated the market greenback yield on comparable securities with interest and principal payable in greenbacks.81 But, in fact, the gold yield deviated widely from greenback yields. At the peak of the premium on gold, when railroad bonds were yielding less than 6 per cent, the gold yield on the 6 per cent government bonds of 1881 exceeded 16 per cent. Throughout the period from 1862 to about 1866 or 1867 the gold yield fluctuated in strict accordance with the premium on gold whereas, under the conditions of the preceding paragraph, it would have been entirely independent of the premium. It tended to become increasingly independent of the premium after 1867, as expectations that payments would be in gold grew stronger (see Chart 6).
The explanation, of course, is that during the war and for some time thereafter there was little confidence that the government would in fact pay principal and interest in gold.82 The bonds were being treated as if they were predominantly paper bonds. There is no easy way to compute the market yield under those expectations. Since current interest coupons were being paid in gold, investors must surely have had different expectations for coupon payments in the near future and for coupon and principal payments in the distant future. The extreme is to suppose that, at the time of purchase, investors expected the very next coupon and all future coupons and principal payments to be in greenbacks, i.e., that they treated the bond as a greenback security. The yield calculated on this assumption must have been below the yield expected by purchasers when they bought the securities. Yet Chart 6 shows that the yield so calculated was only slightly below the yield on railroad greenback bonds in 1863— 64. The actual situation in these years must therefore have been very close indeed to the extreme. But this means that government bonds were as good a vehicle for speculating in gold as were securities that were explicitly greenback obligations.
The fall in the price of gold in 1864–65 narrowed the difference between the gold and currency yields on government bonds. The accompanying shift in expectations about the payment of government bonds in gold is reflected in the relation of those two yields to the currency yield on railroad bonds. As we have seen, until late 1864, the currency yield on government bonds was only slightly lower than the currency yield on railroad bonds. After 1864, as expectations shifted, the yield on railroad bonds rose markedly above the currency yield on government bonds and settled at a level only slightly below the gold yields on government bonds. As Republican victory became certain in 1868, on a platform that promised repayment of bonds in specie, the gold yield on government bonds dropped sharply relative to the currency yield on railroad bonds, the two coming together just about election time. After the turn of the year, and more especially after the act of March 18, 1869, pledging repayment in specie, gold yields on government bonds fell increasingly below currency yields on railroad bonds. After about 1867, the currency yield on government bonds began to move inversely to the premium on gold, just as the gold yields had earlier moved in the same direction.
CHART 7
U.S. Net International Capital Movement and Purchasing-Power Parity, 1861–79

NOTE: Capital movement is in gold values. Capital inflow is plotted as plus.
SOURCE: Ratio, same as for Chart 5. Capital movement, Graham, “International Trade,” p. 231; Simon, “The United States Balance of Payments, 1861–1900,” Table 27, line 30.
The indirect evidence from bond yields is largely supported by such direct evidence as exists on capital inflows. The evidence based on capital movements for fiscal 1863 is mixed. Though the dollar depreciated and interest rates fell during most of the year, estimates of capital flows by Frank Graham show a capital outflow that persisted from the preceding year. (See Chart 7, which gives two estimates of U.S. net international capital inflows or outflows and also the ratio of the actual price of gold to the purchasing-power parity price. This ratio is plotted invertedly—compare Chart 5—to make its expected movements in the same direction as that of capital inflows, for easier reading of the chart.) Later estimates by Matthew Simon, however, show a small capital inflow in fiscal 1863, which is consistent with our interpretation of the premium on gold and of interest rate movements. Simon’s estimate, moreover, is supported by direct evidence that, as early as February 1863, Dutch bankers began small-scale purchases of Union securities. Both estimates of capital movements agree that there was a substantial increase in capital inflows from the year ending June 30, 1863, to the year ending June 30, 1864. Since fiscal 1864 corresponded with the greatest depreciation of the dollar, that increase in capital inflows is consistent with our interpretation. Dutch and German investors were heavy net purchasers in that year of U.S. government bonds and to a lesser extent of railroad bonds payable in greenbacks.83 The victories of Grant, Sherman, and Sheridan in late 1864, which seemed to herald a swift end of the war and the complete defeat of the Confederacy, must have greatly stimulated the willingness of these and other investors to acquire greenback assets despite the rapid rise in the premium on gold in 1864, which otherwise might well have produced expectations of still further rises. Simon reports that these events were particularly important in restoring the attractiveness of the Union as an outlet for investment to English investors, who had been antagonistic to the North during the conflict. These capital inflows provided the North with needed foreign exchange, long before victory and reconstruction again made available the proceeds from cotton.
If this analysis is correct, the depreciation of the exchange rate manifested in the rise in the greenback price of gold contributed to resolving the North’s balance of payment difficulties in two very different ways: by affecting the “real” terms of trade and so fostering exports and discouraging imports; by stimulating a speculative inflow of capital, which limited the depreciation, holding it to only some 20 per cent in excess of that required to compensate for internal price level changes, and kept the terms of trade from turning even more strongly against the North.
It is interesting to note that a very similar sequence of events accompanied the early stages of German inflation after World War I.84 As the mark depreciated, foreigners at first were persuaded that it would subsequently appreciate and so bought a large volume of mark assets, which helped to keep the mark at a higher value in terms of foreign currency than purchasing-power parity would have dictated. The capital inflow provided a substantial volume of resources to Germany. As the German inflation went on, expectations were reversed, the inflow of capital was replaced by an outflow, and the mark depreciated more rapidly than purchasing-power parity would have dictated. The difference, of course, is that, in the Civil War, the speculators were ultimately correct and their speculation in retrospect was “stabilizing”; in Germany, they were ultimately wrong and so their speculation was “destabilizing.” But this is a retrospective judgment. As of, say, late 1864 in the one case and late 1922 in the other, it would have been far more difficult to predict that the outcomes would prove so different.
1865–71
Capital continued to flow in after the war ended, capital seeking permanent investment presumably replacing in part the speculative capital that had been attracted by the high premium on gold. In addition, the end of the war meant an improvement in the supply of exports relative to imports, as the South was once again integrated into the Union economically. The result was a sharp shift in the price of gold relative to purchasing-power parity from a level some 20 per cent above purchasing-power parity to a level some 10 per cent below. This appreciation of some 30 per cent in the exchange value of the greenback dollar is a measure of the pressure that the wartime disturbance of trade relations had imposed on the balance of payments.
The price of gold remained some 10 per cent below the hypothetical purchasing-power parity in 1865–71, producing the second major discrepancy noted above, and then rose relative to purchasing-power parity until 1873, after which it fluctuated around the purchasing-power parity. As Graham has documented in an excellent analysis of the movement of the premium from the end of the war to resumption,85 the relatively low price of gold—which is to say, high value of the greenback dollar—from 1865 through 1871 can be attributed to the capital inflow from abroad. During that period foreign investors initially bought government bonds in preference to railroad securities, then about 1870 shifted to the latter.86The shift reflected the decreasing relative attractiveness of government bonds, which were bid up by banks because of the demand for them as collateral for national bank notes and government deposits, and which no longer were useful for holding funds in expectation of a fall in the greenback price of gold since they had become gold bonds in fact as well as in name. As Chart 6 shows, the currency yield on railroad bonds moved permanently above the gold yield on the government bond early in 1869, and maintained a 2 percentage point gap from late 1870 on. The decline in European-held U.S. government debt that began at that time continued for a decade as a result of refunding operations of the government, and of a trans-Atlantic movement of those securities here for replacement by the more lucrative railroad bonds.87
The subsequent depreciation of the dollar from 1871 to 1873 is something of a puzzle, since both Graham’s estimates and Simon’s more recent ones in general show a high level of capital inflows up to 1873. A plausible explanation is that the depreciation resulted from a combination of a domestic boom, which raised the demand for imports sharply, and a poor cotton crop in 1871, which reduced the supply of exports.88Since these phenomena were temporary, they may have been met partly by depreciation and partly by a temporary accommodating short-term capital inflow. An influx of short-term foreign capital, extended in the form of call loans in the stock market and sterling loans in the New York money market, was in fact reported, beginning in the summer of 1872 and continuing through September 1873.89
The persistence of the lower value of the dollar after 1873, like the higher value from 1865 to 1871, is readily attributable to capital movements. Capital inflows declined drastically after 1873 and were soon replaced by net outflows, according to both sets of estimates. If the preceding explanation of the 1871–73 movements is correct, the decline reflected partly the necessity of repaying the temporary accommodating short-term capital advances of those years. The decline in capital inflows reflected also the widening financial difficulties of railroads and the default of some roads on their obligations. These contributed importantly to banking failures that set off the financial panic of 1873.90 In its turn, one consequence of the panic was to intensify the difficulties of the railroads.
If this period offers any problem of interpretation, it is why the dollar did not depreciate to a still lower level in view of the exceedingly adverse capital movement. One possible explanation, which, however, we have not tested, is that rapid agricultural and industrial growth during the Civil War and in the following decade had improved the competitive position of the United States in exports more than it had expanded its demand for imports, which is to say, had increased the demand for U.S. dollars by foreigners (to buy U.S. exports) more than it had increased the demand for foreign currency by U.S. residents (to buy imports). The effect of such a shift in comparative advantage would be to raise the value of U.S. currency in terms of foreign currencies at which trade would balance. To put this explanation in terms of Chart 7, it implies that the price of gold relative to purchasing-power parity that might be expected to prevail in the absence of capital movements would be declining over time, or in terms of the inverted scale of that chart, would be represented by a rising curve. Deviations from such a curve, rather than from the horizontal line in the chart, are then the appropriate magnitudes to compare with capital movements. For the last few years, at least, such deviations would clearly be more highly correlated with the capital movements than deviations from the horizontal line would be. Chart 9 in Chapter 3, showing the relation between relative prices and capital movements for a much longer period, supports this interpretation, since over the whole period the level of U.S. prices relative to foreign prices that is consistent with any given capital movement tends to rise.
Just as for any other export commodity with a fixed world price whose domestic price therefore varies with the exchange rate, the relatively high price of gold in greenbacks during the Civil War might be expected to have encouraged its production, the relatively low price from 1865 to 1871 to have discouraged it, and the higher price thereafter to have encouraged it again. And this is roughly what happened, although with a sizable lag, due partly to conditions of production, partly to the isolation of California from the rest of the country. From a trough of 1.9 million ounces in 1862, output rose to a peak of 2.6 million ounces in 1866, then declined erratically to a trough of 1.6 million ounces in 1875, then rose sharply to a peak of 2.5 million ounces in 1878.
Net exports of gold followed a rather different pattern. From 1862 to 1876, they varied erratically from year to year around a level roughly that which had prevailed in the decade before the war, then declined drastically in 1877 and became negative in 1878 and 1879. During the final years of the greenback period, therefore, production was increasing but exports decreasing.
The movements of gold exports resulted primarily from changes in the demand for gold for domestic purposes. The short-term year-to-year fluctuations from 1862 to 1876 must largely reflect short-term movements in foreign trade and, therefore, in short-term balances of foreign exchange or their equivalent. The shift that took place in 1877, on the other hand, undoubtedly reflects a change in the monetary situation. So long as resumption of payments was in the indefinite future, the main incentive to hold gold was either to speculate on its value or to acquire the equivalent of foreign exchange to pay for imports. As we pointed out in section 1 (the role of gold), the latter was undoubtedly the primary motive for holding gold.91 The demonetization of gold must therefore have led to an initial reduction in the demand for it. The consequent export of existing stocks of gold allowed total exports of gold to remain relatively constant, despite the decline in production, and so prevented the decline in production from putting still further pressure on the greenback price of gold. Once resumption of specie payments was likely at a reasonably close date, gold became a more attractive way to hold domestic funds, and there was probably an increase in demand for it for this purpose on private account. In addition, as we shall see, the Treasury entered the market on a large scale after 1877 to accumulate gold. The combined effect of the increase in demand for gold on the part of the public and the Treasury was to reduce exports of gold drastically and to raise the greenback price of gold relative to purchasing-power parity.92
One of the most interesting questions about the period is the relative importance of various factors in permitting the successful resumption of specie payments at the pre-Civil War parity in 1879. The earlier sections of this chapter provide the factual and analytical basis for an answer to this question. It is only necessary to select the relevant elements.
As we have seen, before the Civil War the exchange rate between the U.S. dollar and the British pound varied around $4.86 within a narrow interval determined by the costs of shipping gold. From 1862 on, the exchange rate was not so limited and did, of course, move far outside these limits. It was determined, as explained in the first pages of section 5, by the demand for and supply of foreign exchange, and there were no legal commitments on the part of the United States that prevented it from taking any value that was necessary to balance international payments. The essential requirement for a return to the prewar parity was that the exchange rate so determined be within the initial range determined by the gold points. An attempt to return to the prewar parity before the greenback price of the pound sterling had fallen to that level would have meant a “pound shortage” strictly comparable with the post-World War II “dollar shortage” associated with the maintenance by other countries of official exchange rates that overvalued their own currencies. And since exchange controls and the associated restrictions on imports and exports that contained the post-World War II dollar shortage had not yet been invented—or perhaps one should say perfected—in the greenback period, the “pound shortage” would have meant a loss of gold at a rate that would have forced renewed suspension.
The factors determining the exchange rate between the dollar and the pound sterling were numerous and complex. It is clear, however, from the discussion of the premium on gold in the first part of section 5, that the most important factor, once the Civil War was over, was the movement of internal prices in the United States relative to prices in gold-standard countries which we may represent by the most important among them, Great Britain. As a first approximation, therefore, the major requirement for resumption was that prices in the United States in greenbacks bear about the same relation to prices in Britain in pounds sterling as U.S. prices did before suspension, say, in 1861. Prices in Great Britain were 15 per cent lower in 1879 than in 1861, as measured by Sauerbeck’s wholesale price index.93 Wholesale prices in the United States, to judge from the Warren-Pearson monthly index, reached their peak in August-September 1864, and an only slightly lower peak in January 1865—at both peaks being 2½ times the average level in 1861. And for 1865 as a whole they averaged just a little over twice the 1861 level. In order for resumption to be achieved at the prewar parity, therefore, prices had to fall to less than half of their 1865 level. And this is, of course, what they did: the price index averaged 185 (with 1910–14 = 100) for 1865; it was 86 in December 1878, and 87 in January 1879, or about 3 per cent less than its average value in 1861.
We have seen in section 2, above, that the drastic and sustained price decline occurred, despite a mild rise in the stock of money, because of an exceedingly rapid rise in output, with perhaps a mild assist from a fall in velocity, i.e., an increase in the demand for money per unit of output. The primary factor producing the decline in prices that made resumption possible was, therefore, the rapid growth in real income—the economy grew up to its money stock.94
Specie resumption was throughout a major political objective, and the question whether the government was proceeding toward this objective too rapidly or too slowly was a major political issue, as we saw in section 3, which perhaps reached its peak in the controversy about the Resumption Act of 1875. It is therefore of interest to note that this account of the factors explaining successful resumption assigns government action only a minor, if nonetheless crucial, supporting role. Government action may have contributed to the rapid expansion of output through its policies on sale of public land, land grants to railroads, and other similar measures which contributed to the expansion of the West. But such government action was not of the kind that anyone at the time or since would have regarded as explicitly directed toward achieving resumption.
Government action had mixed effects on the mild rate of growth of the money stock. On the one hand, federal and state legislation laid the foundation for the rapid growth of commercial banking—after 1867, particularly by state banks—that, as we have seen, produced rises in the ratios of deposits to reserves and of deposits to currency for most of the period after the Civil War. In addition, the elimination of reserve requirements against national bank notes in 1874 liberated reserves that encouraged a rise in the deposit-reserve ratio. The rises in the deposit ratios tended to increase the money stock, and thereby to inhibit price declines and to postpone the achievement of the prerequisites for successful resumption. On the other hand, the government did succeed in bringing about a minor reduction in the stock of high-powered money, mostly through use of government surpluses and debt refunding operations to retire “other United States currency” from 1865 to 1869, and it thereby helped offset to a limited extent the effect of the rises in the deposit ratios.
In view of the recurrent political pressures to expand the greenback issues—to which the government in fact yielded in 1873–74—and the political difficulty then as now of obtaining budget surpluses to retire debt, the achievement of even a minor decline in high-powered money was by no means a negligible accomplishment.95 But it was an accomplishment of omission, as it were, not of commission.
Interestingly enough, the decline in the stock of money in the last few years before resumption, which helped foster the particularly rapid price decline of those years, owed less, as we have seen, to any Treasury action under the influence of the Resumption Act than to the decline in the two deposit ratios, a decline that we have attributed to a rise in bank suspensions.
In 1877–79, the Treasury refunded about half the average outstanding interest-bearing public debt, to take advantage of lower rates of interest. For foreign holders of securities, calls of old bonds were so timed that one collection of securities was replaced by another or, if offsetting sales of new bonds were not possible, surplus from current account was available to pay for old bonds retired without export of U.S. gold. In fact, during those years, the United States was a net importer of over $5 million in gold, despite a repatriation of over $300 million of U.S. government securities by foreigners.96
Both before and immediately after resumption, the Treasury in its refunding operations went to great lengths to avoid the introduction of even temporary disturbances of any magnitude in the foreign exchange market. Here again, a mishandling of the operations might have interfered with resumption, so the Treasury deserves much credit.
The Resumption Act of 1875 itself, like the rest of governmental actions, had mixed effects on the achievement of resumption. Little was done under the act until John Sherman became Secretary of the Treasury in March 1877 and began serious attempts to accumulate a specie reserve. The act, and the borrowing and accumulation of a specie reserve under its provisions, had three effects, working in different directions, on resumption.
1. Insofar as the act and the specie reserve instilled confidence in the prospective maintenance of specie payments, it inhibited either a speculative withdrawal of funds from the United States or a speculative accumulation of specie, and enhanced the willingness of foreigners to hold U.S. dollar balances. Had there been no Resumption Act, repatriation by foreigners of U.S. securities in 1876–78 might well have been even greater than it actually was. More important, by setting a definite exchange rate that was to be attained and a definite date at which it was to be attained, the act offered those speculators with confidence that the government would in fact succeed in achieving these aims an incentive to proceed so as to achieve the specified exchange rate at an earlier date and to hold it there. In fact, the monthly average premium on gold dropped below 2 per cent by March 1878 and never thereafter rose above that level. This effect clearly favored resumption.
2. The sale of bonds was an open market operation. If the bonds had been sold for domestic currency and the proceeds added to the currency holdings of the Treasury, the effect, as of any other open market sale, would have been to reduce the high-powered money base of the monetary system and so enforce monetary contraction. In fact, the bonds were sold not for currency but for gold. The sale of bonds at home for gold was equivalent to selling bonds for greenbacks and then using the proceeds to purchase gold. In a nongold system, the purchase of gold with currency newly issued or taken from the currency holdings of the monetary authorities is an open market purchase that is expansionary in its monetary effect. The sale of bonds for gold thus had the effect of an open market purchase combined with an equivalent open market sale, the two together leaving the total monetary base unaffected. In practice, although gold was not the legal standard, it was, as we have noted, used for monetary purposes alongside greenbacks. In consequence, insofar as the gold purchased came from gold held for monetary purposes by either the domestic public or the domestic banks, it did, in the first instance, reduce the reserve basis of the system. However, the banks and others could always replace gold holdings, if they so wished, by purchasing gold or its equivalent, sterling, in the free market at home or abroad, and in fact, that is what happened. The increase in the Treasury’s gold reserves was not appreciably at the expense of the high-powered money holdings of the public or the banks.97 Hence this consideration does not alter the conclusion that the sale of bonds for gold either at home or abroad was essentially neutral in its effects on the monetary base. It does mean that the operation might affect the gold premium in the manner noted in point 3, which follows.
3. Since gold was the equivalent of foreign exchange, the Treasury’s purchase of gold constituted an increase in the demand for foreign exchange.98 Insofar as it borrowed abroad resources that would otherwise not have been available for loans to this country, it increased the supply correspondingly. But some of its borrowing abroad must surely have been at the expense of other lending to this country (lending was going on even though the net capital movement from this country was outward); to that extent, the supply was increased less than the demand even by foreign borrowing. Borrowing at home had this effect to an even greater extent. By borrowing at home, the Treasury acquired resources that would have been used in other ways, some of which might have involved a demand for foreign exchange. At most, however, only part of the resources would have been used to purchase foreign exchange, whereas the Treasury used all of them in this way. The result of the greater increase in demand than in supply was to make the greenback price of sterling higher than it otherwise would have been. This effect therefore made resumption more difficult; it required, that is, a decline in domestic prices sufficient not only to balance foreign payments on current account at the desired exchange rate but also to produce a large enough surplus to finance the accumulation of the specie reserve. Whether the Resumption Act on balance hindered or helped resumption therefore depends on whether this effect was more or less important than the effects on confidence and speculation.
Whatever the conclusion on this score, the cessation of government borrowing to build up a gold reserve, once resumption had taken place, removed a source of pressure on the exchange rate and permitted domestic prices to rise sharply immediately after resumption without producing balance-of-payment problems, as we shall see in more detail in the next chapter.
If this account makes the successful achievement of resumption on the date specified in the Resumption Act appear to be pure coincidence, two considerations may make this result seem less surprising. (1) The date was not set until the premium had already fallen to roughly one-tenth of its peak level, so most of the adjustment required for resumption had already taken place. (2) Numerous studies suggest that there is considerable leeway in the balance of payments, so long as there is reasonable confidence in the maintenance of an official exchange rate—that speculation and accommodating capital movements grant time for adjustment. This meant that the conditions for successful resumption were not a razor’s edge but a broad band. Resumption might well have been successful a year or more earlier than the date set and certainly could have occurred later.
From 1862 to 1879, there was no official link between the U.S. dollar and gold, and hence no fixed parity between U.S. currency and the pound sterling, which was throughout rigidly linked to gold. The price of gold in terms of greenbacks was in effect the dollar price of sterling.
The average monthly price of gold, hence of sterling, varied widely over the period, reaching a peak in 1864 of over $2.50 in greenbacks for the amount of gold that had been worth a dollar before the war. This corresponded to a price of more than $12 per pound sterling, or two and one-half times the prior and subsequent parity of $4.86. The price of gold and sterling then declined irregularly to parity by the time of resumption on January 1, 1879. The changes in the price of gold were produced primarily by changes in relative prices of goods and services in the U.S. and abroad, and these in turn mainly by changes in U.S. prices. Wholesale prices more than doubled during the Civil War and then fell irregularly over the next fifteen years to their initial level. The price decline was a necessary condition for successful resumption at prewar parity.
During the Civil War, the dollar depreciated by a greater amount (i.e., the dollar price of sterling rose by more) than can be explained by commodity price movements alone. The explanation is the severing of the links that had connected the South, the North, and the rest of the world: the South exporting cotton and using part of the proceeds to import from the North, which in turn used its surplus with the South to pay for goods from abroad. The foreign exchange loss to the North was partly made up by a speculative inflow of capital from abroad in the expectation of a subsequent appreciation of the dollar. As a result, the depreciation in excess of that attributable to price level changes was only about 20 per cent. The speculative capital inflow contributed also to unusually low rates of interest in 1863 and 1864.
For some five or six years after the Civil War, the dollar price of sterling was less than might have been expected from commodity price movements alone. The explanation is a sizable capital inflow from abroad for investment—up to 1870, particularly in U.S. government securities, and after that, in railroad bonds. When the capital inflow declined sharply, as it did in 1873–79, the dollar price of sterling first rose by comparison with the ratio of U.S. to British prices, then moved in accord with that ratio.
The initial price rise in the United States during the Civil War accompanied a sizable increase in the stock of money as a result of the issuance of greenbacks and other forms of legal tender to help pay for governmental expenditures, and the associated expansion in bank deposits. Unfortunately, we have no satisfactory data on the stock of money corresponding to either the wartime price rise or to the immediate postwar decline. Our continuous series begins only in 1867, by which time prices had already declined by more than 25 per cent from their wartime peak.
From January 1867 to February 1879, the date for which we have an estimate of the stock of money closest to the date of resumption, the stock rose 17 per cent or at the annual rate of 1.1 per cent per year. Most of the rise occurred from 1870 to 1872. From 1875 on, the money stock actually declined. Prices show a comparable pattern: they actually rose from 1871 to early 1873, and fell most sharply from 1876 to 1879. The behavior of the money stock was unusual by subsequent standards; the rise was unusually small for so long a period, and the number of years of actual decline was unusually large. However, as in later periods, the rate of rise tended to decelerate well before a cyclical peak and to accelerate well before a cyclical trough.
The reason for the small rise in the money stock was the virtual constancy from 1868 to 1878 in the amount of high-powered money—the sum of currency held by the public plus the reserves held by banks in the form of cash in vault. This total first decreased shortly after the Civil War, as a result of the retirement of emergency governmental legal-tender obligations, then varied about a constant level in response to the closely balanced political controversy that raged about resumption, greenbacks, and silver. Not until after resumption was a settled fact did controversy about its desirability cease and then only to be replaced by the silver issue.
The initial constancy in high-powered money was converted into a rise in the total stock of money by a rise in the number of dollars of deposits held by the public per dollar of their currency holdings and also a rise in the number of dollars of deposits created by banks per dollar of their vault cash holdings. The rise in the deposit-currency ratio probably reflected the spread of commercial banking. The rise in the deposit-reserve ratio reflected the combined effect of a near-doubling of the ratio for national banks and a sharp increase in the relative importance of nonnational banks with a ratio higher than that of national banks. The rise in both deposit ratios was concentrated in the years up to 1873; both fell somewhat after 1875, which is why the stock of money shows the same pattern.
The mild rise in the stock of money was converted into a sharp decline in prices by a rapid rise in output. We cannot measure this rise in output at all accurately. The only available comprehensive measure—net national product in constant prices—begins in 1869 and there is strong reason to believe that the available estimates seriously overestimate the rate of growth of output during the subsequent decade. But there is much evidence that, while the growth of output was not so phenomenal as the net national product estimates alone would suggest, it was very rapid indeed.
The inadequacies of income estimates preclude any firm conclusion about velocity. The available data show a slight rise from 1869 to 1879. More accurate estimates would probably show a decline but we cannot say by how much.
The period from 1873 to 1878 or 1879 is of especial interest. Contemporary observers regarded these years as a period of marked “depression and disturbance of industry.”99 The National Bureau dates a reference peak in October 1873 and a trough in March 1879, making this the longest contraction in the U.S. record, and there is little doubt that these dates correspond to the qualitative impressions of contemporary observers. Yet if the evidence from physical-volume series can be believed, at least the later years of that contraction were years of expanding output. In terms of output measures alone, the trough may have come not later than 1877.
The obvious explanation for the apparent contradiction is the behavior of prices, which unquestionably fell sharply from 1877 to early 1879, and the continuing state of monetary uncertainty up to the successful achievement of resumption. The contraction was long and it was severe—of that there is no doubt. But the sharp decline in financial magnitudes, so much more obvious and so much better documented than the behavior of a host of poorly measured physical magnitudes, may well have led contemporary observers and later students to overestimate the severity of the contraction and perhaps even its length. Observers of the business scene then, no less than their modern descendants, took it for granted that sharply declining prices were incompatible with sharply rising output. The period deserves much more study than it has received precisely because it seems to run sharply counter to such strongly held views.
1 One possible exception is the refunding of Civil War debt at lower rates of interest by the Treasury in 1877–79 (see sect. 5, below).
2 During banking panics, currency and deposits have for brief periods sometimes constituted dual monies exchanging at a fluctuating rate (see Chaps. 3 and 4).
3 See Bray Hammond, “The North’s Empty Purse,” American Historical Review, Oct. 1961, pp. 8–11, for a discussion of the three-part program adopted to finance the Civil War, which included greenback issues, taxes, and borrowings, the latter “to be facilitated by a national system of banks whose demand would greatly enlarge the market for government bonds.” Many of the ideas embodied in the National Banking Act were copies of features of the New York free banking system established in 1838, and the Massachusetts Banking Act of 1858. See Fritz Redlich, The Molding of American Banking, New York, Hafner, 1951, Vol. II, Part II, pp. 99–105.
See also Simon Newcomb’s penetrating criticism of and vigorous attack on the establishment of the National Banking System as a means of contributing to the financing of the war (A Critical Examination of Our Financial Policy during the Southern Rebellion, New York, Appleton, 1865, pp. 199–222). His little book contains the most sophisticated, original, and profound analysis of the theoretical issues involved in Civil War finance that we have encountered, regardless of date of publication.
4 For a more extended discussion, see Appendix B.
5 This requirement was later reduced to 100 per cent: the act of Mar. 14, 1900, entitled national banks to receive circulating notes from the Comptroller of the Currency equal in amount to the par value of bonds deposited.
6 The 5 per cent redemption fund was introduced in the act of June 20, 1874, which freed national banks from the requirement previously in effect to maintain reserves against their circulation.
7 The aggregate issue of national bank notes was originally restricted to $300 million. The limit was raised to $354 million by the act of July 12, 1870. The Resumption Act of 1875 eliminated this restriction altogether.
8 In early 1873, New York City national banks sold national bank notes at a discount for greenbacks (Commercial and Financial Chronicle, Jan. 18, 1873, quoted by O. M. W. Sprague, History of Crises Under the National Banking System, National Monetary Commission, GPO, 1910, p. 29).
The reason was that the seasonal movement of currency from the interior to New York at the time included a large fraction of national bank notes issued by country banks. These notes were less useful to New York City national banks than greenbacks were because of two institutional arrangements then in effect: (1) The rules of the New York Clearing House, unlike those of clearing houses in other cities, required settlement of deficits in lawful money. (2) Before 1874, national bank notes were redeemable only at the issuing bank’s counter or at the counter of its designated redemption agent—in a reserve city or in New York—with which it kept deposits to satisfy legal reserve requirements.
New York City banks could have redeemed the notes of issuing banks for which they were redemption agents simply by canceling deposits of those banks equal to the dollar value of the notes retired, a course, which Sprague argues, the New York banks “might have been reasonably expected to resort to” on occasion. Such redemption would have reduced required reserves of New York banks, thereby releasing 25 cents of lawful money for each dollar of notes redeemed. Redemption in this way, however, would have entailed loss of legal reserves to the issuing banks, with the onus upon their city correspondents, so there seems nothing unreasonable in the decision of the New York banks to avoid such action. Instead, they sold the notes to brokers at one-quarter of 1 per cent discount—the brokers reselling them to country banks at one-eighth of 1 per cent discount—and obtained greenbacks in payment.
It is not clear whether the discount on national bank notes occurred regularly before the change in redemption procedures in 1874, or whether it was unusual. James Buell, president of a New York City national bank, testified in Feb. 1874 that the city banks refused to receive national bank notes for deposit when they became “redundant,” but “there is not … chronic difference in value between the national currency and greenbacks.” He referred to a premium of “two, three, and four per cent” on greenbacks “during the panic [Sept. 1873]; since then, nothing” (see his Statement to the Committee on Banking and Currency of the House of Representatives, Feb. 9, 1874, reprinted from the official report, New York, 1879, pp. 5–9). Sprague described “the currency premium” that resulted from the banks’ refusal to maintain convertibility of deposits and currency during Sept. and Oct. 1873, as applying equally to both greenbacks and national bank notes. Oct. 22 is the last date for which he presented quotations. A note attached to the quotation for that date states: “Bank notes at par.”
After the change in redemption procedures in June 1874, national bank notes were always redeemable at par at the Treasury. The Treasury paid out lawful money from funds each national bank deposited with it for redemption purposes in amounts equal to at least 5 per cent of that bank’s circulation. Since the 5 per cent fund also counted as part of the reserves required against deposits, a bank’s reserves were reduced, of course, by redemption of its notes. An issuing bank, however, had no way of identifying banks that returned its notes to the Treasury for redemption; hence its New York City correspondents could do so with impunity.
Writing in the 1880’s, C. B. Patten, cashier of a Boston national bank, stated: “The National bank bill is redeemable at a central bureau in Washington—and over the counter of the issuing bank—in lawful money …; their market value is therefore the same as the legal tender Treasury note,” i.e., greenback {The Methods and Machinery of Practical Banking, 7th ed., New York, Bradford Rhodes, 1896, p. 37).
9 See also the discussion in Phillip Cagan’s forthcoming monograph on the determinants and effects of changes in the money stock in the United States since 1875, a National Bureau study. The remarks in the text about the profit on note issue are based on Cagan’s calculations. He expresses the rate of return as the ratio of the income from the bonds securing the notes minus the expenses of note issue to the bank’s capital tied up in acquiring the bonds. Capital tied up is simply the difference between the market price of the bond and the amount of notes issued on the basis of it. The Comptroller of the Currency on the other hand treated the capital tied up as equal to the full market price of the bond (see his Annual Report, 1873, p. xxxiii, and subsequent reports), a procedure which yields much lower rates of return, and his procedure was adopted by others. See Report of the Monetary Commission of the Indianapolis Convention, University of Chicago Press, 1898, pp. 186–196; J. Laurence Laughlin, Money and Prices, New York, Scribner, 1924, pp. 239–245 and 270–271. Laughlin’s calculation treats the face value of the bond as the amount of capital tied up, and deducts the excess of the market price over the face value of the bond from “loanable circulation.” Both the Comptroller and Laughlin compare the interest earned on the bond, plus the interest on lending the circulation at, say, 6 per cent, minus the expenses of note issue, with the amount that the tied-up capital, as each defined it, would yield if directly loaned at 6 per cent. Laughlin’s calculation would yield the same net figure as the Comptroller’s except that he also deducts from “loanable circulation” the 5 per cent redemption fund on notes deposited with the Treasury by issuing banks, and so obtains lower rates of return, than does the Comptroller. Since this fund counted as part of the required reserves against deposits, there is no need to consider it in calculating the return on note issues.
In testifying before the House Committee on Banking and Currency in Dec. 1894, Secretary of the Treasury Carlisle cited low profit figures on note issue computed according to the Comptroller’s method. His method would show profits of between $6.52 and $7.83 per $100 of market prices of bonds deposited to secure circulation, profits that were compared to $6.00 said to be available from lending $100 of the tied-up capital directly. According to Cagan’s calculations for that year, the return on note issue was 9.2 per cent compared to 4.2 per cent earned on other assets. Bankers testifying before the House Committee followed the Comptroller. The president of a New Haven national bank asserted that the bank’s $50,000 circulation “is not worth one stiver to us.” The president of a Buffalo, N.Y., state bank said that his bank kept its state charter not out of sentiment but “because there is no profit in the national bank system.” Carlisle summed up the prevailing view: “It is well known, of course, that the profits of the circulation of a national bank constitute a very small item of the total profits of the institution.” See National Currency and Banking System, Report and Hearings before the House Committee on Banking and Currency, Dec. 1894, H. Rept. 1508, 53d Cong., 3d sess., Report, pp. 7–9; Hearings, pp. 49, 154, 176.
Either bankers did not recognize a profitable course of action simply because the net return was expressed as a percentage of the wrong base, which is hard to accept, or we have overlooked some costs of bank note issue that appeared large to them, which seems much more probable.
10 From Jan. 1868 through Feb. 1873 our figures for other U.S. currency include “three per cent certificates,” an obligation created to retire “compound-interest notes,” both of which national banks were authorized to count as part of their lawful money holdings. Compound-interest notes were a legal tender while three per cent certificates were not.
11 “By the act of Mar. 3, 1863, the Secretary of the Treasury was empowered to issue gold certificates not in excess of 20 per cent above the amount of gold left on deposit with him as cover for these certificates. First issued in Nov. 1865, the certificates were a convenience to customs officers, the Treasurer, banks, and traders on the New York Gold Exchange. In 1878, when preparations for resumption were under way, Secretary Sherman halted their issue. An act of July 12, 1882, authorized the issue of gold certificates which were simply warehouse receipts.
It is not certain that the certificates issued from 1865 on were in fact partly fiduciary rather than simply warehouse receipts. To judge by figures shown in the Annual Report of the Secretary of the Treasury, 1928, pp. 550 and 554, the amount of gold held in trust by the Treasury against gold certificates, at June dates, 1866–82, was always equal to the value of gold certificates outside the Treasury.
It is curious that Mitchell does not refer to the authorization to issue gold certificates in his description of the act of Mar. 3, 1863 (W. C. Mitchell, A History of the Greenbacks, University of Chicago Press, 1903, pp. 110–118). He discusses (pp. 225–226) a futile attempt by Secretary Chase in 1864, when the Treasury’s gold receipts from customs duties exceeded its requirements for meeting the interest on the public debt, to sell gold certificates to importers for greenbacks at a rate a trifle below the current premium. These sales were made under the authority of a joint resolution of Congress. The market refused to recognize different quotations on gold coin and gold certificates, and the attempt was abandoned.
12 J. G. Brown, A Hundred Years of Merchant Banking, New York, privately printed, 1909, pp. 281–282; A. H. Cole, “Evolution of the Foreign Exchange Market of the United States,” Journal of Economic and Business History, May 1929, pp. 417–418.
13 Cole (see footnote 12), pp. 414–415, judges from the fact cable transfers are first mentioned in the Commercial and Financial Chronicle in 1879 that they were not used until then and remarks that exchange dealers were surprisingly slow in adopting cable communication. It seems incredible that there should have been such a long delay, and two nineteenth-century writers confirm that there was not. Henry Clews (Fifty Years in Wall Street, New York, Irving Publishing Company, 1908, p. 508) referred to transmission by cable of London quotations from August 1866 on, and Henry M. Field (The Story of the Atlantic Telegraph, New York, Scribner, 1893, p. 391), to the commercial revolution the cable wrought in this country within the space of a few months—“Lombard Street and Wall Street talked with each other as two neighbors across the way.”
14 There is one minor exception of a 6 per cent bond that paid currency interest and accounted for one per cent of the long-term debt of the government in 1867.
Beginning with suspension, legislation authorizing government borrowing specified whether payment of interest would be in “coin.” Coin as used in these laws was then understood to mean gold, although later the word gave rise to much controversy. Greenback advocates argued that since the bonds specified only that the interest be paid in gold, the government could pay the principal in greenbacks. To allay any doubts in investors’ minds on this score, the “public credit act” of Mar. 18, 1869, declared the purpose of the U.S. to pay its notes and bonds in coin or the equivalent, pledging the faith of the nation to such payment. Silver proponents thereupon claimed that payment in silver rather than gold would satisfy the legal commitment to pay in coin (see Joseph Dorfman, The Economic Mind in American Civilization, New York, Viking, 1949, Vol. III, pp. 4–20).
15 Mitchell noted that a “specific contract act” was passed in California in 1863 providing that contracts for the payment of specific kinds of money should be enforceable. “Greenbacks were not prevented from circulating, but when they were passed it was usually at their gold, not at their nominal, value” (Mitchell, A History of the Greenbacks, p. 144).
16 As this example illustrates, Gresham’s law, that cheap money drives out dear money, applies only when there is a fixed rate of exchange between the two. It therefore explains how greenbacks drove out subsidiary silver and required the introduction of fractional currency, since subsidiary silver retained its monetary usefulness only so long as it exchanged at its nominal value—which means a fixed rate of exchange between it and greenbacks. Once the market value of silver exceeded its monetary value, silver could still have stayed in circulation, as gold could and did, by being accepted at its market rather than its nominal value, but this clearly would have rendered it useless for its initial purpose of facilitating transactions of low value.
Gresham’s law is often misunderstood and therefore misused, especially when it is applied by analogy in nonmonetary contexts, because the requirement that there be a fixed rate of exchange is forgotten.
17 The 1873 Annual Report of the Comptroller of the Currency gives a breakdown of gold assets and liabilities, as well as currency assets and liabilities, of New York national banks on Oct. 3, 1872, and on Sept. 3, 1873. The special deposits of those banks payable in gold on those two dates are $6,171,000 and $12,102,000, respectively, and the gold coin held by those banks, $6,375,000 and $14,586,000, respectively. This amounts to approximately $1 in gold for $1 in gold deposits.
Banks could legally count gold as reserves against greenback deposits as well as gold deposits, but they had no incentive to hold them for that purpose alone. Why hold an amount of gold worth more than a dollar in greenbacks when a dollar in greenbacks would do as well? This is the reason that the bulk of the gold held by the banks was apparently held by New York banks, which also had the bulk of the gold deposits.
Given that gold was held as a reserve against gold deposits, it was also, of course, counted as legal reserves in reports to the Comptroller of the Currency, since the statements of the national banks and the enforcement of legal reserve requirements, like most monetary statistics for the period, all proceeded on the fiction that a dollar is a dollar for all that. Hence, a bank that was legally required to hold, say, a 25 per cent reserve, had no excess legal reserves, and received an additional gold deposit of $100, in nominal value had to add to its legal reserves an amount equal to $25 in nominal value, either in greenbacks or their equivalent or in gold.
The following hypothetical example will illustrate how holding $1 in gold for each $1 in gold deposits would be compatible with fractional reserve banking. Suppose a bank in New York City subject to a 25 per cent legal reserve ratio and with no excess legal reserves received a $100 gold deposit. Its required reserves would be raised by $25 in nominal value, which it could hold either in greenbacks or gold. Suppose it held it in gold. This leaves $75 in gold in excess of legal requirements. Suppose it used this $75 to replace $75 of greenbacks formerly held as reserves against other deposits, and used the greenbacks so liberated to buy interest-earning assets. At a premium on gold of, say, 37½ per cent these operations, evaluated in terms of the market value in greenbacks of assets and liabilities, involved adding $137.50 to its deposits, $62.50 to its reserve funds (the market value of the $100 in gold minus the $75 of greenbacks taken from reserves), and $75 to its interest-earning assets. This is fractional reserve banking for gold deposits as well as greenback deposits, though with a higher reserve ratio (in our example 62.50/137.50 or 45.5 per cent), yet it involves holding gold equal in value to the deposit liabilities payable in gold.
One reason it might have been sensible for the banks to proceed in roughly this way was that there were few legally permitted investments that were in gold dollars. Loans payable in gold to New York City national banks represented 55 and 36 per cent, respectively, of the banks’ special deposits payable in gold on the dates in 1872 and 1873 for which gold assets and liabilities of these banks are shown. To the extent that the demand for gold loans was limited, the only way the banks could protect themselves against differential changes in the value of their assets and liabilities as a result of changes in the gold premium was by holding gold itself.
18 The risk involved in holding balances in the one form or the other depends on the liabilities in connection with which the balances are held. If the liabilities were in gold, then any risk of a change in the premium could be hedged by holding gold balances.
19 The existence of two kinds of money would presumably increase, other things being the same, the money balances people would want to hold, i.e., would tend to make the velocity of the combined money total lower than if all elements of the money stock were perfect substitutes. To some unknown extent, this effect offsets the statistical error of counting the two kinds of money at their nominal values.
20 In making this count, we compared Feb. of one year with Feb. of the preceding year for the period 1879 to 1881; Feb. 1881 with June 1882; June with June, for the period 1882 to 1906 for which we have only one observation a year; and Dec. with Dec. thereafter. We assumed that the Dec. figure for 1906, which we do not have, would have been higher than the recorded Dec. figure for 1907. We treated 1926 as a year of no change.
21 The exceptions are: Aug. 1926-Dec. 1926, a decline of 1.2 per cent; Jan. 1948-Nov. 1949, a decline of 1.3 per cent; and Sept. 1959-June 1960, a decline of 1.1 per cent. In the two world wars, sharp one-and two-month declines also occurred during bond drives, which occasioned transfers from private deposit accounts to government war loan accounts. Payments by the government to the public subsequently reduced government deposits and restored private deposit accounts.
22 “The detailed timing of peaks and troughs in the rate of change in the money stock is presented in our forthcoming “Trends and Cycles.” We note there that, before the Oct. 1873 peak in business, there are no turns in the rate of change series to match with three earlier turns in business that fall in the period covered by our money series: the business trough of Dec. 1867, peak of June 1869, and trough of Dec. 1870. The absence of a turn in the rate of change series to match with the Dec. 1867 business trough may simply result from the fact that our series does not go back far enough in time. For the other two business turns, we conjecture that the annual data for successive Januarys—all we have for that period—may conceal by their crudeness turns that monthly data would reveal.
23 Calculated from the average Warren-Pearson index number for the first quarters of 1865 and 1879 (see source notes toChart 62).
24 “The indexes of wholesale prices that have been carried back into years before 1890 are almost inevitably overweighted with farm products” (Wesley C. Mitchell, What Happens During Business Cycles: A Progress Report, New York, NBER, 1951, p. 270).
25 The Hoover consumer price index for all items declines at the rate of 3.1 per cent per year from 1867 to 1879. The group index for clothing shows the greatest decline (4.7 per cent per year), followed by the fuel and light group index (3.5 per cent per year) and food (3.3 per cent per year). Rent declined 0.8 per cent per year, services and other items, 0.6 per cent per year (Ethel D. Hoover, “Retail Prices After 1850,” Trends in the American Economy in the Nineteenth Century, Studies in Income and Wealth, Vol. 24, Princeton for NBER, 1960, p. 143).
Over the same period the Snyder-Tucker annual index of the general price level declines at the rate of 3.5 per cent per year; the Federal Reserve Bank of New York cost-of-living index number, which for this period is based on Mitchell’s index in Gold, Prices, and Wages Under the Greenback Standard (University of California Press, 1908), p. 91, at the rate of 2.1 per cent per year (Historical Statistics of the United States, 1789–1947, Bureau of the Census, 1949, Series L-l, p. 231; L-36, p. 235).
However, because based on annual figures, these indexes understate the rate of decline from Jan. 1867 to Feb. 1879. We can make a rough correction by noting that the annual version of the Warren-Pearson monthly index number plotted in Chart 3 declines at the annual rate of 4.9 per cent per year from 1867 to 1879. This compares with a 5.4 per cent per year decline from Jan. 1867 to Feb. 1879. We have used the ratio of 5.4 to 4.9 to raise the rates of change for the aggregate indexes cited in this footnote to those given in the text.
26 See Milton Friedman, “Monetary Data and National Income Estimates,” Economic Development and Cultural Change, Apr. 1961, pp. 277, 279–280.
27 According to p. 277, ibid., cyclical factors would have made the 1879 velocity 4.6 per cent less than its trend value. According to Table 1, p. 278, ibid., the 1867 value could be expected to be 3.1 per cent below trend. Therefore, the different cyclical position would account for a decline over the interim at the rate of 1.5/12 = .125 per cent per year.
Special factors associated with this period point in different directions with respect to velocity. (1) The shift from a period of rising prices, as during the Civil War, to falling prices, as after it, means a reduction in the cost of holding money, since in the first case, money depreciates in purchasing power, whereas in the second, it appreciates. This might be expected to lower velocity. However, a continuation of a given rate of decline in prices, while a reason for a low velocity, is not a reason for a falling velocity, once adaptation is made to it. Adaptation can be expected to be gradual and might not have been completed in 1867, in which case this would be a reason for a further decline in velocity. (2) Prices fell less rapidly after 1867 than before which, for the preceding reasons, would work in the direction of a higher velocity. (3) The spread of the money economy, relative to production by families for their own use, might have been proceeding more rapidly than later, which would be a reason for a decline in velocity. (4) Uncertainty about the monetary standard might be a reason for a rise in velocity.
It is not easy to see any reason these factors should have produced a significant departure from the later trend.
28 Historical Statistics, 1949, Series K-l, p. 200.
29 Historical Statistics, 1949, Series K-168 and -169, p. 218.
30 Most of the rest of this section is based on Friedman, “Monetary Data and National Income Estimates,” pp. 273–282.
31 “For the early years of the period, 1869–1888, the derived annual series, even for the comprehensive aggregates—gross and net national product—did not seem sufficiently reliable as annual measures to warrant their presentation. For the next twenty years, 1889–1908, acceptable annual estimates could be derived only for the broader aggregates—national product, capital formation, and flow of goods to consumers.
“For the specific uses of our study of secular trends in capital formation and financing these annual estimates are of interest only as raw material in the calculation of five-year or more complicated moving averages which serve to cancel the short-term fluctuations while revealing the underlying secular movements and any longer swings in them with sufficient accuracy” (Simon Kuznets, Capital in the American Economy: Its Formation and Financing, Princeton for NBER, 1961, pp. 534 and 535).
See also two other works by Kuznets: National Product Since 1869, New York, NBER, 1946, especially pp. 59–90; and “Long-Term Changes in the National Income of the United States of America Since 1870,” Income and Wealth of the United States: Trends and Structure, Income and Wealth, Series II, Cambridge, Eng., Bowes and Bowes, 1952, especially pp. 34–38.
32 “Kuznets, “Long-Term Changes,” p. 37.
33 “Quotation from “Long-Term Changes,” p. 37; see also, William H. Shaw, Value of Commodity Output Since 1869, New York, NBER, 1947.
34 Kuznets, “Long-Term Changes,” p. 38.
35 Because of the important role played by the decennial censuses in the construction of the estimates, the estimates for census years like 1869 and 1879 are presumably considerably more reliable and involve less interpolation than other individual years.
36 One other study covering this period also shows very rapid growth in output. According to Gallman’s estimates of commodity output, the decennial percentage rate of change in output per capita from 1869 to 1879 was higher than in the two pre-Civil War decades, and was exceeded only from 1879 to 1889 during the nineteenth century and from 1919 to 1929 and 1939 to 1949 during the twentieth century (Robert E. Gallman, “Commodity Output, 1839–1899,” Trends in the American Economy in the Nineteenth Century, Studies in Income and Wealth, Vol. 24, Princeton for NBER, 1960, pp. 16, 19).
On the other hand, the evidence in A. F. Burns, Production Trends in the United States Since 1870 (New York, NBER, 1934) suggests that the decade of the seventies was one of average rather than of unusually rapid growth. The medians of the trend cycles of all four of the comprehensive groups of production series he examined are close to the exponential curves fitted to their decade percentage rates of growth, three being slightly above and one slightly below (p. 181).
37 The details of these estimates are given in Friedman, “Monetary Data and National Income Estimates,” pp. 273–280.
38 The negligible exception is that the 1878 and 1879 net national product figures determine the velocity figures for the first two years of the cycle 1878–85, which is one of the 12 cycles averaged in computing the cyclical component for mild depression cycles.
39 Velocity for this decade falls at a more rapid rate than would be expected from the indicated rate of increase of real income.
40 Rendigs Fels (American Business Cycles, 1865–1897, University of North Carolina Press, 1959, pp. 107–108) presents evidence in support of our view.
It should perhaps be noted explicitly that our account begs the crucial analytical question. Did the rapid rise in output occur despite the relatively constant stock of money per capita, and hence despite the necessity for the rise in output per capita to be manifested in falling prices? Or was the relatively constant stock of money per capita one of the factors accounting for the rapid rise in output per capita, so that a more expansionary monetary environment would have meant a slower rise in output per capita? Or do both of these overestimate the influence of monetary factors, so that the factors determining the rate of growth were largely independent of monetary influences?
The tendency of modern economic thinking would clearly favor the first interpretation. Yet recent empirical evidence now available for both the United States and Great Britain is mixed. Kuznets’ figures for the United States give no clear indication whether output per capita grew more or less rapidly during the generally deflationary period before 1896 than during the generally inflationary period thereafter; the result obtained depends critically on the particular initial and terminal years used for comparison (see Chap. 3 below). According to available estimates of income per head in constant prices for the United Kingdom, the deflationary period was characterized by a definitely higher rate of growth than the later inflationary period. (See James B. Jefferys and Dorothy Walters, “National Income and Expenditure of the United Kingdom, 1870–1952,” Income and Wealth, Series V, Cambridge, Eng., Bowes and Bowes, 1955, Tables III and XVI. These national income estimates are based on A. R. Prest, “National Income of the United Kingdom, 1870–1946,” Economic Journal, Mar. 1948, pp. 58–59.)
41 The National Bureau reference peak is Oct. 1873. However, considerable evidence places the date of the peak some months earlier, which is why our statement about the timing relation between the peak and the panic cannot be precise. We are indebted to Clark Warburton for calling this point to our attention. See also Fels, American Business Cycles, pp. 98–99.
42 See the annual data for physical-volume series in Historical Statistics of the United States, Colonial Times to 1957, Bureau of the Census, 1960 [Historical Statistics, 1960], pp. 357, 360–361, 366–368, 370, 415–417, 428, 448, 451, 455, and ibid., 1949, pp. 149, 218; also the annual data in Burns, Production Trends, pp. 288 ff.
The evidence on the behavior of construction during the business contraction is mixed. Construction in current prices, as measured by Kuznets, shows a slight decline, 1875–78; in constant prices, it shows virtually continuous mild growth. On the other hand, building permit data, both in dollar value and in numbers, show a marked decline in the later seventies. Number of miles built of railroads reached a trough in 1875, rebounded in 1876, declined again in 1877, and then turned up in 1878 and 1879. Gross capital expenditures for plant and equipment of regulated public utilities (mainly railroads in the 1870’s), in current prices, reached a trough in 1876 and rose only slightly thereafter; in constant prices they reached a trough in 1875 and then rose more strongly than the current prices series. Moses Abramovitz concludes that the foregoing evidence and other series he has examined definitely establish a retardation in growth of construction activity in the seventies and suggest that a decline in absolute level of construction activity may have occurred (see his “Evidences of Long Swings in Aggregate Construction Since the Civil War,” a National Bureau study, in preparation).
The severe decline in monetary series from 1873 to 1879 is beyond question: prices, clearings, railway revenues, value of imports. It is the behavior of these series which has largely colored the description of the contraction. A. R. Eckler (“A Measure of the Severity of Depressions, 1873–1932,” Review of Economic Statistics, May 1933, p. 79) described 1873–79 as severe mainly because of the three monetary series he used in addition to two physical-volume series and a sixth, which is not clearly one or the other. David A. Wells (Recent Economic Changes, New York, Appleton, 1889) regarded the whole period 1873–89 as characterized by “a most curious and, in many respects, unprecedented disturbance and depression of trade” (p. 1). Yet a detailed reading of his comments makes it clear that the decline in prices was the feature that Wells emphasized, and indeed that he attributed the decline in prices to an enormous expansion in both the capacity to produce goods and actual production (for example, see comments on pp. 11, 12, 25, 49, 62, 82, 338, 432).
How much of the indisputable discontent during the contraction reflected decline in wage rates rather than increase in unemployment, it is impossible to say. In 1878, Carroll D. Wright, chief of the Massachusetts Bureau of Labor estimated unemployment in the entire country at less than a half-million, although current estimates by presumably less qualified observers were as high as three million (Samuel Rezneck, “Distress, Relief, and Discontent in the United States During the Depression of 1873–78,” Journal of Political Economy, Dec. 1950, p. 498). The labor disturbances of 1877 were provoked by a series of wage cuts and introduction of laborsaving devices.
43 See Charles F. Dunbar, Economic Essays, New York, 1904, p. 213; Dorfman, The Economic Mind, Vol. Ill, pp. 15–18. However, it may have been recognized that, since greenbacks were also usable for bank reserves, an increase in greenbacks would encourage deposit expansion as well.
44 Annual Report on the Finances, 1865, p. 4,
45 See Mitchell, A History of the Greenbacks, p. 128.
46 R. P. Sharkey, Money, Class, and Party, Baltimore, Johns Hopkins University Press, 1959, passim.
47 For the Democratic party platform, see K. H. Porter and D. B. Johnson, National Party Platforms, 1840–1956, Urbana, University of Illinois Press, 1956, pp. 37–39.
See John Stuart Mill’s comments regarding the Democratic party’s stand:
A plea which imposes upon some people who would shrink from anything which they themselves regarded as repudiation, is this: Greenbacks, however they may be depreciated, are legal tender, are the lawful currency of the United States; other persons are obliged to receive this currency in payment of all their dues and why should the public creditor be an exception? … But the answers to it are manifold … If those who lent their savings to the United States had been told, at the time, that every thousand dollars they lent should be repaid to them in greenbacks, which might then be worth not more than a thousand cents (the depreciation of the French assignats amounted to that and more), nobody, unless he could afford to make the nation a present of his money, would have parted with it unless at a rate of interest sufficient to assure against the extreme risk. The United States obtained these sums of money, in their extreme necessity, at an interest (all things considered) not very much exceeding what the high value of capital in a new country compels them to pay in ordinary times; and after having reaped the benefit, having by that indispensable help saved their national existence, they are now exhorted to withhold the price, at the cost of the national honor (in a letter to a friend in England, printed in the Nation, Oct. 15, 1868, pp. 308–309, as “John Stuart Mill on National Faith”).
Though Mill’s logic is unassailable, his factual assumptions are not. As we shall see below in sect. 5, the market prices of government bonds during the Civil War suggest that purchasers treated them as greenback obligations and did not in fact expect the government to pay principal and interest in gold.
48 Irwin Unger, “Businessmen and Specie Resumption,” Political Science Quarterly, Mar. 1959, pp. 36–70.
49 See his Letter on National Finances, New York, Sun Job Print, 1869, pp. 19, 44. In a varied career, including a term as mayor of New York, Opdyke had been a commercial banker with links to the private banking firm of Jay Cooke.
50 In Oct. 1872, Secretary Boutwell increased greenbacks outstanding by $4.6 million and the House challenged his authority (E. B. Patten, “Secretary Shaw and Precedents as to Treasury Control over the Money Market,” Journal of Political Economy, Feb. 1907, p. 73. The Annual Report on the Finances does not allude to this or other reissues. They show up in monthly public debt statements). In reply, he claimed that the retired notes were a reserve on which he could draw to relieve seasonal pressure. The Senate Finance Committee also considered the matter and in a majority report denied the Secretary’s power, while a minority report upheld it. No further action was taken on the right of reissue and, by Mar. 1873, all of the $4.6 million had been retired. A $2.5 million reissue of greenbacks was made that month, however, to meet current expenditures, and retired in May. In the fall, the panic of 1873 intensified the pressure on the Treasury by the financial community to provide relief by reissuing greenbacks. President Grant and Secretary Richardson met Wall Street representatives in New York on Sunday, Sept. 21—the Stock Exchange having closed the previous day not to reopen for ten days—but they opposed the financiers’ plan. Instead, the Treasury bought bonds with greenbacks it held as cash and the Annual Report for 1873 states that those purchases were made “without the use of any part of the forty-four millions of United States notes, generally known as the reserve.” The report did not, however, mention that, from Oct. 1873 to Mar. 1874, the Treasury, faced with inadequate cash holdings, reissued $26 million in greenbacks to meet ordinary expenses.
51 An act of Mar. 3, 1863, increased the number of associate justices to nine, with the Chief Justice as the tenth member of the Court. Because of Congressional distrust of both the Court and President Andrew Johnson, the membership of the Court was reduced to seven by the act of July 23, 1866, which deprived the President of the opportunity to fill expected vacancies.
A month after Grant’s accession to the Presidency in 1869, Congress increased the number of the Court to nine, and authorized the President to nominate an additional judge at the next session of the Senate. Eight justices heard the case of Hepburn v. Griswold, but the decision of only seven was recorded, one having retired the week before the decision was given, in accordance with a public announcement some months earlier. Because of the Senate’s refusal to confirm the nominee for the new judgeship whose name the President had submitted in 1869, he had two vacancies to fill in 1870 after that retirement. On Feb. 7, 1870, the day of the decision in the first greenback case, he sent the Senate the names of two nominees. That coincidence gave rise to a charge that Grant packed the Court in order to obtain a reversal. Charles Warren, author of the definitive history of the Court, denied the validity of the charge (The Supreme Court in United States History, Boston, Little Brown, 1935 ed., Vol. II, pp. 517–518). On Mar. 25, four days after Grant’s appointees were confirmed, the U.S. Attorney General moved in the Supreme Court that two legal tender cases then pending, which involved contracts made after the passage of the Legal Tender Acts, be taken up for argument. The Court agreed, but the litigants withdrew their cases on Apr. 18, to the general relief, Warren adds, “since it seemed apparent that, if the decision should be reversed, a political movement might be initiated to reverse this second decision by adding still more Judges to the Court” (p. 524). The act of 1869 was the chief historical precedent for President Roosevelt’s unsuccessful 1937 proposal to enlarge the Supreme Court, which gave rise to the famous court-packing controversy.
52 The act contained a variety of provisions designed to appeal to silver advocates (replacement of fractional currency by silver coins); paper-money advocates (removal of all limits on the aggregate issue of national bank notes and linking the retirement of greenbacks—the aggregate outstanding not to fall below $300 million—to the increase in national bank notes); gold standard advocates (its main provisions).
53 See Richard Hofstadter, The Age of Reform, New York, Knopf, 1955, pp. 73 ff.
54 “Horace White, Money and Banking, Boston, Ginn, 1935, p. 259. According to Historical Statistics, 1949, Series P-53–56, in the 45th session of Congress, the Senate was composed of 39 Republicans, 36 Democrats, and 1 Independent. The classification of party membership at that time is difficult, because of the existence of offshoots of the major parties.
55 Report and Accompanying Documents of the United States Monetary Commission, organized under Joint Resolution of Aug. 15, 1876, 2 vols., 44th Cong., 2d sess., S. Rept. 703, GPO, 1877.
56 See sect. 1 above for the reasons we regard national bank notes as liabilities of the government rather than as liabilities of the banks comparable to their deposits.
57 For a full analysis of this framework, see Appendix B.
58 Note that this definition does not require that all kinds of money contained in the total be usable for both hand-to-hand currency and reserves. For example, in the greenback period, national bank notes could not be used for both by national banks. Currently, deposits at Federal Reserve Banks cannot be used for hand-to-hand currency (see Appendix B).
59 The term high-powered money is not original with us. See W. R. Burgess, The Reserve Banks and the Money Market, New York, Harper, 2d. ed., 1936, pp. 5–8; 3rd ed., 1946, pp. 5–8 (“The central bank deals in high-powered money …”); see also Board of Governors of the Federal Reserve System, The Federal Reserve System: Purposes and Functions, 2d ed., Nov. 1947, p. 16 (“Federal Reserve dollars are often called high-powered dollars as compared with ordinary deposit dollars …”); 3rd ed., Apr. 1954, pp. 20, 27; 4th ed., Feb. 1961, pp. 19, 27.
60 The formula connecting them with the money stock is where H is total high-powered money, D is commercial bank deposits, R is commercial bank reserves, and C is currency held by the public, so that D/R is item 2 above and D/C item 3 (see Appendix B, sect. 5).
61 See Appendix B for the method used to determine the contribution of each determinant to a change in the stock of money. For Jan. 1867 to Feb. 1879, the numerical contributions are:
Change in Money Stock That Would Have Been Produced by Indicated Determinant, if It Alone Had Changed

a Detail does not add to 1.00 because of rounding.
62 R. G. Rodkey, Legal Reserves in American Banking, Michigan Business Studies, Vol. VI, No. 5, University of Michigan, 1934, p. 32.
The laws imposing reserve requirements antedated the National Banking Act in two states (Lousiana, 1842; Massachusetts, 1858 and re-enacted, 1865), and were passed afterwards in four (Michigan, 1871; Connecticut, 1872; New Hampshire, 1874; Minnesota, 1878). A number of other states imposed reserve requirements in the period before the Civil War, but these applied to note issues only.
Under the National Banking Act, banks in so-called central reserve cities had to keep reserves in lawful money equal to 25 per cent of their deposits; banks in reserve cities had to keep total reserves as large as central reserve city banks, but could keep up to half as deposits at banks in those cities; and banks in other cities had to keep total reserves of 15 per cent, but could keep up to 60 per cent as deposits at banks in reserve or central reserve cities.
We exclude from our total of reserves for the consolidated banking system the legally required reserves that banks held in the form of deposits at other banks (see Appendix B).
We also exclude the redemption fund, consisting of lawful money equal to at least 5 per cent of note circulation, which national banks were required from 1874 on to deposit with the Treasury.
63 According to Mitchell, the mint par was 109.45 cents = 54d., which works out to $4.8647 a pound sterling. He notes that the former “style of quoting sterling exchange arose in colonial days when the Spanish dollar was worth approximately 54d. in English silver coin. The present style of quoting the British pound in dollars and cents (£1 = $4.86.65) was not introduced until January 1, 1874” (Mitchell, Gold, Prices, and Wages, p. 252).
64 There is much discussion in the literature about the details of the relations between the Treasury and the banks preceding suspension. The main writers attribute much of the responsibility for suspension to the methods used by the U.S. Treasury under Secretary Salmon P. Chase in borrowing funds to finance war expenditures in 1861—in particular, to the failure of Secretary Chase to suspend the provision of the Independent Treasury System that required proceeds of loans to be paid at once into the Treasury in specie. See Mitchell, A History of the Greenbacks, pp. 23–27, 42–43; and Don C. Barrett, The Greenbacks and Resumption of Specie Payments, 1862–1879, Harvard Univeristy Press, 1931, especially Chap. II.
Detailed mistakes of policy of this kind may indeed have led to suspension earlier and in a different manner than a more sophisticated policy would have done. In our opinion, however, their effect has been grossly overrated for the usual reason that, though they deal with superficial, they are newsworthy and prominent in the records of the period, whereas the basic forces at work are concealed from view. In view of the effect of the war on the foreign trade of the U.S., discussed below, the prevention of suspension required a decline in domestic prices in the U.S. This in turn would have required that the government refrain from financing any war expenditures by the tax on money balances implicit in the inflationary creation of money for government purposes. Indeed, the prevention of suspension would have required that the government use funds raised in other ways—from taxation in other forms and from borrowing at home and abroad at whatever interest rates were necessary—not only to finance war expenditures but also to force down the price level. Given the obvious unwillingness or inability to follow so Spartan a policy, suspension was inevitable sooner or later.
We do not, incidentally, mean to imply that so Spartan a policy, even if technically feasible, would necessarily have been desirable. On the contrary, in contrast to most earlier writers, we are inclined to believe that suspension itself was probably desirable, though an optimum financial policy would have involved more taxation and less inflation than was experienced. At the same time, in light of the U.S. experience in two world wars, especially World War I, the financing of the Civil War involved surprisingly little inflation, thanks more to accident than to policy. The tendency in the literature before World War I—of which Mitchell’s work is by far the most important part—to regard the financing of the Civil War as a disgracefully inflationary episode reflects the implicit application of standards of monetary rectitude that, to the modern student, seem almost Utopian in light of the monetary vagaries of the past half-century. See Friedman, “Prices, Income and Monetary Changes in Three Wartime Periods,” American Economic Review, May 1952, pp. 623–625.
The most persuasive argument against the use of inflationary finance that we have encountered is in Newcomb, Financial Policy during the Southern Rebellion. Newcomb explicitly recognized the distinction between borrowing at a zero rate of interest through currency issue—to the extent that it displaced gold and did not raise prices or force suspension—and imposing a tax through a still larger issue. He estimated the amount that could have been borrowed at a zero rate through currency issue at about $250 million (p. 161). Implicitly approving of such an issue and explicitly deploring issues beyond that amount, he argued that it would promote the war effort and raise fewer problems for the future to finance the remaining war expenses by explicit taxation and by borrowing at whatever interest rate was necessary to avoid suspension. Given the probably greater flexibility of wages and prices at that time than in World Wars I and II, Newcomb’s conclusions may well have been correct for the Civil War, even if they would not be for the later wars.
65 Here and throughout the rest of the book we use the terms demand and supply to refer to schedules expressing the quantity demanded or supplied as a function of price—in this case, of the exchange rate—and not to the quantities demanded and supplied.
66 The price indexes that would be optimum for computation of purchasing-power parity would presumably be indexes of the prices of the factors of production employed in each country. These seem preferable to indexes of product prices because their use implicitly classifies differential changes in productivity as a “real” rather than a “monetary” factor affecting exchange rates, as seems appropriate. Needless to say, satisfactory factor price indexes are not available for the period in question and are generally far less readily available and less comprehensive than product price indexes. Hence most students of purchasing-power parity and exchange rates have been led to use product price indexes.
Since internationally traded goods have a single world price, the ratio of their prices in domestic currencies must, shipping costs aside, move with exchange rates simply as a matter of arithmetic. This does not mean that they should be excluded from the relevant price index, as can be seen by considering the simplified textbook case of two countries each producing only a single product, part of which it exports to the other. All products are then international, and there are no strictly domestic products (though there are of course domestic factors), so exclusion of international products would make any comparisons impossible. As this example suggests, for each country, products exported should be included in the price index as reflecting the movement of domestic factor prices, but products imported should not be; and the weights for products exported by each country are volume of domestic production as a proxy for volume of resources employed, which means of course that “products exported” should not include “re-exports” but only domestic “value added.”
In practice, the chief problems raised by internationally traded goods are, first, that indexes include exported and imported goods indiscriminately; second, that, for a period like the greenback period when data are scanty, the available indexes tend to be dominated by raw materials with a broad market, and these in turn are mostly internationally traded goods, so that internationally traded goods are heavily overweighted in the available indexes. Because of these defects and the difficulty of overcoming them satisfactorily, indexes of domestic goods only might be preferable to the actually available indexes, even though not preferable to an optimum index. Rough indexes of this kind could be constructed by pulling out of existing indexes those items that are predominantly domestic. However, the probable return seems unlikely to justify the great amount of labor involved. For the United States, in any event, it seems clear from work already done that domestic prices moved roughly in harmony with the prices of internationally traded goods. See analyses of Frank D. Graham (“International Trade Under Depreciated Paper. The United States, 1862–79,” Quarterly Journal of Economics, Feb. 1922, pp. 253–254) and James K. Kindahl (“Economic Factors in Specie Resumption: The United States, 1865–79,” Journal of Political Economy, Feb. 1961, pp. 34–35), based on data collected by Mitchell (Gold Prices, and Wages, pp. 256 ff.). For Britain, which we have taken to represent the gold-standard world, the situation is rather different because of the weight attached in most indexes to imported articles. Cotton, for example, rose sharply in price relative to other goods during the Civil War, because the supply from the South, a major producer, was cut off. For Britain, cotton was wholly imported and should be excluded. However, for Britain regarded as representative of the rest of the world, cotton should be included with a weight equal to the amounts produced outside of the U.S. (see note 67, below).
As is clear from the preceding, the price indexes that are relevant for the present purpose are very different from those relevant for such other purposes as comparisons of international standards of living. For that purpose, items should be weighted according to consumption, not production, and it may be desirable to use identical baskets of goods, with the usual index-number problem that alternative baskets or consumption patterns in different countries will give different results. For the present purpose, the use of identical goods has nothing to recommend it, as is clear from the simplified textbook example of the second preceding paragraph. There is the usual index-number problem, but it is connected with the particular year or years from which the weights are derived for each country separately, not with the difference between the weights for different countries.
67 The Warren-Pearson index is available monthly and so is the greenback price of gold. The Sauerbeck index, which is perhaps the best known and most widely used index for Britain for that period, is annual (Augustus Sauerbeck, “Prices of Commodities and the Precious Metals,” Journal of the Royal Statistical Society, Sept. 1886, p. 648). It would be highly desirable to have data for more frequent intervals to permit a more sensitive comparison between the actual and the purchasing-power parity price of gold. Hence, we considered the possibility of using the Economist price index, which is available on June and December dates {Economist, London, Aug. 26, 1911, pp. 421–425; Feb. 4, 1911, pp. 206–207). Neither index comes close to the optimum outlined in the preceding note, since both are weighted arbitrarily (being simple averages of relative prices, the base being 1867–77 for Sauerbeck and 1845–50 for the Economist), and over half their weight is given to imported goods. However, the Economist index gives much greater relative weight than the Sauerbeck index does to cotton and tobacco: 5 out of 22 commodities reflect the prices of these items directly or indirectly (India raw cotton, cotton wool, cotton yarn, cotton cloth, and tobacco) and these five items accounted for 42 per cent of the aggregate of the relatives in Dec. 1863. Two out of 45 items in the Sauerbeck index are cotton (tobacco is not included). Whereas some weight should be given to cotton and tobacco for the non-U.S. world as a whole, the weight given them by the Economist index seems so clearly excessive that we decided to use the Sauerbeck index despite its availability only annually during the greenback period.
The two indexes behave very differently during the Civil War period. The Sauerbeck index reaches a peak in 1864, some 7 per cent above its value in 1861. A comparable average for 1864 computed from the Economist index (a weighted average of the values for Dec. 1863, June 1864, and Dec. 1864 with weights ¼, ½, and ¼) is 38 per cent above a corresponding average for 1861. To judge from some tentative calculations, most but not all of the difference is attributable to the greater weight attached to cotton and tobacco in the Economist index.
In a continuation of purchasing-power parity computations for subsequent periods presented in the next and later chapters, we use the ratio of the price index for the U.S. implicit in the conversion of national income.at current prices to national income at constant prices, to a general price index for Britain instead of the ratio of wholesale price indexes. The U.S. implicit price index and the British general price index are much broader in scope and give more nearly the appropriate weight to domestic relative to international goods, which is why we prefer them. Unfortunately, such indexes are not available for the Civil War period.
68 Because the sum of the denominators of the ratios in the upper part of Chart 5 was adjusted so as to equal the sum of the numerators, the ratios themselves average out to a figure that is close to unity. This is the only meaning of the base line of 100 in the upper part of the chart.
69 Historical Statistics, 1960, Series U-134, U-142, U-116, U-124.
70 In some of these countries, notably the Latin Union, silver as well as gold remained legally a monetary metal but the amount of silver that was coined was limited, hence the standard was in effect a gold standard.
71 If the Economist index is used and a similar calculation made for semiannual dates, the range of the price of gold is 2.3 to 1, of the ratio of the actual to the hypothetical price, 1.8 to 1, so that by this computation movements in relative price levels account for a much smaller share of the movement in the price of gold than according to the computation in the text. The difference is attributable mainly to the greater weight attached to cotton and tobacco by the Economist index and reflects mostly, therefore, the defects of that index for our purpose. For example, for the period 1866 to 1879, when the wartime effects on the relative price of cotton and tobacco are no longer important, the range of the price of gold is 1.41 to 1 based on annual averages, and 1.45 to 1 based on June and Dec. dates; the range of the ratio of the actual to the hypothetical price is 1.17 to 1 based on the Sauerbeck annual figures, and 1.20 to 1 based on the Economist index, so that the two computations attribute roughly the same share of the movement in the price of gold to changes in purchasing-power parity.
72 It is tempting to add: even if no allowance is made for increased demand for imports arising from the war. However, it is by no means clear that this addendum is justified, and it would take much more detailed analysis than is appropriate for our purposes to determine whether it is. The government instead of private individuals used real resources. It acquired them by taxation, including the tax on money balances implicit in inflationary currency issue, and by borrowing. The effect on the foreign trade situation depends on whether the government or the individuals who released the resources had a larger or smaller demand for imports per unit of total resources employed. The answer is by no means obvious.
73 From fiscal 1860 to fiscal 1865, exports of U.S. merchandise valued in prewar gold dollars fell $179 million, or from $316 million to $137 million. Exports of crude materials alone, reflecting mostly cotton, fell by $183 million, or from $217 million to $34 million {Historical Statistics, 1960, Series U-10, U-62, and U-75). We use fiscal 1860 rather than fiscal 1861, because the recorded figures for the latter already show a substantially reduced level of exports, owing to the omission of returns on cotton exports from Southern ports {Annual Report of the Secretary of Treasury, 1864, p. 246; Statistics of the Foreign and Domestic Commerce of the United States, Treasury Dept., 1864, p. 40). Our basis for describing these figures as in prewar gold dollars is a comparison with Monthly Summary of Commerce and Finance of the United States, Treasury Dept., Apr. 1903, pp. 3315–3316 (cited in Historical Statistics, 1960, p. 533).
Matthew Simon’s failure to recognize the faulty character of the merchandise export figures for 1861 results in a residual figure for net capital imports of $104.4 million in that year, according to his calculations (“The United States Balance of Payments, 1861–1900,” Trends in the American Economy in the Nineteenth Century, Studies in Income and Wealth, Vol. 24, Princeton for NBER, 1960, pp. 699–700). This is an unlikely result. The largest capital import in the preceding forty years, according to Douglass G. North, was $62.2 million in fiscal 1836 (“The United States Balance of Payments, 1790–1860,” p. 621). Is it likely that, in the year the war broke out between the North and the South, foreigners would have sent more than $100 million here?
See also R. A. Kessel and A. A. Alchian, “Real Wages in the North during the Civil War: Mitchell’s Data Reinterpreted,” Journal of Law and Economics, Oct. 1959, pp. 95–113.
74 The alternative calculation using the Economist index gives both a different magnitude and a different time pattern of depreciation. The depreciation increases markedly from 1861 to June 1864, reaching a peak of 55 per cent, then falls sharply. The greater magnitude seems not implausible as implied by the text, but the different pattern seems most implausible except as a reflection of the overweighting of cotton and tobacco. It is hard to see why the “true” depreciation should have increased sharply over the period, especially in late 1863 and early 1864, when apparently there was an increased inflow of capital. The implausibility of this pattern was a major factor in our rejecting the Economist calculation in favor of the Sauerbeck.
As to magnitude, the truth is probably between the two estimates, though also probably closer to that given by the Sauerbeck index.
75 Historical Statistics, 1960, Series U-6, shows a total of net gold exports of $256 million in the five fiscal years from 1856 through 1860, of $205 million in the next five. There is an increase in the course of these last five years from a net import in 1861 to a level of exports in the final three years slightly above the average of the five prewar years. The difference even then is not large. The figures before 1864 include domestic exports of silver as well as of gold; thereafter only of gold. However, to judge from the small increase in recorded silver exports that results from this reclassification {ibid., Series U-7), the exclusion of domestic exports of silver from our figures before 1864 would hardly affect the above calculation.
76 Cf. the monthly prices of consols (Statistical Abstract of the United Kingdom, 1852–1866, Parliamentary Papers, 1867, Vol. LXXI, p. 113). The monthly average discount rate charged by the Bank of England fell from 8.0 per cent in early 1861 to 2 per cent in mid-1862 and then rose to a peak of 9 per cent in the fall of 1864. The ease in the London money market in the summer of 1862 was attributed to the gold inflow from the U.S. produced by the liquidation of American securities by British holders (Economist, July 26, 1862, cited by Simon, “Cyclical Fluctuations and the International Capital Movements of the United States, 1865–1897,” unpublished Ph.D. dissertation, Columbia University, 1955, p. 82), and the pattern of Bank of England rates is indeed consistent with a capital inflow from the U.S. from 1861 until late 1862. The pattern is also consistent with a capital outflow to the U.S. from late 1862 to 1864, but, in fact, there was no capital outflow from Britain to the U.S. during that period. The Dutch and Germans bought American securities, 1863–64; the British did not until later, when Union victory was assured.
77 Mitchell, A History of the Greenbacks, pp. 360–379; and Irving Fisher, “Appreciation and Interest,” Publications of the American Economic Association, Vol. XI, No. 4, Aug. 1896, pp. 38–45. Mitchell offers a series of possible explanations, but it is clear that he himself is extremely skeptical that they are at all satisfactory, as in fact they are not.
78 At the time, private securities were entirely “paper” rather than “gold” securities, i.e., both interest and principal were payable in legal tender and did not contain what came to be known as “gold clauses.” The introduction of gold clauses was a consequence of the greenback experience. In Macaulay’s list of 150 railroad bonds, 32 issued before 1865 were all payable in currency. The first one payable in gold was issued in 1865, but until after resumption, payment in gold was the exception. Of 24 issued in 1865–78, only 6 were payable in gold. Gold clauses then became the rule. Of 22 bonds issued in 1879–86, 14 were payable in gold; and all but 2 of the remaining 72 bonds issued thereafter were (F. R. Macaulay, Movements of Interest Rates, Bond Yields, and Stock Prices, pp. A5-A16).
79 Continuous quotations on this bond are available throughout the greenback period. The 5’s of 1862 (date of issue) were the bonds foreigners particularly favored, but were not quoted continuously.
80 There is a subtle problem here in calculating yield to maturity in greenbacks, since it depends on what happens to the greenback price of gold at the dates when interest payments are made and the principal repaid. The yield is 6 per cent only if the price of gold remains unchanged.
This consideration means that the statement in the text about the greenback price of the gold bond, while literally correct, is incomplete. Arbitrage would, of course, assure that the price of the gold bond in greenbacks would equal its gold price times the price of gold. But the gold bond and the currency bond might not sell for “equivalent” yields. Holding currency bonds is a way to speculate on a future fall in the price of gold; holding gold bonds, on a future rise. If the market, on the average, expects a fall, it will price currency bonds at a lower currency yield than the gold yield at which it will price gold bonds, and conversely.
81 “Roughly,” because of the considerations in the preceding footnote.
82 Note that this is not inconsistent with an expectation on the part of foreign or domestic speculators that the greenback price of gold would fall, for these reasons: (1) a fall could occur without taking the price back to prewar par; (2) even if it took it back to par, that might occur after the repayment of the bond, and even if it occurred before, the coupon payments in the interim might be in greenbacks; (3) the purchasers of government securities were a much more mixed and broader group than the speculators in foreign exchange were, so we are dealing with the expectations of two very different groups.
See Newcomb for a parallel analysis (Financial Policy during the Southern Rebellion, pp. 108–111). For each month from Mar. 1862 through Dec. 1864 he shows the price of gold in greenbacks, the gold value of $100 in greenbacks, and the gold value of $100 of par value of 20-year 6 per cent government bonds. He interprets the low value of the bonds as reflecting a lack of confidence in their repayment in gold, citing the “much higher price commanded by Massachusetts bonds of similar character” as conclusive evidence for his interpretation.
83 Simon, “Cyclical Fluctuations,” pp. 83–84, 87, 110.
84 See Graham, Exchange, Prices, and Production in Hyper-inflation: Germany, 1920–23, Princeton University Press, 1931, pp. 49–56; Cagan, “The Monetary Dynamics of Hyperinflation,” Studies in the Quantity Theory of Money, Milton Friedman, ed., University of Chicago Press, 1956, p. 91.
85 Graham, “International Trade,” pp. 242–244.
86 Simon, “Cyclical Fluctuations,” p. 150.
87 The repatriation of American government securities after 1870, of itself, would have raised no difficulties in the U.S. securities markets, if it had continued to be a transfer of funds from government to railroad and other bonds. In addition to the continuing demand for government securities by national banks, in 1876–78, those savings banks that did not succumb during the runs on them (particularly in Rhode Island, Massachusetts, Pennsylvania, and New York) shifted from mortgages to government bonds for greater safety; and former depositors who withdrew balances from those banks also bought government bonds (Simon, “Cyclical Fluctuations,” p. 237). However, after 1873, the demand abroad for railroad bonds declined, so there was a net reduction in foreign demand for all U.S. securities.
88 From fiscal 1871 to fiscal 1872, general imports rose by $107 million, or 21 per cent, and continued to rise moderately until 1873, thereafter falling sharply. From fiscal 1871 to fiscal 1872, total exports stayed almost exactly constant, whereas they had been rising, and exports of crude materials fell; in fiscal 1873, total exports rose by $78 million (see Historical Statistics, 1960, Series U-10, U-13, K-302, and U-62).
89 Simon, “Cyclical Fluctuations,” pp. 146–149. As Simon notes, this short-term capital movement may in part account for the fact that the difference between Graham’s net long-term loans floated, estimated directly, and his own net total capital movements, estimated indirectly from balance of payment figures, reaches a peak in fiscal 1872.
90 See O. M. W. Sprague, History of Crises, pp. 35–38.
91 It should be noted, however, that the existence of a free market in foreign exchange eliminated one motive for holding gold that has been important in recent years, namely, as a way to get around foreign exchange controls.
92 Graham states at one point, “During the period of heavy borrowing the net export of gold was large. This was to be expected, inasmuch as the borrowing tended to depress the premium on gold and thus to make it relatively cheap. Note that just the opposite trend would be expected under a gold regime” (“International Trade,” p. 232).
This is clearly wrong: the lower premium on gold, by making it relatively cheap, would depress production, and so tend to reduce exports of gold, precisely as a relatively cheap price for gold would under a gold regime. If exports were nonetheless large, it was because the reduction in supply out of production was more than offset by an increase in supply out of stock and by a reduction in demand for domestic use, both of which reflected the demonetization of gold.
This is the one flaw we have noted in Graham’s excellent analysis of the period, from which the above discussion has benefited greatly.
93 The Economist index shows the same change from June 1861 to June 1879.
94 Or, as Schumpeter put it, “the economic organism was allowed to grow into its monetary coat” (J. A. Schumpeter, Business Cycles, New York, McGraw-Hill, 1939, Vol. I, p. 315).
95 This terminology takes for granted the objective of resumption at prewar parity and is not intended to imply that we regard that objective as desirable. Our own judgment in retrospect is that, given that a gold standard was to be reestablished, it would have been preferable to have resumed at a parity that gave a dollar-pound exchange rate somewhere between the pre-Civil War rate and the rate at the end of the war.
We initially wrote that this judgment was “heavily influenced by current attitudes,” but then Gottfried Haberler reminded us of Ricardo’s views on the wisdom of Britain’s resumption of specie payments at prewar parity in 1821, following the depreciation of its currency during the Napoleonic war period. “I perceive that you rather misconceive my opinions on this question [the reduction in prices 1813–19]—I never should advise a government to restore a currency, which was depreciated 30 pc., to par; I should recommend, as you propose, but not in the same manner, that the currency should be fixed at the depreciated value by lowering the standard, and that no further deviations should take place. It was without any legislation that the currency from 1813 to 1819 became of an increased value, and within 5 pc\of the value of gold,—it was in this state of things, and not with a currency depreciated 30 pc*., that I advised a recurrence to the old standard” (Ricardo to John Wheatley, Sept. 18, 1821, The Works and Correspondence of David Ricardo, ed. by Piero Sraffa with the collaboration of M. H. Dobb, Cambridge U. Press for Royal Economic Society, 1952, Vol. IX, p. 73).
96 In the two years 1877–79, the Treasury refunded $845 million (John Sherman, Recollections of Forty Years in the House, Senate, and Cabinet, Chicago, Werner, 1895, Vol. II, p. 723) of $1,790 million outstanding interest-bearing public debt [Historical Statistics, 1949, Series P-136, p. 306). On the Treasury’s refunding operations, see Specie Resumption and Refunding of the National Debt, Letter from the Secretary of the Treasury, dated Dec. 2, 1879 (accompanying the Annual Report on the Finances, with documents relating to resumption and refunding), 46th Cong., 2d sess., H. Exec. Doc. 9. For the estimate of the volume of government securities repatriated by foreigners, see Simon, “Cyclical Fluctuations,” p. 378. We cite an estimate for 1876–78, which, if anything, is too low for 1877–79, since 1876 was a year of virtually no capital movement and 1879 was a year of a large capital outflow.
97 The Treasury’s balances rose notably only after 1877, from $101 million in Feb. 1877 to $196 million in Feb. 1879. Over the same period, total high-powered money, which is to say, currency in the hands of the public plus bank reserves, was almost constant, falling only from $757 million to $752 million. Holdings of specie by the national banks actually rose rather than fell in that period. The rise in the holdings of national banks and of the government was roughly equal to domestic gold output. Hence one can treat the operation as if domestic bond purchasers used domestic currency to buy gold at home and transferred the gold to the Treasury in return for bonds. This would involve a transfer of currency from bond purchasers to gold miners with no change in the total. Of course, this description of the operation is only figurative, since there is no way to identify the particular source of a particular transaction.
98 It may be well to repeat that demand and supply are being used to refer to schedules expressing quantity demanded or supplied as a function of price, in this case, the exchange rate.
99 The phrase is from David A. Wells, Recent Economic Changes, p. 6.