11: DAX Topic: IF(), SWITCH(), and FIND()
DAX has a number of useful functions that allow you to apply a test and then branch the formula based on the results from that test. You will most likely be familiar with this concept from the IF() function in Excel.
The IF() function in DAX is almost identical to IF() in Excel:
IF(Logical Test, Result if True, [Result if False])
Note that the last parameter, [Result if False], is optional. If you omit this parameter and the result is FALSE, the IF() formula returns BLANK(). This is very useful because a matrix or chart in Power BI will not show values if the result in the Values section is BLANK().
The SWITCH() function is a lot like Select Case in VBA programming. The syntax of a SWITCH() function is as follows:
SWITCH(expression, value, result[, value, result]...[, else])
This syntax is a little confusing, so let’s go through a simple example with another calculated column.
Right-click on the Customers table, select New Column, and enter the following formula:
House Ownership = SWITCH(Customers[HouseOwnerFlag],1,"Owns their house",0,"Doesn't own their house","Unknown")
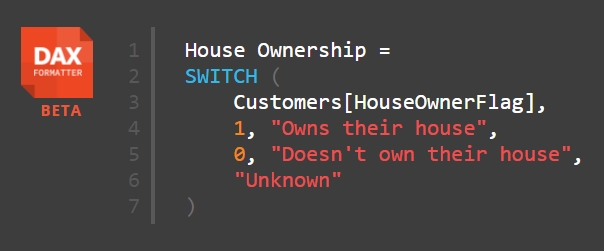
It is much easier to understand SWITCH() if you use DAX Formatter to improve the layout, as shown below. You can see in this figure that line 3 is the branching point. The possible values in the HouseOwnerFlag column are 0 and 1 in this instance. Lines 4 and 5 offer up pairs of input and output values. So if the value of HouseOwnerFlag is 1, then the result "Owns their house" is returned. If the value of HouseOwnerFlag is 0, then the result "Doesn't own their house" is returned.

Line 6 is a single value, and it applies to all other possible values of HouseOwnerFlag (although there are none in this example).
Note: There is a much more exciting use of the SWITCH() function later in the book. See "The SWITCH() Function Revisited" on page 174 in Chapter 17.
The FIND() function in DAX is almost identical to the FIND() function in Excel. In DAX, it has this format:
= FIND (FindText, WithinText,[StartPos],[NotFoundValue])
Even though this syntax suggests that StartPos and NotFoundValue are optional, in my experience (as of this writing), you actually do need to provide values for these parameters.
An Example Using IF() and FIND()
This example shows how to create a calculated column on one of your lookup tables. As I have said previously, it is perfectly valid to create calculated columns in lookup tables, but wherever possible, it is better practice to create these columns in your source data or using Power Query. Remember why this is important:
- Calculated columns may take up more space than imported columns (but this is generally not a major issue for lookup tables).
- If you are manually creating a calculated column, it exists only in that single workbook, and you need to re-create it over and over for every other workbook where you need the column.
If it is not possible to create the calculated column in your source data for some reason, then creating a calculated column instead is a great solution, particularly for lookup tables.
In this example, you are going to create a Mountain Products column that doesn’t exist in your lookup table. Any product with the word mountain in the description will be flagged as a mountain product.
Right-click the Products table in the fields list, select New Column, and type the following formula:
Mountain Products = FIND("Mountain", Products[ModelName] ,1,0)
Switch to Data view so you can check the results of your new column. (Remember that it is your responsibility to ensure that the formulas are working as expected.)
This formula searches for the word mountain in the ModelName column. Remember that because a calculated column has a row context, it is possible to refer to the column in this way, and it will calculate a result for every row in the Products table and store the answer in the column.
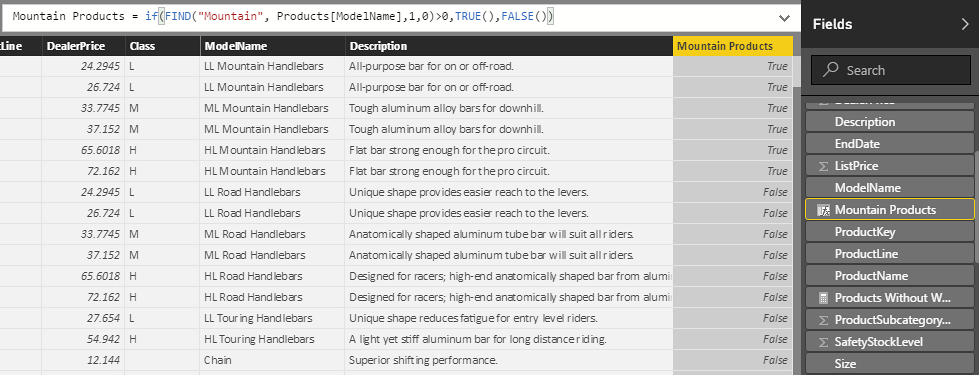
The result is an integer representing the starting position where the word mountain is found. If the word mountain is not found, then the value 0 (the last parameter in the formula) will be returned. So you get something like the table shown below.

This table is not overly useful as is, but you can wrap an IF() statement around this formula to make it more useful. As shown below, you can use the IF() statement to return TRUE if the number is greater than zero (i.e., if it is a mountain product) and return FALSE if it is equal to zero (i.e., it is not a mountain product).

Now you have a new calculated column, and you have further enhanced your data model to be more useful. Remember that this calculated column will take up space in your file and disk. However, given the small number of unique values (only True and False in this case) and the fact that this column is in a lookup table, this column won’t take up much space. The greater the number of unique values in a column, the more disk space and memory the column will consume.
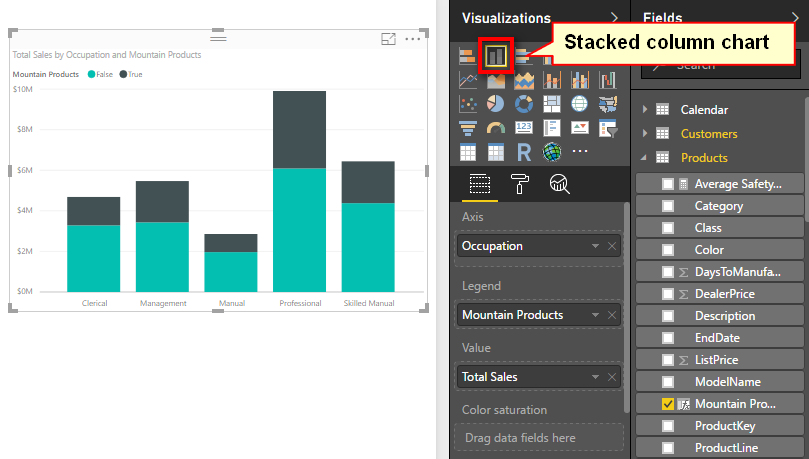
You can now use this new column anywhere in your Power BI report to produce new insights that weren’t previously visible in the data. Because this formula is a column in the data model, it can be used to filter a matrix, or it can be used on an axis in a chart, as shown below.
