Chapter 2. The Basics of Investing
What is the objective of investing? Most people tend to say something like, “To make as much money as possible”. My answer is different. As I see it, the objective of investing is to improve your quality of life. What you are doing when you start investing is making a conscious decision to put a certain amount of money aside in the reasoned belief that it will be worth more in the future – a little sacrifice today for a lot more gain tomorrow.
Successful investing is therefore a passport to a better life for your family. It is worth emphasising that you don’t need to have huge sums ready and waiting. What you need is the discipline to save a little regularly. Over the years I have often been told that it was pointless to save small amounts each month; they could never amount to anything. But that is the first and biggest mistake you can make about investing. As we’ll see, time can do wonders for the value of investments, no matter how small they start out.
Part of the reason for writing this book is my belief that the more confident you are that you can grow your money by investing, the more likely it is that you will in fact put aside money for that purpose, rather than spend it some other way. And the more committed you are with your investments, the less time it will take to arrive at any given financial objective. In a world where bank accounts pay virtually nothing in the way of interest, the one certainty is that unless you do invest your money profitably, it cannot grow in value and you are never going to improve your quality of life as much as you want.
You need to have a plan
Having decided that you want to improve the quality of your life in the future, where to start? In my view there is no avoiding having a financial plan, however basic. The clients we see at Hargreaves Lansdown come in all shapes and sizes. Some have more than £25m invested with us and own almost every kind of investment that exists. Others may be putting as little as £25 a month into a single savings scheme. As far as I am concerned, that doesn’t make any difference: whoever you are, and whatever your circumstances, you still need to find the time to sit down and put together a sensible financial plan.
Such a plan involves working out:
- what money you have today
- what money you need now and in the future
- what you are trying to achieve over the course of your investing life.
Of course, other than death and taxation, nothing in life is ever certain. Everybody’s circumstances are different. Some things can only be estimated very roughly and life expectancy is a lottery. But without the discipline of at least a rudimentary financial plan you cannot really hope to make effective investment decisions for the future. You wouldn’t dream of setting off in a car without knowing where you are going and how long it might take. Managing your money is no different. Nearly everyone can do it – just as long as they are willing to make the effort.
The DIY approach
In my opinion, money spent getting professional help to put together a financial plan for your life is almost always money well-spent. It may cost you a few hundred pounds. People seem only to take financial advice when their personal circumstances change – such as after death, divorce or the arrival of children – but having a regular professional check-up every few years is sensible.
Nevertheless, it is not impossible to put together the rudiments of a financial plan yourself. A good financial plan does not need to be complicated. It is better to be roughly right than precisely wrong. But it does need to be thorough.
1. What you earn
The plan starts with the figures for what you and your family earn now, with a realistic assessment of how income from all sources might grow over the next few years, allowing for tax, national insurance and other deductions.
2. What you spend
The next step is to work out your outgoings, starting with essentials such as food, housing costs (mortgage or rent), utility bills and life insurance, followed by the amounts you spend on discretionary items, including eating out, entertainment and holidays.
People are frequently surprised to discover exactly how much money they spend on transitory lifestyle items. Having a coffee at Starbucks every day, for example, can easily cost you more than £600 a year. This part of the financial plan can be a useful time to evaluate how many of the things you spend money on today are ones you might be willing or able to give up in order to have more wealth and security in the future.
Estate planning
Preparing your financial plan is also a good stage to think about the future of your children and wider family when you die. If you die young or unexpectedly, life insurance can provide part of the answer. The same goes for critical illness cover. But for anyone who expects to live a normal span it is essential both to have some investments and to think through what might happen to those investments after you have gone. This in particular may require some professional help, as the difficult tax and legal consequences of death can almost invariably be ameliorated by careful advance planning.
3. How much you can invest
Once you have the basic income and outgoings, the next step is to try and calculate roughly how much you need to invest today, and for how long, in order to obtain the level of capital or income return that you are likely to want in the future. A number of factors are involved in this:
- future inflation rates
- potential investment returns
- taxes and costs
- your investment time frame.
It is particularly important to make realistic assumptions about your life expectancy. This applies especially to pensions, which remain most people’s biggest financial asset after their home. Thanks to medical advances and improvements in standards of living, human beings now live much longer than they did. Life expectancy for the average man is now ten years longer than it was 30 years ago: for women it is 12 years longer. If you are thinking of retiring at the normal age, you are going to have to rely on your savings for much longer in order to go on enjoying the lifestyle that you have planned or hope to have.
Possible future inflation rates
Inflation is one of the most potent and insidious risks facing anyone who chooses to save and invest money. Even modest rates of inflation, like the ones we have experienced in the last few years, can quickly destroy the purchasing power of your money.
If inflation is running at 2% per annum, what you can buy with £100 will decline by 18% (almost a fifth) after ten years and by 32% (or nearly a third) after 20 years. In a normal working lifetime of 40 years, the purchasing power of your money will fall by 55% (more than half) if inflation is 2% per annum. If it goes to 5% per annum, the value of every £100 you have today will be just £16 in ‘real’ terms when you quit working after 40 years.1
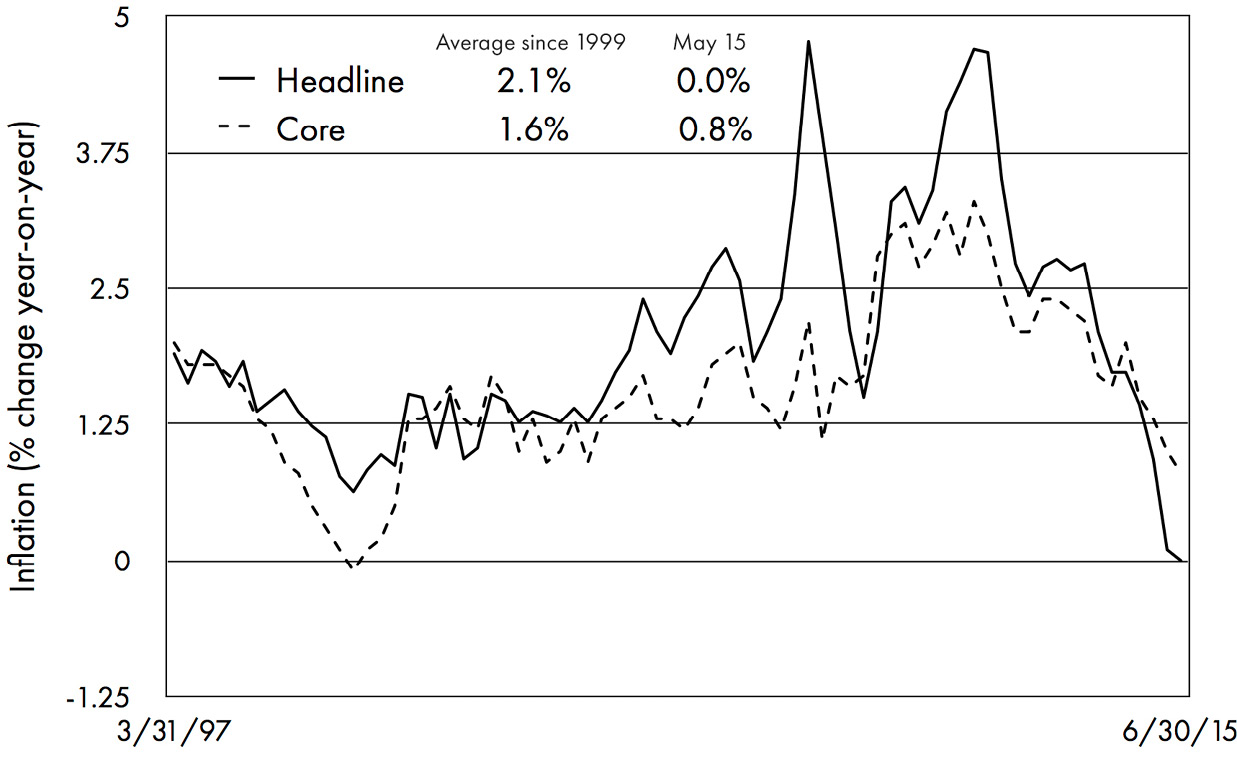
Figure 2.1: Inflation since the turn of the century – up for 10 years, then falling fast. The core consumer price index (CPI) excludes food and energy: the headline CPI includes them. What matters most to you, however, is the cost of the lifestyle you have chosen.
Source: J.P.Morgan Asset Management, Guide to the Markets.
That is generally good news, but it does not tell the whole story. Many of the essential things that you have to pay for in life, such as heating and lighting, water, insurance and food (and housing!), are still going up in price more quickly than official inflation figures suggest. A fundamental principle of good investment is that unless your investments can grow at least as fast as the cost of your lifestyle, you are not getting any wealthier – as many people found out in the 1970s, when inflation soared to more than 25% and wiped out the savings of those who had not prepared for such an outcome.
Our current issues are not the same, but don’t be misled into thinking that runaway inflation like that could not happen again. It can and quite probably will, though I don’t know when. The point is that your investment strategy must take account of the possibility. Only if your income and investments can grow by more than the rate of inflation will you be able to afford the same things when you retire as you spend money on today.
Potential rates of return
You cannot know how much you will need to invest without also having an idea of the possible returns that you might be able to make. Putting it at its simplest, there are four main asset classes that investors have to consider. Any sensible investment strategy is likely to include a mixture of these type of investments, which all have their own distinctive characteristics. In all four cases you have the choice of investing directly yourself or using a managed investment fund to gain your exposure. The four are:
- equities (the posh word for shares)
- bonds (fixed-interest securities)
- property
- cash.
With the help of historical surveys, it is possible to summarise the historic returns that these four asset classes have produced over long periods of time. It is easy to start with cash, which means not just the money in your purse or wallet but the money you have deposited in the bank or building society. A few years ago it was possible to earn 4%–5% on your deposits, and even though inflation was higher than today it still left you ahead of the rate of inflation.
Since the global financial crisis of 2008, however, that is no longer the case. Interest rates, which are the main weapon that policymakers have to control inflation, have also fallen to record low levels as inflation has subsided. The basic lending rate set by the Bank of England was cut to just 0.5% after the crisis – its lowest level for six centuries – and was still at that rock-bottom rate five years later. That in turn has resulted in derisory returns on deposits at the bank and building society.
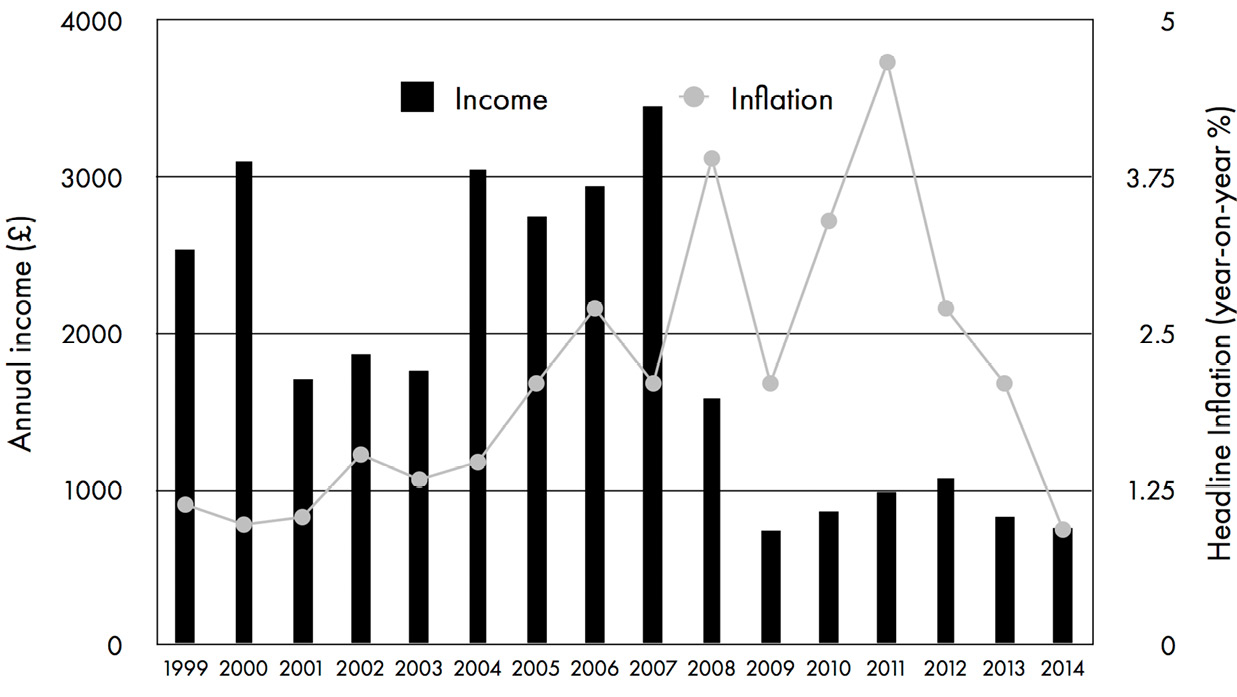
Figure 2.2: Returns on bank deposits have fallen dramatically since the global financial crisis in 2008. Having been above the rate of inflation before, they have been well below for several years – not a happy state of affairs for investors.
Source: J.P.Morgan Asset Management.
What about the other so-called ‘asset classes’ I mentioned above? In Table 2.1 I show the annualised rates of return achieved by the different asset classes over long periods of history. At first glance all these figures may seem pitifully small. But remember (a) that these are returns after allowing for inflation; and (b) that they represent the long-run annual percentage rate of growth for each class. The table does not bring out the effect of compounding those modest annualised returns over long periods of time. (For commercial property and index-linked gilts, we do not have such a long series of figures as we do for the others, so the historical record is shorter.)
|
Asset type |
10 years |
20 years |
30 years |
50 years |
|
Equities |
4.1 |
4.6 |
6.2 |
5.4 |
|
Conventional gilts |
3.7 |
5.1 |
5.2 |
3.1 |
|
Commercial property |
2.7 |
5.6 |
5.6 |
- |
|
Residential property |
-0.3 |
3.6 |
2.4 |
- |
|
Index-linked gilts |
3.5 |
4.4 |
3.9 |
- |
|
T-bills (cash) |
-0.7 |
1.1 |
2.5 |
1.5 |
|
Building society |
-1.5 |
0.0 |
1.3 |
0.8 |
|
After deducting inflation |
3.1 |
2.9 |
3.5 |
5.6 |
Table 2.1: The long run returns from different asset classes after inflation.
This table measures the annual percentage real return from shares, bonds, property and cash over different time periods (data as 31st December 2014). While shares typically produce the highest returns, over shorter periods they can be much more volatile. Another point to note is that bond returns have been well above their long term historical average in the last 20 years and are unlikely to be that good in the next 20 years.
You may be surprised – most first-time investors are – by the enormous positive impact that the wonders of compounding can do for your financial wellbeing. The way to see how dramatic this effect can be is to translate rates of return into cumulative monetary sums. In Table 2.2 I show the long term impact on your wealth if your investments earn a given rate of return over time. You can easily see how even small sums invested at seemingly modest rates of return can grow into something pretty big if you let time do its work. For example if you invest just £1,000 and make a 7% annual rate of return every year, after 20 years, provided you have drawn nothing out, you will have £3,870 – nearly 3.9 times as much as you put in. After 30 years your investment will have grown 7.6 times and after 40 years no less than 14.9 times.
|
The value of £1,000 invested |
||||||
|
Assuming no inflation |
||||||
|
Number of years invested |
||||||
|
Growth rate |
10 |
20 |
30 |
40 |
50 |
|
|
3% |
£1,344 |
£1,806 |
£2,427 |
£3,262 |
£4,384 |
|
|
5% |
£1,629 |
£2,653 |
£4,322 |
£7,040 |
£11,467 |
|
|
7% |
£1,967 |
£3,870 |
£7,612 |
£14,974 |
£29,457 |
|
|
10% |
£2,594 |
£6,727 |
£17,449 |
£45,259 |
£117,391 |
|
|
Invested |
|
£1,000 |
£1,000 |
£1,000 |
£1,000 |
£1,000 |
Table 2.2: The impact of compounding your money over time.
This table shows the effect of investing money at different rates of return over long periods of time. If your working life extends to 40 years, there is clearly a lot of scope to build a worthwhile investment fund or pension pot.
The wonder of compounding is that the higher the growth rate you can achieve, and the longer you are able to invest, the bigger that eventual multiple will be – and the more your investment fund will be worth. This, as I have already mentioned, is one of the most important lessons in thinking about investment: time really is money. It is the fundamental reason why those who can start investing early in life are handsomely rewarded. It is also the reason why the rich tend to get richer. Having money to start with means they have much longer to reap the rewards of investing than someone who has to work their way up to becoming an investor for the first time in say their 40s or 50s.
The figures I have shown are cash figures, before taking account of inflation. The bad news is that inflation also has a compounding effect on the purchasing power of the money you have invested. You need to factor in a future inflation rate to arrive at the final ‘real’ or purchasing power value of your investments. So if you assume a future inflation rate of 2.0% per annum, for example, the figures come out as in Table 2.3. You can see how the multiple of your investment – how far your wealth can grow in real terms – declines as a result.
|
The value of £1,000 invested |
||||||
|
After inflation at 2% per annum |
||||||
|
Number of years invested |
||||||
|
Growth rate |
10 |
20 |
30 |
40 |
50 |
|
|
3% |
£1,102 |
£1,215 |
£1,340 |
£1,477 |
£1,629 |
|
|
5% |
£1,336 |
£1,786 |
£2,386 |
£3,188 |
£4,260 |
|
|
7% |
£1,614 |
£2,604 |
£4,203 |
£6,782 |
£10,944 |
|
|
10% |
£2,128 |
£4,527 |
£9,633 |
£20,497 |
£43,614 |
|
|
Invested |
|
£1,000 |
£1,000 |
£1,000 |
£1,000 |
£1,000 |
Table 2.3: The impact of compounding your money over time, in real terms, after accounting for inflation of 2% per annum.
After 20 years, to take the same example as before, your fund has grown by just over two and a half times what you have put in, as opposed to nearly 3.7 times before inflation. That is still a big improvement on leaving your money uninvested, but also a useful reality check about how corrosive inflation can be. Over 40 and 50 years the difference between the pre- and post-inflation value of your notional investment fund is even wider still. Inflation at just 2% can wipe out as much as a half to two thirds of the amount you would have had if there had been no inflation.
If we now go back and look again at the table of returns from the main asset classes, you can see the importance of looking at inflation-adjusted figures rather than the raw returns. We can translate the actual returns on offer over the last few decades and translate them into what they would be worth today, given a range of different starting points. The annualised rates of return may appear very modest, but in practice, thanks to compounding, they have generated significant sums for anyone who has been able to go down the investing route.
|
Real value of £1,000 invested |
||||||
|
At historical rates of return |
||||||
|
Number of years invested |
||||||
|
10 |
20 |
30 |
50 |
|||
|
Equities |
£1,495 |
£2,458 |
£6,078 |
£13,869 |
||
|
Conventional gilts |
£1,438 |
£2,704 |
£4,576 |
£4,602 |
||
|
Commercial property |
£1,305 |
£2,951 |
£5,055 |
- |
||
|
Residential property |
£970 |
£2,068 |
£2,037 |
- |
||
|
Index-linked gilts |
£1,411 |
£2,366 |
£3,151 |
- |
||
|
Cash |
£932 |
£1,245 |
£2,098 |
£2,105 |
||
|
Building society |
£860 |
£1,000 |
£1,473 |
£1,489 |
||
|
Historic inflation rate |
3.1% |
2.9% |
3.5% |
5.6% |
||
Table 2.4: Long run returns in monetary terms.
It is easier to grasp what real returns mean in practice by expressing the figures in the table above as cash sums – the amount you would have had at the end of each time period, again after adjusting for inflation. The points to note are (a) that the wonder of compounding helps returns grow disproportionately large as time goes by; (b) that investing in the right assets can make a material difference to your wealth; and (c) that so-called risk assets like shares and property tend to produce the highest returns over time, although not consistently over all periods.
See your finances in the round
One of the biggest mistakes I have found people make is failing to see their finances in the round. They tend to think of their house, their pension, their investments and their cash reserves as distinct ‘buckets’, rather than as what they really are: just different elements of one bigger picture. The various pieces may have different tax and risk characteristics, which certainly need to be taken into account, but in reality it is the overall balance of your money that is going to determine how well you fare in achieving your objectives.
Most people want to own their own home and that typically provides them with nearly all the exposure to property they need (although buy-to-let has become a fashionable option which I discuss later2). The biggest question for DIY investors is mainly about how they divide up their remaining financial assets between equities, bonds and cash. Bonds and cash are typically used to provide lower but more certain returns, while equities provide the best hope, other than property, for beating inflation and achieving higher but less certain capital and income gains over the longer term.
From the tables you can also clearly see that equities and property have historically provided the highest returns, both before and more importantly after adjusting for inflation. They are sometimes called ‘real assets’ for this reason. These higher returns come at a price, however, which is much greater volatility. What that means is that while they typically produce the best results in the end, you have to live with the fact that their value moves up and down more dramatically from one year to the next. That makes them inherently riskier, at least in the short term.
It is important also to note that the long-term averages are just that – averages. The pattern of returns from the four main asset classes can vary a lot from one period to the next. In the next table I show the annual rates of return of the big four asset classes from one ten-year period to the next, going back to the start of the 20th century (we don’t have good enough data for the others going back that far). The first half of the 20th century, for example, which included two world wars, produced a very different pattern of returns to the second half, which was more peaceful but included a period of very high global inflation.
The ranking of the four asset classes can also change over time. Over the long run, equities come out on top, ahead of property, followed by bonds and cash – but there is nothing pre-ordained about that result. In any ten or 20-year period the order can be reversed, depending on the prevailing historical circumstances. What works best at one point won’t work so well at another. For example, if you use the figures from 1990, they show that government bonds (also known as gilts) have produced almost exactly the same return as those of shares – something that has happened rarely in the past. (There are some specific reasons for that, mainly to do with the fact that the last 30 years have been marked by a long and steady decline in the level of interest rates, not just in the UK but in most countries around the world. Falling interest rates are generally good for fixed-interest securities like bonds, and vice versa.)
|
Real investment returns (% pa) |
||||
|
|
Equities |
Gilts |
Index-linked |
Cash |
|
1904–1914 |
2.1 |
-0.1 |
|
1.5 |
|
1914–24 |
0.4 |
-3.1 |
|
-1.7 |
|
1924–34 |
9.2 |
11.7 |
|
5.6 |
|
1934–44 |
3.0 |
-1.4 |
|
-2.4 |
|
1944–54 |
5.3 |
-2.6 |
|
-2.8 |
|
1954–64 |
7.1 |
-2.6 |
|
1.4 |
|
1964–74 |
-6.0 |
-6.3 |
|
0.0 |
|
1974–84 |
17.4 |
5.6 |
|
-0.3 |
|
1984–94 |
9.4 |
5.8 |
2.8 |
5.5 |
|
1994–2004 |
5.0 |
6.5 |
5.3 |
3.0 |
|
2004–2014 |
4.1 |
3.7 |
3.5 |
-0.7 |
Table 2.5. Real investment returns by decade.
Every decade in history produces a different pattern of returns by asset class. But there has only been one decade since the start of the 20th century when equities produced negative returns, and several when gilts and cash did so – in every case as the result of inflation eroding the real value of investors’ savings. The trouble is that while equities produce the best long-term returns, they have fallen more than once by as much as 50% over shorter periods than a decade, which scares many people out of sticking with them. The first index-linked gilt was issued in 1981 so there is no earlier history.
Source: Barclays Research
The final point to make here is that a lot depends on when you start investing and whether the asset classes you buy are relatively cheap or expensive at the time you buy them. The cheaper they are, the better they are likely to perform over time – that is common sense. If they are expensive, the odds are you won’t do as well as the historical averages. While there is no guarantee that future rates of return will be similar to those achieved in the past, the historical pattern is sufficiently consistent to make it reasonable to use the averages as a general starting point for looking to what might happen in the future. Learning to assess whether the price of financial assets are a bargain or a steal is an important part of the investor’s challenge. If you can invest regularly – so much a month – the valuation issue is not quite so important, as things tend to even out over time.
The importance of avoiding taxes
The figures I have quoted take no account of tax. It is obvious that the more tax you can avoid paying as your investments grow, the bigger the amount you will have left at the end of the process. Back in the 1970s it was difficult to avoid paying tax on investment gains. Today that is no longer the case, thanks to those powerful tax incentives which I mentioned in chapter 1 (see ‘ISAs, SIPPs and pensions’ on the next page). An important reason why it so essential to make maximum use of the tax allowances and other exemptions that the government makes available is that any money you can save and avoid paying tax on can also benefit from the wonders of compounding.
Think of it like this. Every £1,000 you can save legitimately from the grasp of the taxman each year is freed to go on growing for the rest of your life if you invest it – becoming, potentially, a huge and tidy sum. If you can save an extra £1,000 a year by avoiding tax for the next 40 years, assuming that money can be invested to make a return of 5% a year, the extra you have saved and invested will be worth no less than £134,000 at the end of that period. Put it another way: if you are lucky enough to be able to save £8,000 a year from the taxman, it could be worth more than £1 million by the time you retire 40 years later.
ISAs, SIPPs and pensions
The first thing any investor should do is check out the tax breaks which the government offers to those who save and invest. There are different advantages to saving into an Individual Savings Account (an ISA) and saving for a pension. In my view, most people should aim to do both as soon as they can. The chancellor also announced in 2015 that the first £5,000 of dividend income from shares and the first £1,000 of interest on bank and building society deposits, even if held outside an ISA ‘tax wrapper’, can also be received free of income tax.
The attraction of ISAs is that any gains and income you receive from the investments you hold within this tax wrapper will remain exempt from tax, whatever the amounts involved, and however long you hold them. The annual limit on the amount you can pay each year into an ISA is now more than £15,000 and the limits are normally increased each year, meaning that for most people all their investing can effectively be done tax-free. Funds, shares and cash are all capable of being held inside an ISA. Any money held in an ISA does not have to be included in your annual tax return.
The tax savings on pension contributions can potentially be even greater, as the basic principle is that any contributions you make to your pension scheme (whether it is a personal pension or a company scheme) qualify for tax relief up to certain annual and lifetime limits.As of 2015, if you are a higher-rate taxpayer that means every £100 you put aside for your pension effectively reduces your income tax bill by 40% of that amount. For standard-rate taxpayers, the rate is 20%.
Self-invested personal pensions, known as SIPPs, have become popular vehicles for many investors, although the government continues – annoyingly – to change the rules on how much tax relief you can receive from one year to the next. In 2015, except for the highest earners, who are more harshly treated, the maximum annual contribution you could claim tax relief for was set at £40,000 a year. There was also a lifetime limit of £1m. (The annual limits are a relatively new thing, and there may be scope to add more money by using up prior year allowances that have been not used.)
The great advantage of an ISA is that you can take the capital out at any time without having to pay any further tax, whereas with any kind of pension, under the current rules, you can only take out a maximum of 25% of your accumulated savings as tax-free cash after the age of 55. Any additional withdrawals, however you take them, are taxable at your marginal tax rate. Under the latest government rules, you are no longer required to buy an annuity at the age of 75, as was the case before.
Confused? Understanding what is going on in the pensions field is frankly a bit of a nightmare, as the rules change almost every year (and will do again in 2016). It is one area where specialist advice is definitely worth taking. The good news is that there is plenty of information about the pension rules online – both on official government sites and elsewhere.
A good investment platform will summarise the latest rules for you and my advice is that you should check what they are at least once a year. The key point is that investing in a pension, as with an ISA, is a highly tax-efficient way to invest and one of the obvious options for any would-be DIY investor to consider.
Don’t forget costs
As well as taxes, the figures I have quoted about asset-class returns also exclude the cost of investing. Any kind of investment inevitably carries costs with it. The higher the cost, the better the investment has to do in order to justify what you have paid for it. Unfortunately, the real cost of investing is often much higher than it may appear, as we’ll cover later in this book. It is vitally important to understand exactly what costs you are incurring. Only then can you know if they are worth it or whether they are going to eat too far into the returns you can make as an investor. It makes a huge difference whether an investment that earns 5% a year costs 1% or 2% per annum to own. The good news is that the costs of investing are starting to come down and DIY investing has become more cost-effective than in the past.
Putting it all together
To summarise, how much money your investments will make over time depends on the investment returns you can obtain after the deduction of tax and costs. What you can then do with that money will be determined by how successful you are in beating inflation. Your objective is to maximise the ‘real’ return on your investments after taking account of taxes, costs and one other crucial factor – risk. Different types of investment carry different levels of risk. Shares, for example, are generally riskier than fixed-income investments. A riskier investment is one that may produce a higher rate of return, but only at the cost of a higher chance of loss.
The only certain way to reduce your risk is to diversify: to spread your investments across a range of different investments. Not all types of investment move in tandem, so a well-balanced portfolio will not rise and fall as dramatically as one that has all its eggs in one basket – say, 100% in shares or property. In general, you have a better chance of obtaining a higher rate of return from a risky investment the longer you are able to hold it. It follows that the more years of investing you have ahead of you, the greater the chance of doing exceptionally – rather than averagely – well. It also follows that the earlier in life you can start investing for the future, the better off you stand to become.
Whatever you are investing for, the minimum length of time you should think about when planning an investment programme, I suggest, is five years – ideally even longer. Good investing is like an ideal marriage: you hope that it will last the whole of your life. Sometimes you may be pleasantly surprised to reach your target ahead of time, but don’t count on it. If you really do need the money on a shorter time horizon, you should consider more certain homes for your money, such as cash or fixed interest, even though the returns will almost certainly be much lower. You should only ever think about investing capital in riskier asset classes knowing that in the short term it could decline in value.
|
Equity performance |
||||||
|
Number of consecutive years |
||||||
|
|
2 |
3 |
4 |
5 |
10 |
18 |
|
Outperform cash |
77 |
79 |
81 |
83 |
96 |
97 |
|
Underperform cash |
37 |
43 |
31 |
28 |
10 |
1 |
|
Total number of years |
114 |
113 |
112 |
111 |
106 |
98 |
|
Probability of equity outperformance |
68% |
70% |
72% |
75% |
91% |
99% |
|
Outperform gilts |
78 |
84 |
84 |
81 |
84 |
85 |
|
Underperform gilts |
36 |
29 |
28 |
30 |
22 |
13 |
|
Total number of years |
114 |
113 |
112 |
111 |
106 |
98 |
|
Probability of equity outperformance |
68% |
74% |
75% |
73% |
79% |
87% |
Table 2.6: The odds on equities outperforming gilts and cash.
As long as history repeats itself, the longer you own a portfolio of shares, the more likely it is that they will do better than safer alternatives such as cash or gilts. Over five years, in both cases the chances that you will do better from equities is around 75% on this basis.
The good news for any investor who starts early is that the longer you can invest the better you are likely to do – and the more certain your returns are going to be. As the next chart illustrates, the range of returns from different asset classes narrows with the passage of time: the good and bad years tend to cancel each other out. In the same way the likelihood that riskier assets such as equities and property will outperform increases the longer you are able to hold them. Historically, if you are able to own equities for more than 20 years, the odds are over 90% that you will do better than keeping your money in cash.
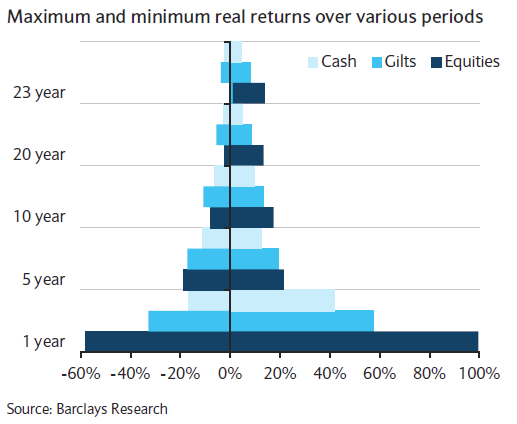
Figure 2.3: How the passage of time reduces the variability of asset class returns.
Source: Barclays Equity Gilt Study 2015.
Projecting future returns is never easy and it is only fair to say that it is particularly hazardous today. The years since the financial crisis in 2008 have been characterised by very different conditions to earlier historical periods. With interest rates at such unprecedentedly low levels, no period in my lifetime has been quite like it. Policymakers have set out to make it easier for everyone – governments, businesses and individuals – to cope with the aftermath of the crisis, which has left the world lumbered with massive and unprecedented amounts of debt.
On the plus side, the low-interest policy has slashed the cost of mortgages and provided short-term relief for many of those struggling to repay what they owe. The downside is that the policy has also heavily distorted the traditional ways of valuing financial assets – working out, in other words, whether shares and bonds are cheap, expensive or about fair value. In practice the policy has had the effect of driving up the price of many financial assets to what seem very high levels by historical standards. However, you can be sure that it is not going to stay that way for ever.
The bottom line
Taking all these factors into account should allow you to come up with a figure for the kind of financial contribution or regular investment you are likely to need, and an idea of how long you will have to make it, in order to have a reasonable chance of meeting your financial targets in the future. I go on in the rest of the book to explain how to use investment funds to achieve the kind of objective that you might set yourself having done such an exercise.
Here is a simple example. Suppose you invest £5,000 a year for 30 years – how much will you have at the end? I have worked out some illustrative figures, based on the following assumptions. The investor has no tax to pay, thanks to using an ISA. The money is invested 65% in the stock market, 25% in different types of bonds, 10% in property and 5% in cash. Inflation averages 2%. Real rates of return assumed are equities 5%, bonds 2%, property 5% and cash 1%. The investor, as I do, uses funds to obtain the property and equity weightings. I have deducted representative fees from those funds. This produces overall rate of return of 5.6% per annum before and 3.6% after inflation.
Remember that this is a theoretical exercise. There is no guarantee that the results will be as I have said.3 If my assumptions turn out to be valid, however, you will have around £385,000 at the end of the period, having invested £150,000 along the way. After 40 years, with the full effect of long-run compounding coming through, your investment pot will nearly have doubled again, to approximately £725,000 in value.
There are two ways in which you might react to these figures. One is to say, “Gosh, those final numbers are surprisingly large, even for what seem like very small rates of return.” The other is to say: “Oh dear, even if I am lucky and get a reasonably high rate of return, I am still not going to end up with enough for my future needs.” In reality both responses are perfectly valid. On the one hand it is rare that I meet anyone who has done this kind of planning exercise who comes away thinking, “I am investing too much.” Most people, I know from experience, should be doing a lot more than they are. On the other hand I also rarely come across anyone who isn’t heartened and encouraged by the remarkable way in which even little sums, saved regularly, can compound over time into something much bigger.
You can see again from this example how the value of the investments starts to grow faster as the number of years goes up – that is compounding again. By the end of the 30-year period, the value of your investments will be 2.57 times the amount you have put in. Of course in the real world, the progress won’t be as smooth as this. There will be lots of ups and downs along the way. But note also this: if you could improve the annual rate of return by just 2% per annum, the final sum would not be 2.57, but 3.53 times as great as the total amount you put aside – an extra £175,000 in round figures! Small differences in investment returns can make for hugely different outcomes if you let time do its work. It is all the more reason to get started straightaway, however small the amount you can afford – and all the more reason to put an effort into finding the best extra unit of return.
Lump sums or regular contributions?
Is it better to invest a lump sum or make regular contributions to your investment pot? My answer is: it does not necessarily matter. In real life most of us combine periods when we are able to save regularly with others when we are unable to afford anything at all. Once every few years you may find yourself with a one-off lump sum to invest – from a legacy perhaps, or redundancy, or the payoff from some shares or share options. My advice to clients tends to be: try to save what you can afford on a regular basis, but be willing and happy to top it up with a bigger sum if and when a cash windfall comes along. Think of regular investing as good discipline and one-off sums as a welcome bonus.
Sensible to start simply
In the old days, when I met a person with a lump sum, in order to give them some guidance I would normally start by saying something like: “Why not split the lump sum into thirds – one third cash, one third fixed-interest and one third equities?” I still think that is a good starting point for newcomers to investing; it is easy to remember and there is logic behind it. It recognises that the important thing for any investor is to become comfortable with what they are trying to do. As you go on and get more experienced, and as your circumstances change, you can start to think of changing the percentages and giving more thought to how you split up the three components (What kind of equities? What kind of bonds? And so on), as I did in the example above.
Is having a third of your money in cash a good idea as a starting point? Between 2000 and 2008 the answer was clearly yes – interest rates on cash were much higher then (and we all stupidly thought that banks knew what they were doing and money deposited with them was safe!). It is harder to justify today when interest rates are so low, but you always need to compare the return, as I have said, with both your actual cost of living and your appetite for risk. If the prices of the things you need or want are falling, even cash that earns no interest can still leave you better off at the end of the year and you have not risked losing anything in the process.
To take another example, if you’ve just retired or are coming up to retirement, you also might want to start off with at least 50% in cash. Why? Because you can’t be quite sure how things will go in your first couple of years of retirement. People often find that what they actually spend is different to what they expected. You should not be in a rush to tie all your money up straight away. It is always a good idea to stop and think what you’re trying to do. Look at all the options and take your time. You won’t regret it. It is a big decision you are making.
For those who are starting out, or investing on a regular basis while still quite young, the issues are not so difficult. The younger you are, and the longer you have to see your investments bear fruit, the more logical it is to put more of your money into riskier equities and property. If you can afford to wait for the good years to cancel out the bad, and are investing on a regular basis, it matters much less whether what you are buying appears cheap or expensive. As the years go by, the price you pay for what you own will average out, and the returns you get will move closer to the long-run historical averages. The weightings that I used in the long-term portfolio example above (60% in equities, 25% in bonds, 10% in property and 5% in cash) might be more appropriate.
Once you have been through the planning exercise, the next challenge is how to make the investments that will give you the best chance of meeting the objectives you have worked out in your financial plan. This is where funds and investment platforms come into their own.
Points to remember
- The primary objective of investment is to improve your quality of life.
- Money spent on a financial plan is almost always money well-spent.
- If you do nothing with your money, you cannot end up with any more than you started with.
- Asset-allocation means deciding how to allocate your money between equities, bonds, property and cash.
- Wealth only grows if you can outpace inflation in the things you want or need.
- Shares and property have provided the highest returns historically, but bonds have done equally well since 1990.
- Small increases in rates of return can be extremely valuable if you let time do its work.
- Whatever else you do, make sure you take advantage of tax breaks on ISAs and pension contributions.
1 ‘Real’ is the word that economists use to describe what something is worth after deducting the effect of inflation.
2 See chapter 8 for my thoughts on buy-to-let.
3 Because this is a long-run planning exercise, I am assuming that returns will at some stage revert to their long-run historical averages. The money invested today, as opposed to in future years, may produce lower returns, given relatively high valuations at the time of writing.