Chapter 5. How to Pick the Best Funds
Choosing the right fund for your purposes is probably the most difficult decision you have to make as an investor. It can turn out to be more important than your broad asset allocation, crucial though that also is. I have already touched on some of the important factors to consider in the last chapter. Here are some more detailed thoughts on the various facets of distinguishing what makes a good fund from a bad one.
When reading it, you should bear in mind my earlier observation that 90% of funds on offer are probably not worth the money you are being asked to own them – but the ones that are very good are, and they are obviously the ones that you want to have.
Funds and fund companies
I believe that many people choose their investments the wrong way round. They go for a fund company first and only then decide on which fund or funds to buy. In my experience you will do better to look for a good fund first, the one that gives you the best exposure to its chosen country, sector or theme. Which fund management company runs the fund, while not at all unimportant, should be the secondary factor. The size or reputation of the company running the fund is not as important as many investors seem to believe.
It is true that some of the larger companies offering funds have higher profiles, but that does not mean that they are necessarily superior. It may just be that they spend more money on advertising and marketing – an expense which, incidentally, is ultimately paid for by you as the fund investor. Most of the biggest fund companies offer a wide range of funds, knowing that some will do better than others, but there is no guarantee that all of them will be of the same standard, as so much depends on the skills and experience of the individual fund manager. I have already mentioned the generally disappointing performance of funds offered by the big banks. Personally I have rarely owned more than two funds from the same stable.
The good news is that there is a lot of competition within the fund management industry. This means that new names are appearing all the time. Starting a fund management company can be a very lucrative business, even if it starts small. Small ‘boutique’ fund management companies often start with just two or three funds, typically in niche areas. Quite often they will be started by experienced fund managers who have become frustrated working within a big company environment, where they can find themselves spending more time managing other people than doing what they do best, which is making investment decisions. By setting up on their own they become owner-managers with a significant ownership stake in their business. This not only gives them an incentive to perform, but also means they are less likely to leave or be poached by other companies, something which is a constant aggravation for both advisors and private investors alike.
Boutique firms of this kind, where managers take control of their own business, are often well worth following. While the company itself may not have a track record, the fund manager running the funds usually does. Artemis and Lindsell Train, to give just two examples, both started out with little or no money to manage, but now run many billions of pounds successfully for investors. The most prominent recent example of a fund manager setting up on his own is Neil Woodford. He left the giant Invesco Perpetual in 2014 after 25 years to start his own business, Woodford Investment Management. Sanditon and Crux are two other recent examples where experienced fund managers have left to set up on their own. There is no reason why investors should not look to have both large and small groups within a portfolio.
Remember too that in some cases the early years of a new fund, if it is run by an experienced professional, are the best time to be invested. If you wait for a three-year track record to develop at the fund manager’s new home, you may miss some of the best opportunities. Why is that? Because when funds are still getting off the ground, the fund managers have more flexibility to back their highest-conviction ideas. A common problem with larger firm funds is that the fund reaches such a size that it becomes more difficult for the manager to find the opportunities he could do when the fund was much smaller.
Investment style
The investment style of a fund can have a huge bearing on the performance of your portfolio, something which is not always well-understood by many private investors (or for that matter many financial advisors). One of the most important style differences between funds is that between a ‘growth’ and a ‘value’ approach. A growth manager is primarily interested in companies with strong earnings or profits growth. This typically leads them to have a high exposure to companies which pay little by way of dividends. A value manager, on the other hand, looks at companies whose valuation appears cheap when compared with its profits, cash flow, dividends or assets. This in turn often means a predominant exposure to shares with good dividends.
Value investing has the better long-term record. The trouble is that both styles can go in and out of fashion, sometimes for years at a time. Some of the time growth beats value, and some of the time – more often, in fact – it is the other way round. Figure 5.1 shows how the two different styles have swung in and out of favour since 1990. If you buy a fund with a value approach, represented here by the high-yield index, you will do better when that style is in favour, as it has been for most of the time recently. Although value investing produces the best long-term results, you cannot rely on it doing so every year. This kind of change in performance has little to do with the skills of the fund manager. It is purely the result of a style shift.
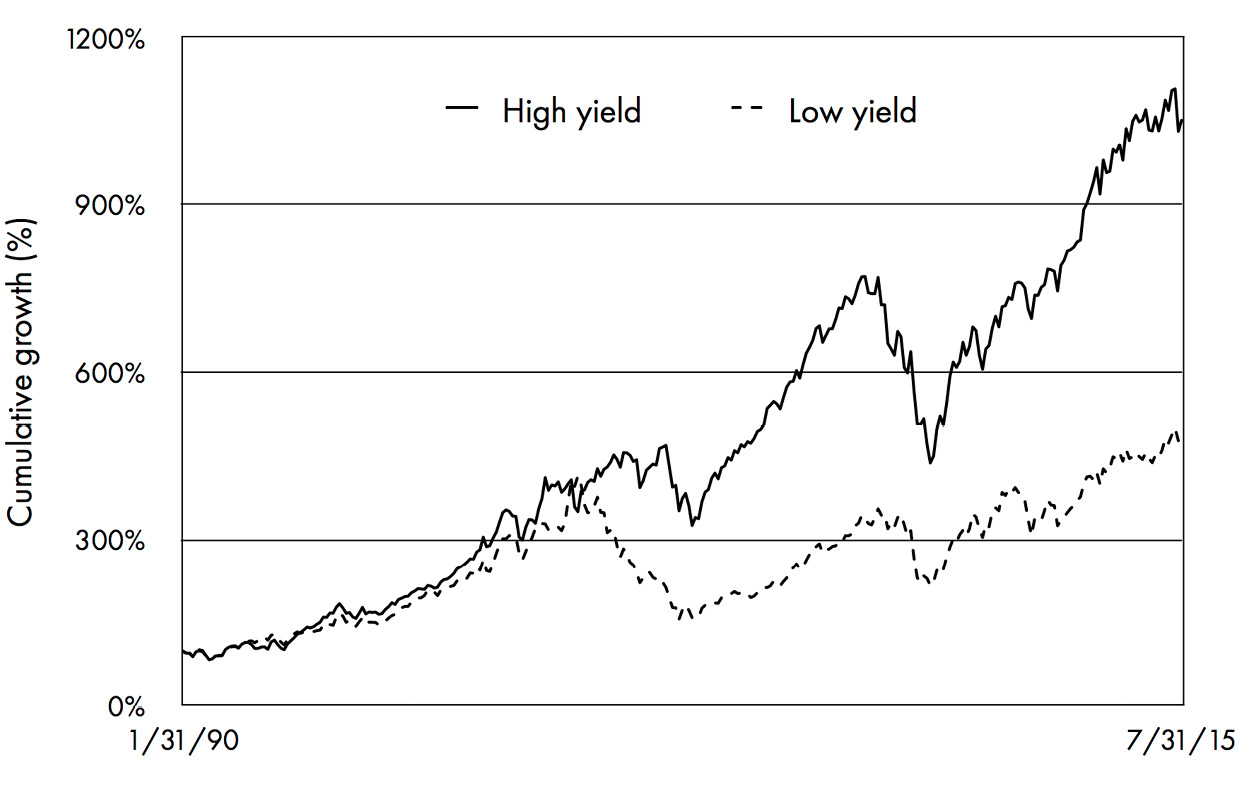
Figure 5.1. How investment styles come in and out of fashion.
It is true that some funds are blended, leaving their managers to have both styles represented in their portfolios. Their objective is then to try and vary the weight of each style, according to their reading of which style is likely to be next in favour. The difficulty is that these style shifts are notoriously difficult to time correctly. The results of getting them wrong can be painful. As a fund investor yourself, you can neutralise style effects by having both types of fund in your portfolio, but to do that requires an additional level of research. Most fund companies and platforms describe the investment approach of specific funds, while the Morningstar website classifies funds on a nine-box style matrix, designed to show the extent to which a fund veers towards large or small-cap shares and whether it is biased towards growth or value. This can be a useful starting point for further analysis.
Small caps for the longer term
The size of the companies whose shares an equity fund manager is buying needs considering because of the broad cycles that favour one or the other at any one time. At certain times so-called blue chips, the largest companies with household names, will perform better than small companies, and vice versa at other times. Between 1996 and 1998, for example, blue chips had a very strong run all over the world. Portfolios which were over exposed to mid-sized and smaller companies, their lesser brethren, were left lagging far behind. Then in 1999, when the valuation difference had become extreme, small companies started one of their strongest runs for years.
Since 2000, smaller companies have generally produced much stronger performance, and this has benefitted a number of specialist small-cap fund managers, such as Giles Hargreave, Harry Nimmo and Dan Nickols. Their funds have naturally attracted strong inflows on the back of their stronger performance. But that cannot continue indefinitely. Small company specialist funds, being more volatile, fell more sharply than large-cap funds during the bear market of 2007–09. And despite recovering strongly after that, since the start of 2014 smaller company funds have again mostly lagged behind.
Predicting whether large or smaller company funds will do better is difficult, so it makes sense to keep a balance between the two. Over the very long run, smaller company funds have generally outperformed larger ones, in part because they are higher-risk – when markets fall, small-cap funds fall faster and further. You might think it makes sense to have, say, 50% in larger companies and 50% in smaller company funds. However, it is worth remembering that when commentators talk about ‘the market’ in the UK or US, they typically mean the blue-chip indices like the Dow Jones in the United States and the FTSE 100 in the UK. If you look at the market value of the companies in those indices, they dwarf everything else.
Measured by market capitalisation, the 100 companies that make up the FTSE 100 index represent as much as 85% of the FTSE All-Share Index. The ten largest companies account for roughly 40% of the value of the index. If your portfolio only has a 50% weighting in FTSE 100 stocks, you are effectively making a big bet that smaller companies will outperform larger ones. That will work quite well a lot of the time, but in the long run you will not do as well as you expect. In practice most actively managed investment funds have a bias towards stocks outside the FTSE 100 index, so it is easy to find yourselves inadvertently making a smaller company bet without realising it. Yet again, therefore, it pays to look carefully at how and where your fund managers are investing your money.
Making sense of performance figures
This leads us on to the use of past-performance data. It is obviously right that funds should disclose as much information as possible about their past performance. For a number of years, before regulators stepped in to insist on standardised reporting of results, fund managers had much greater flexibility to present their figures in the most favourable light. Now that every company has to present its figures the same way, the risk that you will be given misleading information has reduced, although the amount of information you get may also reduce too. While that is a positive step forward, it does not mean that you are out of the woods. Interpreting past performance is a notoriously complex and difficult task.
When I talk to investors, I always stress that past performance should be only one of the tools to look at when you are considering a fund. The regulators insist that every fund has to remind investors that past performance is not a guide to future performance, and that is absolutely right. First-time investors often assume that if a fund has done well in the past, it will continue to do so. But that is clearly not the case. As we have seen, the standout feature of investment markets is that they move in cycles. Bull markets are followed by bear markets – and within each of those phases, at different times not only will smaller companies do better or worse than large ones, but some sectors will do better or worse than others and the same goes for individual companies and countries.
There are so many moving parts that determine which investments do well and which do not, in other words, that it makes interpreting fund performance highly complex. A fund that invests in smaller companies will obviously do better when smaller companies are in favour and less well when they are not. Paradoxically, the fact that it has done better than a large company fund over the past five years actually makes it less likely that it will do better in the next five years, because these style shifts tend to even out over time.
And all this is before we even consider whether the manager of a fund has added any value through his or her efforts. Suppose you are looking at two equity income funds that have exactly the same objective: does the fact that one has done better than the other over, say, the past three years tell you anything about how good the fund manager is – and just as importantly, whether or not the fund will also do better over the next three years? What if one fund has done better over one year and the other over three years? You have to dig pretty deep to come to a conclusion on which fund is worth buying.
In my experience past performance is certainly not a guarantee of future returns, but it can be a useful indicator as to when to buy or sell a fund. To take an extreme example, if the past performance figures show a fund is up by 100% in the last year, that might well be telling you to avoid buying the fund now, because in the short term what is in the fund is more than likely to be fully valued – otherwise it could not have done so well. Conversely a fund with poor performance over the previous year might just be telling you the opposite story.
In each case, you need to find out more about why performance has been good or bad. This involves asking some of these kind of questions:
- Has the fund manager made mistakes on either stock selection or asset allocation?
- Is the investment style out of sorts with the market – for example, is the fund manager a value manager when growth is taking off?
- Has a new manager been appointed with a different investment philosophy and style?
- Is the group involved in a merger? This can often mean fund managers taking their eye off the ball as they are more concerned about their own jobs.
- Has the fund become too large to be managed effectively?
Most of this information can now be found by digging around on websites, in newspapers and in the fund fact sheets you can get online through platforms. Most good websites now have charting functions that allow you to see how a fund has performed day by day, or month by month, over different periods of time. You can then compare that performance to that of other similar funds or the relevant market index. Some sites also include basic risk information, such as the volatility of returns – though not a perfect measure of risk by any means, volatility can be a useful indicator of how variable a fund’s returns are likely to be.
Digging out this kind of information and processing it does take time. Putting together the whole picture is what professional analysts like myself are paid to do. At Hargreaves Lansdown we do a lot of quantitative analysis, measuring the risk and style bias of each fund in great detail. We also have the opportunity to talk to fund managers directly, which is critical – as ultimately, even when you have analysed performance figures, you are making a judgment about the ability of the individual responsible for the fund. Experience in interpreting past performance is not something that you can teach in five minutes. If you want your investments to work harder for you, it does take effort. I give some examples of the material you can find online in the appendices.
Be wary of the numbers
One of the problems every investor faces is making sure that the performance data they are seeing is actually correct. We get ours both from Funds Library, a business which collects and distributes fund reports and information, and which we own ourselves, and also from other providers. In both cases we always like to keep checking that the information is correct. That is very hard for a DIY investor to do, as they don’t have easy access to, say, Lipper’s professional fund research, as we do. You can, however, get pretty comprehensive fund data from the likes of FE Trustnet, the Financial Times and Morningstar (quite often it turns out that the information all comes from the same original source). My colleague Lee Gardhouse, who runs our multi-manager offerings, says that he quite often finds that fund companies themselves have got their performance information wrong! Given how much data there is, this may not be entirely a surprise – but it is still a fact of life that we all have to confront.
It is also very important to make sure that you are measuring performance over a long enough period to be meaningful. I have suggested that you really ought to be looking back over at least ten years of performance before you can offer a definitive judgment on how good a fund manager is. Yet finding ten-year data on a public website is very difficult. Most charting packages, for example, don’t go back that far. It is equally important to track a fund manager’s performance over the length of his or her career. The longer a period of outperformance, the more credible it becomes. Figure 5.2 is an example of a very long-term track record, that of Adrian Frost, the manager of the Artemis Income fund. Before Artemis launched this fund, one of my favourites, in 2002, Mr Frost had several years running a fund with the same mandate for Deutsche Bank. (This information is taken from HL’s research for clients, and is not information that is visible in the fund’s own literature.)
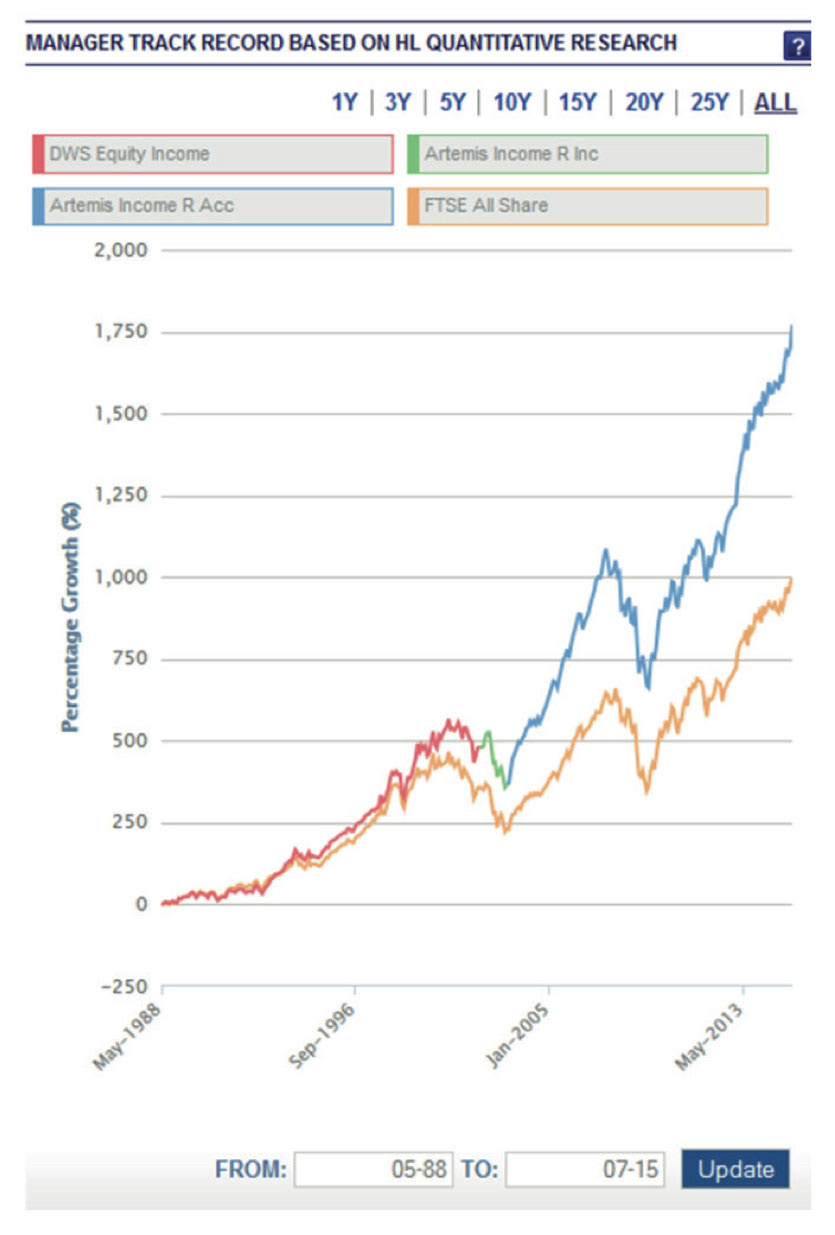
Figure 5.2: Reconstructing a fund manager’s long-term track record. The example here is that of Adrian Frost, manager of the Artemis Income fund.
The 2008 financial crisis provided a classic example of how cycles can influence the typical kind of performance data that you see published. If you looked at the five-year data in 2012, the figures for most funds would still have looked terrible as the five-year period began just as we were about to go into a savage bear market. Yet by the time we reached 2014, the same funds were all showing handsome five-year performance, simply because the performance period started at the point that the market itself was recovering. The following charts give a couple of examples of this apparent dramatic turnaround in fortunes, again using Artemis Income as the example.
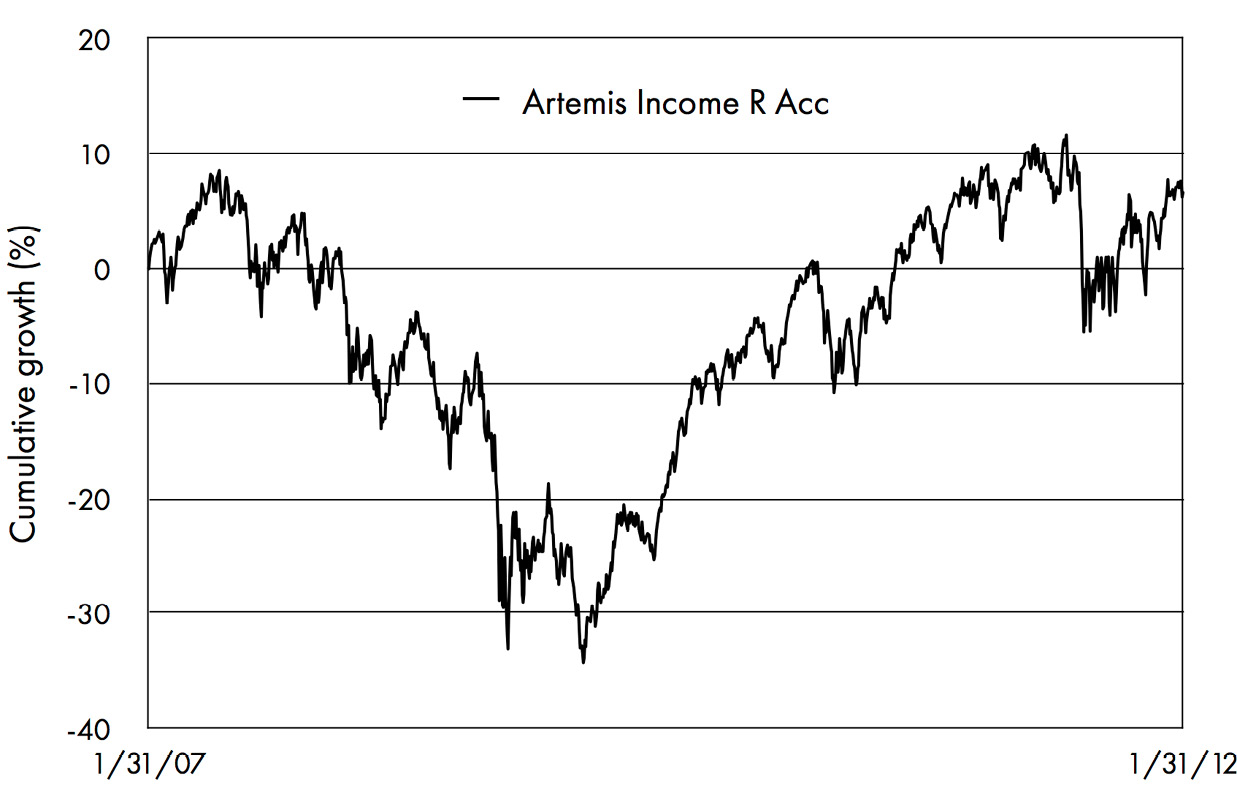
Figure 5.3: The track record of the Artemis Income fund, as it appeared in early 2012.
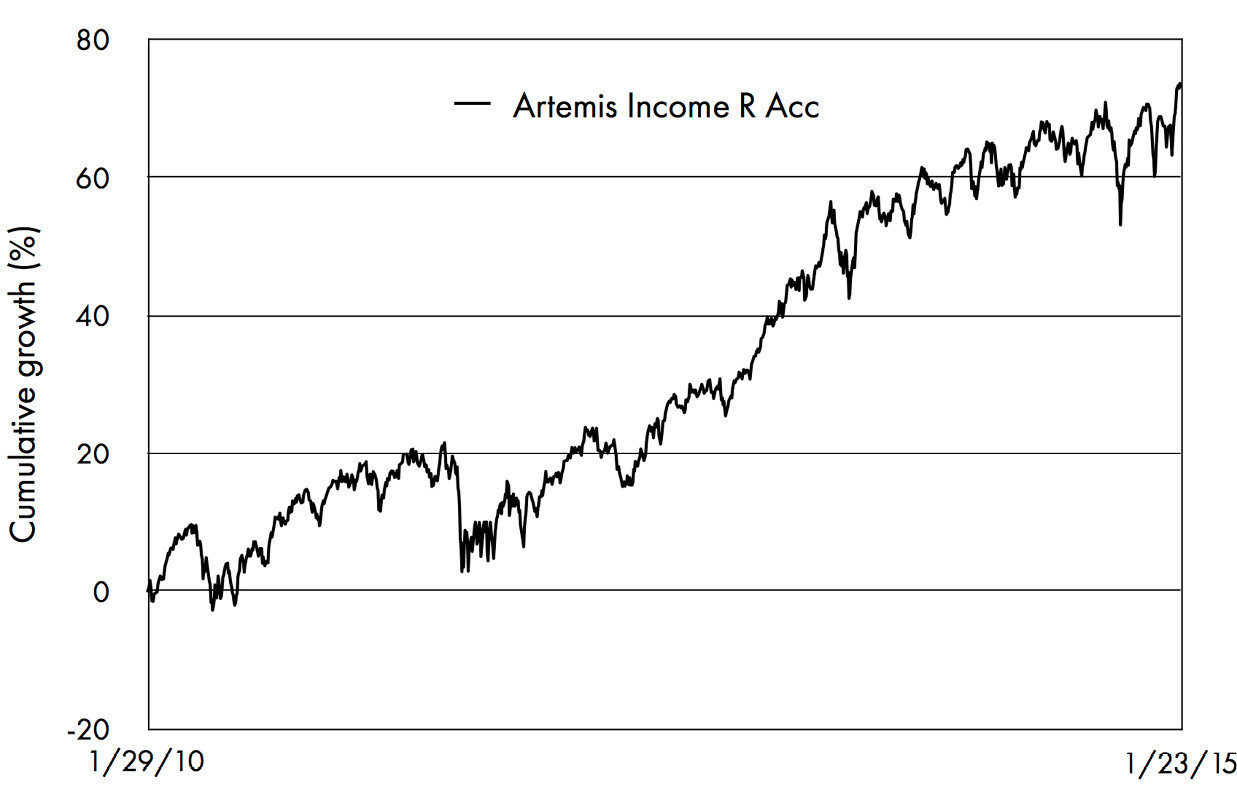
Figure 5.4: The same fund’s performance record, as it appeared in January 2015.
The first chart shows the performance of the fund from January 2007 to January 2012, as it would have appeared in a five-year chart at the time. The second chart shows the performance of the fund over a different five-year period: from January 2010 to January 2015. As you can see, there is quite a difference! The second chart paints a quite different picture to the first. What it tells you is a lot more about what was happening to the stock market as a whole than it does about the fund itself. (As it happens, the fund performed better relative to the market in the first period than in the second, as you can see if you chart the whole period against the performance of the UK stock market.) So don’t be taken in at first sight by how well a fund has done.
The reality is that you can prove almost anything you want if you are careful to choose the most favourable basis for your data. That is one reason why the regulators now insist that all performance data must be presented in a standardised format, although even they still say that five years is a long enough period. Newspapers are particularly prone to falling into the trap of quoting out-of-context performance numbers so as to make a good story. They are particularly fond of reporting that such and such fund manager is a new star of the industry, or alternatively has lost his touch, all based on one poor period. It even happened to Anthony Bolton, one of the most successful of all postwar UK fund managers, when he came out of retirement to run a Chinese fund in Hong Kong for his company Fidelity.
Using charts to analyse performance
Looking at performance charts, as I have suggested, can be a very helpful tool in trying to understand what funds have done and how one fund differs from another. Until quite recently customisable charts weren’t readily available to the amateur investor. You could find tables of fund performance in specialist periodicals such as Money Management, but that was it. The internet has changed all that. These days there are scores of charting services on fund websites and all the best platforms allow you to compare funds this way. What is more, the range and quality of chart options are improving all the time.
Charts are useful because they can paint a much clearer picture of performance over time than data in a table. You can see in detail how a fund has done over a period of years – the scale of the returns, when it has outperformed and underperformed, how volatile the performance has been, and so on. It is a great way to compare funds as a good chart brings out the important differences in one simple and easy-to-grasp image. You can also compare a fund’s performance against general market indices and the average performance of funds in its peer group. I have found them invaluable when answering investors who have asked why such and such a fund that appears to have done well is not on our list of recommended funds.
Once or twice the answer may be simply that we have missed a good fund, which is always possible, given how many funds there are out there. More often than not, however, I find that investors who think they have a fund which is superior to one of our own choices haven’t really done sufficient homework to understand its real characteristics. Looking at charts would have made it easier for them to see the real picture. The chart below makes the point with a real-life example.
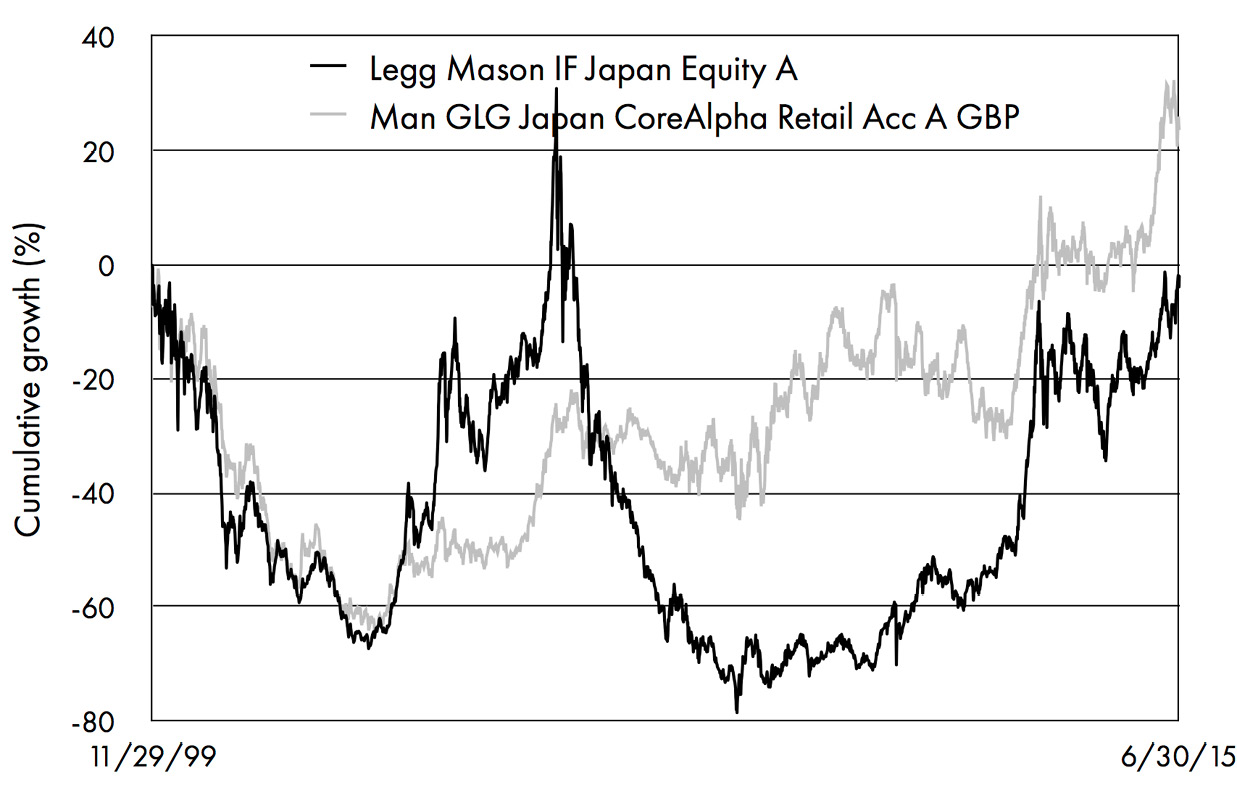
Figure 5.5: A world of difference – two Japanese funds compared.
It compares the performance of two Japanese funds, one managed by Legg Mason and the other by a company called GLG. The latter seldom appears near the top of the performance tables, while the former has been number one more than once. But which one do you as an investor really want? Clients often ask why we are not backing the Legg Mason fund. The chart gives you the answer. You can see how the Legg Mason fund made some huge gains in 2003, 2005 and 2012. If you had timed buying it at just the right moment, you would have made some spectacular gains.
But look also at how dramatically the fund fell from its peak in 2005. It was five years before it once again shot to the top of the performance table, seemingly from nowhere. The GLG fund meanwhile has been making a more prosaic journey. While it has rarely topped the short-term league tables, it has never suffered the same sharp falls either. Over the longer haul, it has been the better and more consistent performer. My conclusion is that the GLG fund is the one that I would rather own.
Note that you might never have known all this if you looked only at current performance numbers. There is a particular trap in looking at one, three and five-year cumulative performance figures. At any given point in time, such as those dates when Legg Mason Japan was shooting out the lights, all the cumulative numbers can look remarkably good. But it is important to look a bit closer. What year-by-year figures lie behind the strong cumulative performance? It may be that they reflect just one great year out of five – the most recent one. The chart will show you the real picture.
Of course, you might also draw a different conclusion from this chart. You may think that all you need to do is buy the Legg Mason fund when it is near the bottom of the performance table and sell it after it has made one of its occasional spectacular gains. Nice idea! By all means try it if you must. But don’t expect me to back you to be able to do it. I wouldn’t back myself to make that kind of timing call and all my experience suggests you won’t be able to do so either.
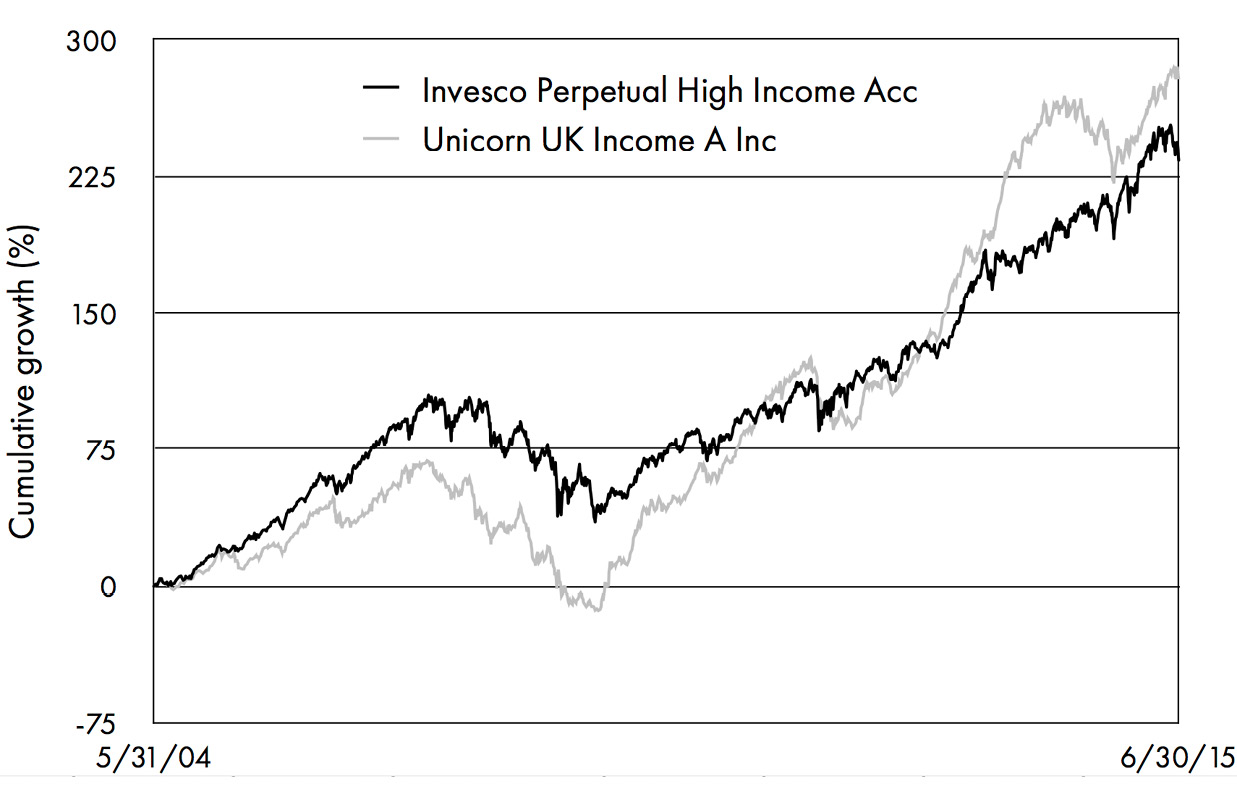
Figure 5.6: Making sense of the picture – two income funds compared.
Here is another example of the kind of insights that a chart can give you. It shows the performance of two well-known income funds, Unicorn Income and Invesco Perpetual High Income, from 2004 until the present. As it happens, both these funds have recently lost their fund managers – sadly, in the case of the Unicorn fund, as a result of the death of John McClure, and in that of the Invesco Perpetual fund, Neil Woodford’s decision to leave the company to set up his own fund management business. For most of the period both funds were classified as equity income funds by the industry trade body (although for daft reasons which I won’t explain here, the Invesco Perpetual fund now finds itself in the All Companies sector).
You can see that overall both funds have done very well. But note also how the journey the two funds have taken has differed. From 2004 until 2009 the Unicorn fund lagged the performance of the Invesco Perpetual fund. Then it suddenly started to rise strongly from the bottom of the bear market in 2009. Since then it has easily performed as the better of the two funds as well as becoming one of the very top performers in the equity income sector.
How to explain that turnaround in fortune? Well, John McClure was always a good manager, well-connected and with bags of experience. What made the real difference was that after 2009 there was a huge rally in small and mid-cap stocks, one that broadly lasted until March 2014 and during which they easily outperformed large-cap stocks. It was this change in investment style which explains most of Unicorn’s superior performance over this particular period. Being so much larger, the Invesco Perpetual fund inevitably had more invested in large-cap companies. There was no way that it could have matched the performance of its smaller counterpart.
Does that make it a worse fund? No. The conclusion I draw from this chart is different to the first one. While the two funds have a similar objective, the way they operate guarantees that they will fare differently in different market conditions. When small-cap stocks do particularly well, so too will the Unicorn fund. When large caps are in the ascendant, it is the Invesco Perpetual fund which is likely to outperform. None of this is difficult to grasp, but investors have to do the work to find out what is going on under the bonnet of a fund.
Charts help enormously in this respect: comparing the performance of these two funds with, say, the FTSE 100 index (as a proxy for large-cap stocks) and the FTSE All-Share or Smaller Companies indices would have quickly brought the different nature of the two funds. Unless you feel you have the skills to call the turns in investment styles, which is generally no easier than calling the tops and bottoms of bull and bear markets, it is not a bad strategy to have more than one equity income fund, each one with its own different style. I comment on this further in chapter 7.
Keeping it simple
As a performance track record can always hide things, what you want from a fund manager is a consistency of style and approach. The other day I was asked by an up-and-coming young fund manager what he should do to convince me that he had the makings of a top professional. I said, “You’ve got to be able to sit down and tell me what you do and what your philosophy is in no more than five minutes.” It should be fairly simple. My experience over 30 years is that if the approach sounds complicated, and you have to go into a dark room and hit yourself over the head to try and understand it, then you shouldn’t touch it.
In fact, if I had just one piece of advice to give anyone, it would be just that: keep it simple. What has enabled me (touch wood) to avoid most of the really bad investments I have come across over the years in financial services is recognising that complexity is normally a red flag. Investment isn’t really that complicated, although a lot of professionals try to make it as complicated as possible in order to impress you with how clever they are. Neil Woodford is very good at communicating his simple philosophy and latest ideas. It is easy to understand what he is saying and he says it in about three minutes flat.
The ability to articulate what you do, simply and consistently, is what I am looking for when conducting face-to-face interviews with fund managers. I always write up my notes and do further analysis, but at heart that’s what I am really after. The fund managers should be able to tell me very quickly what they do and why. Everyone can say something like, “We look to buy quality companies”, and while that may sound like a great line, so what? Who is out there actually looking to buy rubbish? What we have to do is get underneath the surface and say, “What do you mean by a quality company”? The best fund managers make what they do sound like simple common sense. The ones who try to sound brilliant, usually from Oxford and Cambridge by the way, often make it more complicated for themselves!
Although it is not easy for DIY investors to get to meet the best-known fund managers in person, there are plenty of video interviews around these days so that if you start looking you can usually get to see what the person running the fund you are interested in has to say for themselves. HL carries a number of them on our website and you can also try websites like Trustnet, Morningstar and Interactive Investor. That way at least you can form a picture of what sort of person is handling your money and how well they present themselves and their story – though always remember that they will have been trained to be polished in front of a camera. (Some of them are frighteningly young, too, but most do look a bit older than the pictures in their promotional material when you meet them in person – funny that!)
All funds are required to produce regular factsheets to summarise their performance and their most important holdings. This is a useful starting point, and will include a list of the ten largest holdings and breakdown of the fund’s holdings by sector. Many of the biggest firms offer visitors to their websites the facility to get email alerts about important announcements and the views of their managers. It is also possible to read the interim and annual reports of any fund. These usually have much longer pieces of commentary on a fund’s objectives and performance, as well as a full list of all the holdings that a fund owns (not just the top ten). The reports produced by Artemis are among the best in this respect. Statutory reports are a very valuable information source, and one that surprisingly few investors seem to know even exist. You should definitely look for them and read them.11
Stick to the discipline
Once we have decided to back a manager, our primary objective afterwards is to try to make sure that they are sticking to their discipline. It is when people start to go off on a different course than the one they set out on that it starts to get dangerous. The technology boom in 1999–2000 was a classic case. For a while the craze for investing in anything vaguely tech-oriented was such that fund managers knew their careers could be lost if they failed to change course and start following the herd.
Our question to fund managers at the time was: “If you have told us at the outset that you are a disciplined value investor, only buying stocks that were cheap on valuation grounds, why are you suddenly rushing off to buy some whizzbang new company whose valuation breaks all your own rules? You wouldn’t have touched it with a bargepole before.” If that sort of thing happens, you know that it’s all going to go wrong in the end. So anything like that is an automatic sell signal for us.
What about funds that use derivatives, which the great American investor Warren Buffett once memorably described as “financial weapons of mass destruction”? Is that a good or a bad sign? I am not necessarily against funds that use options or futures in their strategy. It all depends on how and why they use them. If the aim is simply to insure a portfolio against the risk of a severe market fall, for example, I don’t mind it. Bond managers use derivatives a lot more than equity managers. Sometimes it is to get exposure to a particular type of bond or market very quickly, and that can make sense. Hedging currency exposure is also often a sensible idea.
But I don’t like the call-option strategies that some of the income funds use to generate more income. That may increase the fund’s income in the short run, but you never know at what cost, or whether the strategy will produce negative results in the longer term. Funds that use call options have produced a lot of income but realistically there is not much capital performance to look forward to. You have to ask if they are really suitable for the people who bought them and who may well be expecting something different.
This type of fund might be okay for people in their 70s and 80s. You could argue that at that age they are equivalent to a short-lived annuity from which you can take a thumping great income now, knowing that you won’t be around to enjoy the capital after that. But would I want to do it at 55, coming up to pre-retirement planning? No, because in my view you’d be much better off with an income and growth fund at that stage.
What other professionals think
In addition to doing your own research into fund performance, there are other places where you can hope to find out more about the quality of a fund and its manager. The first and probably least useful source is to look at the ratings of funds. Fund ratings are offered by a number of specialist companies, such as Morningstar, FE Trustnet, Lipper, Square Mile and the Financial Times. Each one has a slightly different way of analysing a fund’s performance and vary in the extent to which they apply qualitative as well as quantitative scores when assessing their rating.
In the old days funds that the ratings companies liked best were simply awarded stars, with five stars the best, rather as if they were rating a hotel or restaurant. Unfortunately at the time, before the introduction of more scientific methods, they were based largely on recent fund performance. Academic research suggests that simple star rating systems of that kind tell you little about whether a fund is worth buying now. Today, while some ratings firms still employ a star system, they tend to include a lot more data, including qualitative criteria, in their assessment. The ratings have become a lot more sophisticated. Fund rating services now look at any number of risk and return measures when calculating their risk ratings and the fund’s risk-adjusted returns. The latter typically involve dividing the return a fund achieves over a certain period by the volatility (or standard deviation) of those returns so as to create a mathematical measure of risk-adjusted performance.
If you come across something called a Sharpe ratio or an information ratio in your research, they would be examples of this kind of analysis. The higher the score, the better in theory the fund. Any fund with an information or Sharpe ratio above 1.0 is said to be doing very well, while any fund whose ratio is negative is clearly doing poorly.
Why do I say that these ratings are no more than a useful starting point in determining how good a particular fund is? There are several reasons. One is simply experience. I and my research colleagues analyse a lot of the same ratios as a matter of course, but we have found that in practice they add only a little to our prior understanding of which funds are good and which ones are bad. Either they are too simple to be of any real value or too complicated to mean much beyond what you can already see for yourself in the raw performance data. However complex and sophisticated, all ratings and risk-adjusted measures also suffer from the fact that they are by definition (though to varying degrees) based on past performance data – and past performance, as we are always being reminded, is not much of a guide to future performance. Volatility of returns, although widely used as a measure of risk in financial theory, is at best a poor proxy for the real risk of a fund and at times can be positively misleading for a long-term investor. Another problem is that risk-adjusted ratios also change over time: they are not particularly stable, so a fund with a good Sharpe ratio at one point could move to a poor one a year or so later.
I suppose my conclusion to all this is: by all means have a look at ratings but never put all your faith in them. They will never be able to make up for the judgment of an experienced fund analyst.
Other useful sources
It therefore makes sense to look for guidance on which funds may be worth buying by seeking out the lists of recommended funds produced by research firms, independent financial advisors and intermediaries. The HL Wealth 150 list is an example I obviously know well, since I am responsible for producing it. The list includes our selection of the funds we like best in each of the main sectors. Other brokers also produce similar lists or reports, some of which are regularly quoted in the press. Since the Retail Distribution Review (RDR) paved the way for brokers to negotiate lower fees with fund providers, it is also worth looking around to see which advisors and intermediaries have been able to use their buying power to negotiate significant fee reductions for clients.
More often than not there can be significant overlaps between the funds that different broking and research firms recommend. This should not come as a huge surprise. Long-established fund managers with good track records, such as Neil Woodford or Nick Train, will tend to be popular with more than one research team, since most use broadly similar methods of analysis, in which past performance – whatever they may say – in practice often features prominently. In our case, we use a wide range of screening techniques to back up the information and judgments we make from our face-to-face meetings with fund managers. In particular we have developed a form of analysis that helps me to assess how much genuine stockpicking skill any individual fund manager has. That is because I believe that stockpicking skill is the key source of added value in actively managed funds.
In the bad old days before the rules changed with RDR, the situation was complicated by the fact that the choice of funds made by some brokers (not HL, I hasten to add) was heavily influenced by how much commission they stood to receive from the funds’ managers. Back in the 1990s one notorious firm of ‘independent’ financial advisors actively invited fund management companies to bid for a place on their best buy list. Fortunately the firm was detected and subsequently forced out of business by the industry regulator, the Financial Services Authority (as it was called then).
Even if you are a DIY investor, and determined to do your own research, it is probably still worthwhile to skim through the funds that the best brokers and independent ratings companies provide. If their analysis broadly agrees with yours, that should provide you with an extra degree of comfort that the fund you have chosen has been analysed by professionals and passed at least some of their basic quality tests. By the same token if you find yourself looking at or inheriting a fund that has no rating and no professional supporters, it may be tipping you off that the fund is not really as good as it might appear. Bear in mind, though, that there may be a temptation on the part of advisors to recommend the funds where the choice is easiest to defend. (You may recall the old adage that no IT manager ever got fired for choosing IBM. I dare say something similar sometimes happens in our business.)
The third place to look for guidance on good and bad funds is in the choices made by experienced multi-managers. These are funds which only buy other funds and combine them into portfolios which they then offer to clients as one-stop solutions to the individual’s fund needs. HL’s range of multi-manager funds is an example and naturally draws heavily on the research work we do for the firm’s Wealth 150 list. Jupiter’s Merlin funds, which have been run by John Chatfeild-Roberts and his team for more than 20 years, are another well-known example.
To survive for long as a multi-manager you have to really know your stuff as your investors are paying a second layer of fees on top of the underlying fees of the funds, which can only be justified by superior long-term results. As a source of information to DIY investors, the lists of funds owned by the best multi-manager funds can, however, be invaluable. It is no surprise that almost all the funds I have in my own pension fund and ISA are those that my colleague Lee Gardhouse also has in one of his multi-manager funds.
Character and personality
In chapter 4 I make a reference to experience as a key factor in assessing fund managers. I would like to emphasise also how important character is. Fortunately no unit trust or OEIC has ever gone completely bust, or proved to be an outright fraud, but many fund managers have still done a poor job for their investors over the years.12 They are obviously the ones you want to avoid. Even good fund managers need watching: you want them to remain at all times aware that they are working for the benefit of investors, rather than just for themselves or their employers. It can happen that they simply run out of steam, or lose interest in going on with the job, although in my experience that is rare.
Business pressures may force them to become closet trackers or simply coast for a while, copying what the rest of the industry is doing, rather than thinking for themselves. Sometimes a fund management company may want or need to make sure a successful fund goes on taking in new money even though the fund has become too big and too popular for the fund manager to have any realistic hope of doing his job properly any longer. You always need to be on the alert for fund companies that are making asset gathering – raking in as many investors as possible – a priority over fund performance.
It can take time for a manager’s change in attitude or motivation to become apparent. I am always on the lookout for this kind of problem when we meet fund managers, which we do on an industrial scale (300 meetings a year on average). Not every fund manager is as committed to the job as Nils Taube, who famously died at his desk well into his 70s! The great fund managers are fanatics for what they do and many also have a big financial stake in their own fund and business – always a good sign.
It is important also to remember that fund managers (at least the ones that I am looking for, managing active funds) are human beings. As such they are no different from the rest of us in having different talents, personalities and temperaments. They also differ in their personal habits, objectives and motivation. The ones I like best are those who display courage and commitment when things go wrong, as they will do from time to time. The best fund managers tend to be good under fire and never lose sight of the fact that the money they are managing ultimately belongs to you; their fund should not be solely a means to enriching themselves.
The best fund managers can earn extraordinarily large amounts of money and it is only human nature that some of them tend to ease up once they have achieved a certain level of success. As an investor you need to be alive to these risks. Having said that, most of the very good fund managers I know are a bit like kids at school. They always want to be top of the form, and this competitive urge tends to keep them going long after they can afford to quit. As professional advisors, we speak to most of the fund managers on our list on a regular basis, and keep our ears open for any hint of trouble in their personal or professional lives. That is not something that is quite as easy for ordinary investors to do, although the internet can give you some of the answers.
Costs and charges
The cost of owning a fund can have a big impact on how well it does for you. Over the last few years costs have become a greater topic within the fund industry. In simple terms it is common sense that costs must affect the final outcome of your investment, so the lower the cost the better, other things being equal. But just as you wouldn’t always choose to buy the cheapest car simply because it is the cheapest, so you also need to take account of the fact that the best funds may be in a position – and justified – in charging more than those who are not so good. The critical issue is whether the result, as measured by the returns that the fund makes, more than compensates for the higher charges, taking into account also the risk profile of the fund.
Well, I hear you say, that should be relatively straightforward. But in practice it is not, because working out what the real costs of a fund are is not as easy as it sounds. One reason is that this is an area where the financial industry has hardly covered itself in glory. For many years, in the absence of a robust agreed industry disclosure standard, different companies routinely disclosed their charges in different ways, and obfuscated the figures where they could get away with it. Even now, while the industry regulator has introduced new rules on transparency and insisted on standardised reporting, there are still differences in the way that charges are set. Individual funds remain free to set their annual management fees at a level which they think the market can bear. They all charge industry professionals who can afford to buy in bulk lower fees than those you as an individual investor will be asked to pay. The amount of add-on costs that firms add to their basic management fee also varies considerably from one fund to the next.
The overall effect is that costs remain a recipe for confusion – and that is before you have to take into account some other issues that are inherent in the nature of investment, not necessarily the fault of the funds themselves. For example, if you are working out a cost figure for a particular fund, should you take the actual figure that it paid last year – or should you take the figure that is likely to incur this year? This might be quite different if the fund has grown or shrunk significantly in size over the course of a year, as can easily happen. All funds today are required to publish something known as their OCF, which stands for ongoing charge figure. It is the total amount that the fund spent on a range of specified costs in its last accounting period, expressed as a percentage of the size of the fund. For an actively managed fund, these will typically fall in the range of 0.5% to 2.5% per annum (though much less for a passive fund). But you should certainly not take that figure as gospel truth, for the reasons I have mentioned. For example, the additional costs (over and above the standard ones that the regulator has specified) charged by fund firms can range from nothing to as much as 0.3% in some cases.
The important point to remember here is that even small percentages can make a huge difference in cash terms. Just as positive investment returns start to grow exponentially to large amounts over the course of many years, so too will the ‘cost drag’ of an over-expensive fund. Over ten years, the negative impact of a 0.5% differential in fund costs can be substantial. Suppose you have two funds that both grow at the rate of 8% per annum, but one has an annual ongoing charge ratio of 1.5% and the other 1%. After ten years the difference in costs will have taken away roughly 10% of your overall gain. If you invested £10,000 in each fund at the outset, the more expensive one will have left you with £1,000 less than the other one!
So what can one sensibly say about costs? The first thing is simply to recognise that they matter, and make a point of looking at what any funds you are considering charge. Secondly, what you will find is that different types of investment fund tend to have different cost structures: in general, passive funds will (and definitely should) be the cheapest. Investment trusts and unit trusts will cost more, but their charges will be not dissimilar, although some of the older, established generalist investment trusts do tend to be cheaper than their unit trust/OEIC counterparts. Thirdly, look out for those additional costs that I have already mentioned. Fourthly, watch out also for funds and investment trusts that impose a performance fee as well as the annual management charge.
In my view, performance fees, while they may sound like a good idea, are opaque, difficult to understand and almost impossible to work out in advance, which should be enough to convince you that they are not for you. The argument you will hear for performance fees is that as they are only incurred if the fund beats a certain pre-agreed target return, they are a win-win for both investors and the fund managers. Sometimes you also hear companies say they are an added incentive for the fund managers to perform. I don’t buy those arguments at all. The one thing we know about performance fees is that you pay them if the fund does well, but they don’t give you your money back if the fund does poorly. In the most extreme cases, if the performance fees are uncapped, the investor can end up paying more than 4% per annum – try compounding that over ten years and then try justifying it! Performance fees, as far as I am concerned, are more about greed than anything else.13
Where I do agree is that the real litmus test with costs is whether the fund is good enough to justify above-average management fees. I suspect that the fees on the small selection of funds which I own and recommend to clients have slightly higher-than-average annual management fees, but I certainly won’t be selling them just because of that. You might think from reading the media in the last few years that the costs of funds are still very high compared to what they were years ago. The reality is that in some cases they are, but the general trend seems to be down. When I first started, most unit trusts had initial fees of 5%; for every £100 you invested, the fund took £5, partly as a set-up fee and partly to pay commission to the advisor who recommended them. Initial fees are virtually non-existent today, thank goodness. The annual fees of passive funds have also dropped a long way over the last few years. When Virgin launched one of the first All-Share tracker funds in 1996, it made much of the fact that its annual 1% management charge was cheap (which it was, but only in relative terms). Today you can buy an equivalent tracker fund for as little as 0.09% or less, so if cheap is what you want, that is the place to start.
As far as actively managed funds are concerned, they obviously charge a lot more than passive funds. The biggest change since the rules were changed in 2013 is that funds no longer automatically pay an annual commission to advisors who buy their funds for clients. Most funds used to charge investors an annual fee of 1.5%, of which half was given to the broker, advisor or intermediary who introduced the investor, and the fund management company kept the remaining 0.75%. Now funds set their own fees and investors pay whoever persuaded them to own the fund in other ways. (In industry jargon the commission payments have been ‘unbundled’ from the annual management charge.) The fund management companies now have to disclose their annual management fees directly, and though it is still early days since the new regime came into force I detect that the overall trend in fees seems to be gradually down.
What consumers rightly want is much greater clarity, so that they can compare the costs of funds on a like-for-like basis. The OCF has been introduced to try and help this. However, there is still a lot of argument within the industry about what should or should not be included as relevant costs. Should they, for example, include the cost of turnover within the fund (what the fund manager pays in dealing costs when buying and selling holdings)? The higher the turnover, the more it costs the fund and ultimately the consumer. It is no surprise to find that many of the very best fund managers, including many that I own, have the lowest turnover rates.
This is an evolving situation so perhaps the best thing I can say to the reader at the moment is to do further research on the subject and try and keep abreast of any potential changes. Unfortunately my experience is that many of the articles about the relative merits of passive and active investing, while they focus on costs as a key differentiator, lack balance. This is because the argument has become a quasi-religious dispute between two sets of believers who cannot accept that the other side has a point. My advice to you is to be pragmatic, seek to understand both sides of the argument and try to get the best out of both kinds of fund.
The need for patience
If there is one common mistake that I would urge investors to avoid at all costs, it is becoming too impatient with the funds they have chosen. Funds are and should be seen as medium to long-term investments; and that means giving them time to do their work. Constantly chopping and changing the funds you own because they have got off to a poor start, or are going through a bad patch, is a poor strategy. You will be much better served by taking more time with your initial selections and then sticking with them. Only if a fund consistently fails to deliver what you expect over a decent period of time should you consider switching tack.
One client recently complained to me that a nano-cap fund which has been on our list since October 2013 had done poorly. (A nano-cap fund is one which only invests in real stock market minnows, companies with a market value of less than £100 million.) I couldn’t argue that the fund had done brilliantly well, as it was up only around 6%, although it had started strongly and only petered out when the small-cap rally ended in March 2014. Yet this client sold the fund solely on the basis of its short-term track record. In my view he should have been more patient, as this is the type of fund that by its nature could suddenly return 100% in a single year. The trouble is that none of us can tell you with any certainty which year that will be. With an experienced fund manager, patience usually pays off.
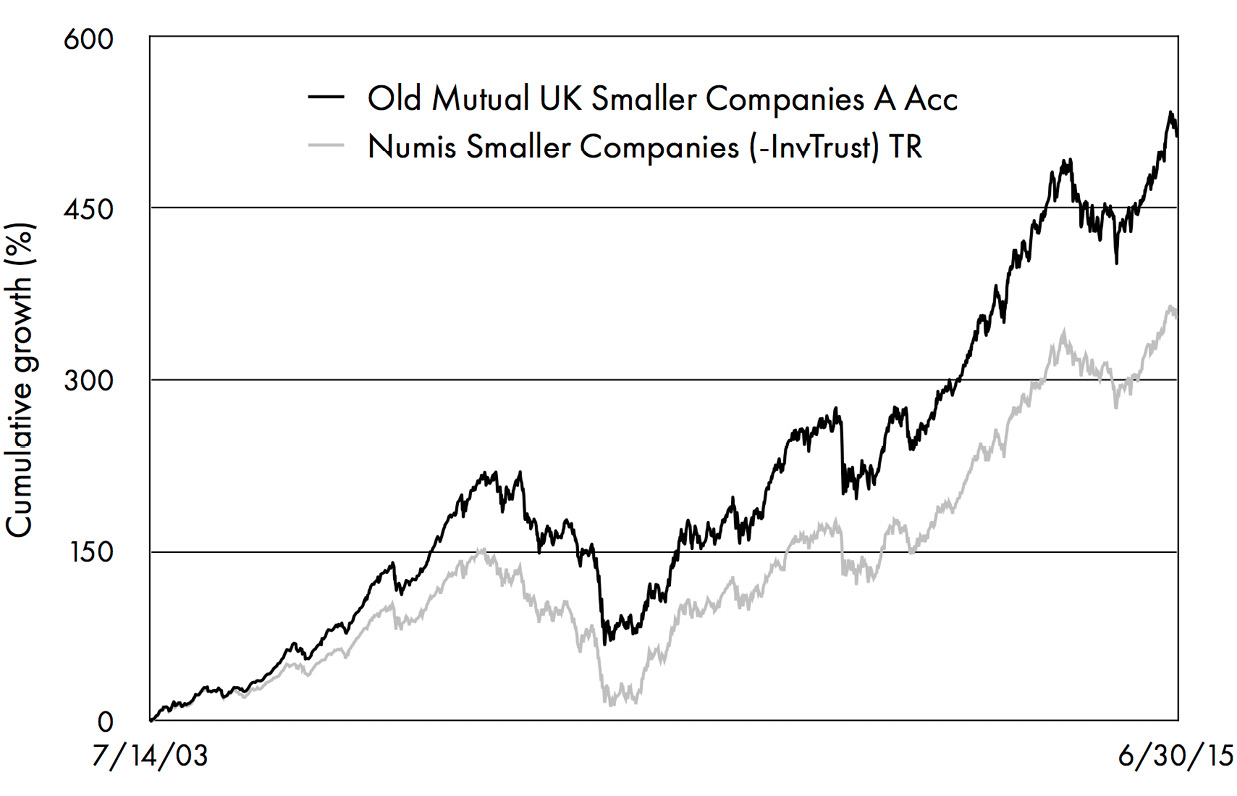
Figure 5.7: The need for patience – a smaller companies fund example.
By way of an example, take a look at these two charts, which show the performance of two actively managed funds I have followed closely for a number of years. One is the Old Mutual UK Smaller Companies fund, managed by Dan Nickols. The other is First State Asia Pacific Leaders, managed by Angus Tulloch, a long-serving member of First State’s Asian equity team. Why have I picked these two funds? Because I think they illustrate very clearly how having conviction in a fund manager can pay handsome rewards for the patient investor.

Figure 5.8: The need for patience – a regional fund example.
Let’s suppose you had been clever enough to see the global financial crisis coming. You could have sold these two funds in 2007 and by 2008, as the bear market intensified, you would have been feeling very smart. Both the funds lost around 50% of their value, halving your investment – no fun at all. The chances are that if you had held these funds for more than three years, you would have been nursing a loss. But when in practice would you have made a decision to buy back into those funds? Would it have been in early 2009, which (as we can see in retrospect) turned out to be the bottom of the bear market? I very much doubt it.
At the time, remember, many commentators could only see markets halving again. The media was full of talk of a double-dip recession and the risk of further bank failures. Confidence was at rock-bottom levels. Very few of our clients were buying anything. If you had called the bottom of the market exactly at that point, you deserve your success. My point, however, is what would have happened if (as I strongly suspect) you had remained sheltering in cash. Just look at the returns that you would have missed from that low point! Remember also that if something falls by 50% in value, and you sell out, you need to make a 100% gain just to get back to where you were.
Yet both the two funds I highlight in the charts have rebounded by more than 250% from their lowest levels during the crisis. They are both comfortably well ahead of their previous 2007 highs. In other words, if you had stuck with the funds all the way through the painful crisis period, you would be now once again be sitting pretty. Those who hung on to their holdings in these two funds did not even have to make any tough decisions. The moral is clear: if you try and be too clever in timing the market, you will almost invariably lose out. Sadly I have seen it happen all too often. While holding your nerve in 2008 was not easy against a tsunami of bearish commentary, for most investors it would have been the right thing to do. All big stock market falls are followed by recovery. During the bad times, experience shows that, hard as it is, it is almost always better to hold your nerve, go fishing or whatever hobby you have that takes your mind off the worries of the world and do precisely nothing. The best funds will come back in the end.
Points to remember
- The style of a fund is a big factor behind how it performs.
- The more specialised the fund, the more volatile it will be.
- Smallcap funds are riskier, but often produce higher long-term returns.
- Aim for the best funds in each sector; don’t try to pick the best sectors first.
- Always dig behind the raw performance numbers provided by your fund.
- Use charts to track the journey that a fund has made to reach its current price.
- Experience and consistency are hallmarks of the best fund managers.
- Don’t be put off if fund managers leave to start their own firms; it is often a good sign.
11 I have included some extracts from the information that investors can dig out online about the Artemis Income fund in the appendices.
12 The closest the industry has come to a fund default came when a notorious fund run by Morgan Grenfell proved to be investing outside its stated investment parameters. The fund’s ultimate owners, Deutsche Bank, compensated the fund’s investors in full.
13 I make an exception of the Woodford Patient Capital Trust, which daringly charges a performance fee but has no annual management charge at all – funny that nobody else has copied him down this path!