When some organizations begin taking part in a Design Thinking workshop, all participants in the workshop are laser-focused on ideating around a single goal. In other organizations, the participants might come to the workshop having ill-defined or multiple goals in mind. In this chapter, we describe the best practices involved in figuring out a goal for each team to focus upon and scoping out an agreed-upon problem to be solved.
We will traverse the problem space diamond that we introduced in the Double Diamond approach described in Chapter 1. After we come to agreement around a goal, we will broaden our exploration of the problem and then narrow our focus to single problem that must be solved. Included in the exercises that we cover in this chapter are approaches to gaining a deeper understanding of the stakeholders that care about the problem and defining the potential benefits, emerging new opportunities and challenges that the organization might encounter if they choose to solve it.
This chapter provides important guidance for facilitators of these workshops, but it is also written to provide insight for other participants into the methods and tools employed. For example, key stakeholders can gain an understanding of how this workshop provides an approach that helps them more clearly understand the problems that are most important. Such stakeholders should also begin to gain an appreciation of how the workshop will help them gain buy-in from its participants.
Participants should take away that while solutioning does not begin until they traverse the solution space diamond that is focused upon in Chapter 4, they can gain a more comprehensive understanding of the problem to be solved using the approach that we describe in this chapter. In fact, in our experience, problem definition often takes more time than solutioning in these workshops.
Most adults find that staying focused in fully understanding a problem is very challenging because they are tempted to want to hurry up and solve it. However, the patience to explore problems in detail by becoming a good investigator will uncover more details that are relevant in determining a higher-quality solution.
Elisabeth McClure, in a TED talk titled “Are Children Really More Creative Than Adults,” stated that research shows children spend more time in divergent thinking (e.g., looking at possibilities and expanding options of what is or could be) but not appropriateness. So, they have more cognitive flexibility than adults.
According to McClure, adults like to spend more time in convergent thinking using critical thinking to decide what to do. It is harder for adults to spend time in divergent thinking. However, the success of this workshop depends on creativity that is a balance of originality and appropriateness. Thus, facilitators need to work hard to keep parts of the workshop from being frustrating for many adults.
Self-introductions and workshop overview
Selecting goals and diverse teams
Creating a unified vision and scope
Mapping stakeholders and personas
Positives, opportunities, and negatives
Refine to one problem statement
Summary
Self-Introductions and Workshop Overview
The morning of the workshop, the facilitator should arrive early to make sure that the facility, materials, and any food to be provided are set up and ready. Participants’ nameplates are sometimes distributed to assigned seats, but they might also remain in a cluster on the table such that participants can initially choose their own seats. Keep in mind that participants will move to other room locations anyways once they become part of a team.
To establish the precedence that the workshop will be carefully timed, the day should begin at the time that was agreed upon during pre-workshop preparation. Workshops typically begin between 8:30 and 9:30 a.m. Upon the arrival and seating of participants, the facilitator will explain the layout of the facility including the locations of restrooms, emergency exits, and food. Some discussion about when breaks might occur during the day and an explanation of the purpose of the toys present on the table(s) also occurs.
Bring an open mindset to the workshop.
Be physically present during the workshop.
Laptops will be turned off and other mobile devices put away (if these are not being used only for taking notes) – no email or texting unrelated to the workshop should be exchanged when it takes place.
Exercises will be timed to keep the workshop on track.
Any discussions determined out of scope during the workshop will be noted and deferred to an appropriate time.
Recency bias – A tendency to overvalue the most recent information
Anchor bias – Relying too much on pre-existing or initial information
Bandwagon bias – A tendency to agree to maintain harmony in a group to the extent of not reaching a better decision or idea
The facilitator should help maintain focus on the exercises during the workshop by making sure that everyone is physically and mentally present (hence the closing of laptops and elimination of non-essential emails and messaging). The timing of exercises will also help keep focus on the tasks at hand.
The facilitator should be cognizant of signs of covert and overt resistance that might be present in some participants. Covert resistance is often expressed in negative body language, such as participants having crossed arms, pointing their index fingers, making sideways glances, gripping the table with their hands, biting fingernails and pencils, crossing legs, and kicking or fidgeting. More overt signs might include lack of participation and input during team activities.
Facilitators and proctors can often pull such individuals back into participating in the exercises and activities by prompting them for input. Facilitators and proctors might also suggest that they should serve as a spokesperson by presenting the output from the current exercise that the team is working on.
Brainteasers are sometimes used by the facilitator here and/or during other periods within the workshop if the participants seem to be less than enthusiastic during certain exercises or dialogues. These can generate a lot of additional energy, especially when participants are highly competitive with each other, and encourage out-of-the-box thinking. Typical examples of brainteasers include exercises that involve participants competing to solve visual and physical puzzles.
Tool: ELMO Card
A tool that can be introduced at this time and used throughout the entire workshop is the ELMO card. These cards are useful for when discussions become too protracted and need to be deferred.
Discussions that become extended and that begin to explore out-of-scope areas that are not relevant to the workshop can result in frustration among participants. As frustration grows, it is important that each participant feels empowered to suggest setting aside the discussion. In anticipation such situations, the facilitator might ask participants to write “ELMO” on an index card during this point in the workshop. The letters stand for “Enough, Let’s Move On.” This method for group focus enablement was introduced by Laurie Edwards Gray, a customer experience consultant in Atlanta.
If anyone feels that the workshop is getting derailed by a discussion, they simply hold up or throw their ELMO card during the workshop. (Laurie recommends that the facilitator gently throw the first ELMO card to break the ice and show “safe” usage. Chances are that several participants, upon seeing the first card, will do the same. If they do not, the discussion should continue.) The facilitator will make note of the discussion on a whiteboard, and it will be addressed at the end of the workshop to either schedule another time to discuss and escalate or any other action the room deems relevant to the topic.
Method: Introduction Card
This method or activity is focused on getting everyone involved in interactions as team exercises are critical to the success of the workshop. It is very possible, given the diverse roles of the participants, that not everyone will know each other in the room. So, this activity gets everyone involved by having each person create their own “baseball card” on an index card.
Participants begin by simply drawing a stick figure representing themselves (to get them comfortable with drawing, since drawing occurs at various points in the workshop). The facilitator, proctor(s), and scribe(s) also typically take part in this exercise and prepare their own cards. Each person also lists some basic information on the card including their name, title/role, and hobbies.
The facilitator gives everyone 5 or 10 minutes to prepare the card. When time is up, each participant then individually shows their card and introduces themselves (thus gaining comfort in presenting to the group).
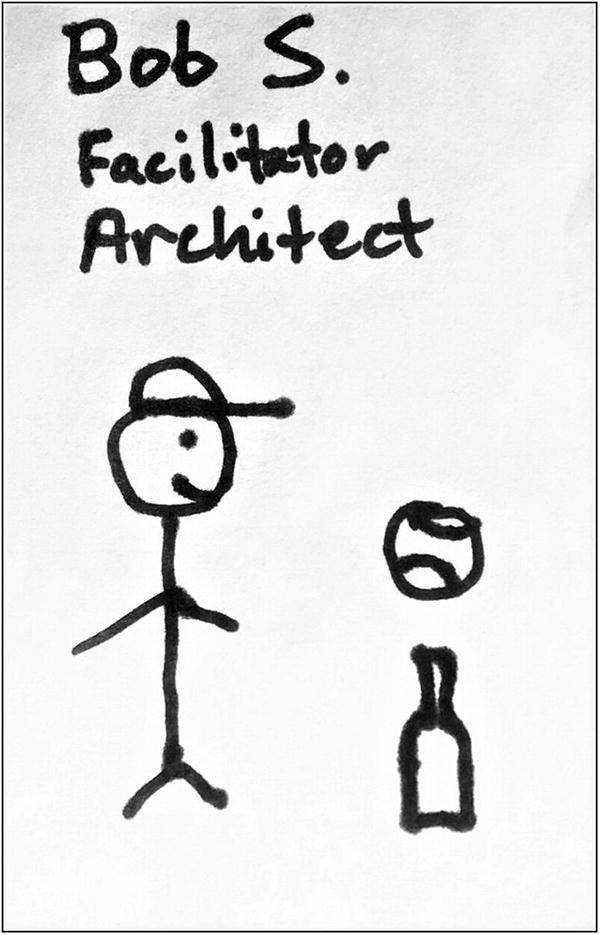
Sample workshop card describing one of this book’s authors
A variation sometimes used in providing participants’ introductions is to have each individual participant partner with another person. Each participant interviews their partner. They then draw and label a card that describes their partner with a stick figure and similar information to that previously described (name, title/role, hobbies). Finally, each person introduces their partner to the group.
Method: Participant Connections
At this point, the person or their partner can be prompted to write the name and role of the person just introduced on a whiteboard. People in similar roles in the same organization are typically grouped together. Lines are then drawn to persons in different groups, and relationships are denoted among the various groups on the drawing. Such a diagram further helps to explain how the person fits in the organization.
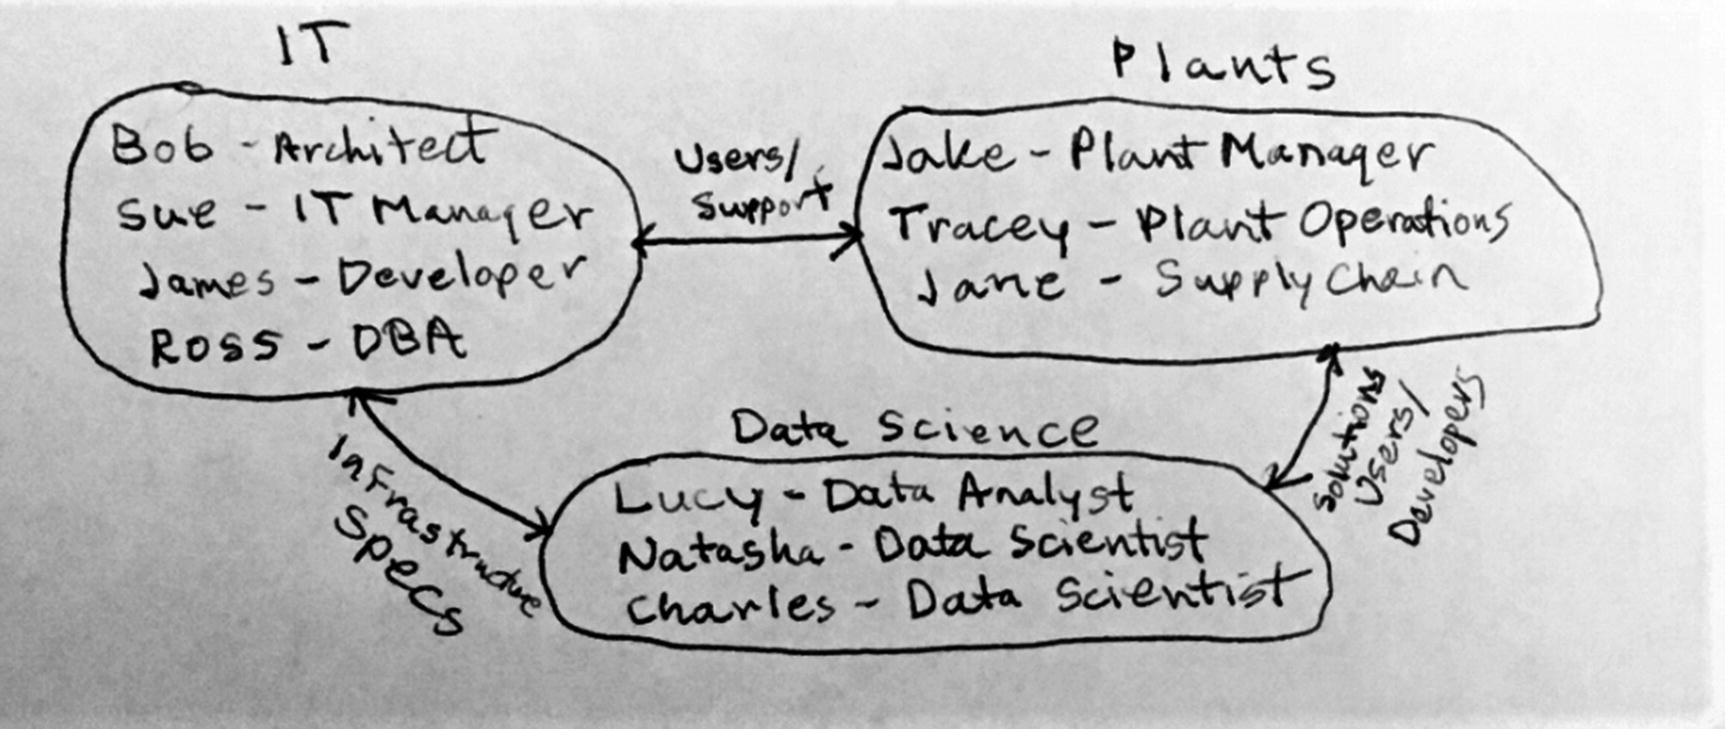
Workshop participants and their connections
A brief history of Design Thinking
The intersection of innovation and design
How Design Thinking can mitigate costs of change
How bias can influence design
The Double Diamond approach including discovery and definition in the problem space and design and delivery in the solution space
This introduction to Design Thinking gives the participants a common basic understanding as to the methodology. It also serves as a road map and explanation of the agenda that will be followed in the workshop.
Selecting Goals and Diverse Teams
We are now ready to discuss the goal or goals to be further defined as problems to be solved in this portion of the workshop. In our experience, when organizations come into the workshop with a single goal in mind, it is usually driven by the sponsoring stakeholder. However, it is also common for stakeholders and other participants to come to the workshop with multiple potential goals in mind, and it is also possible that they might be unsure of what goals are important to the organization.
We’ll next discuss methods for setting goals and then describe creating diverse teams that will be in place throughout the workshop.
Method: How Might We
If the situation is one where multiple goals are being discussed, the participants should decide if they want to tackle them all or narrow them down. An exercise to narrow them down begins with each participant in the room writing the goals that they think are top of mind for their organization on sticky notes and placing them on a whiteboard. If the facilitator sees that several of the sticky notes state the same goal, they will group these together.
The facilitator should not provide insights or ideas during this exercise and other exercises that we will describe. Instead, the facilitator should help the participants in the room discover them on their own. The facilitator should also frame each exercise prior to it beginning (including the time allocated) and provide guidance and reassurance while directing participants away from premature consideration of solutions.
The participants are next asked to use one of the stickers that they have been provided to vote on the goal that they think is most important. The facilitator tallies the goal (or goals) with the most votes. A goal or goals with the most votes are then put into the form of “how might we” statements. The writing down of goals and voting exercise should take about 10 minutes.
Using our example of a manufacturer of industrial equipment introduced in Chapter 2, we might choose the goal of optimizing the supply chain. So, a statement the participants could come up with is “How might we optimize our supply chain?” If other goals are going to be addressed by certain teams, “how might we” statements would also be written for those.
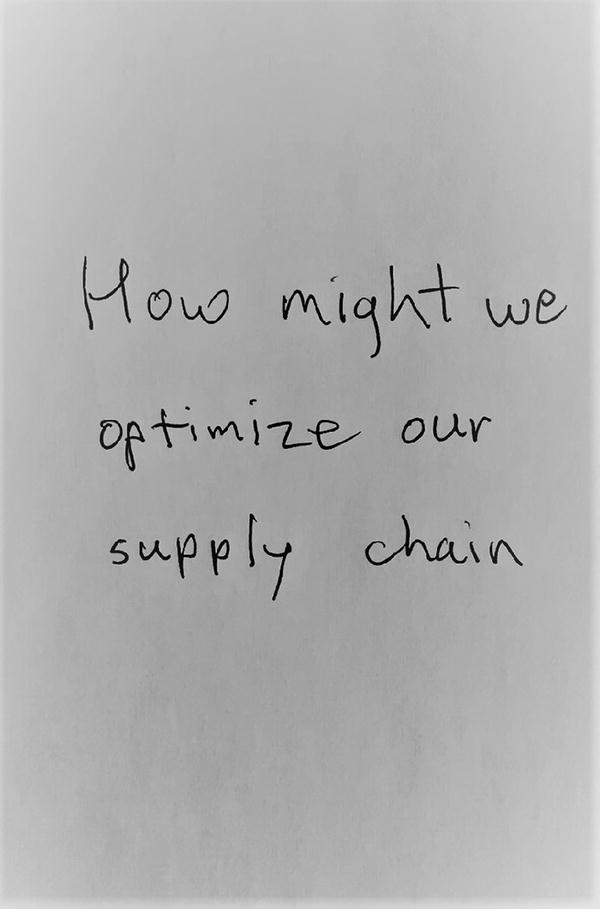
Goal statement in our example
We are now ready to select the workshop teams. Typical team sizes are four to eight people. If multiple goals are to be addressed during the workshop, each team should have a line-of-business leader particularly interested in solving the specific team goal. (If multiple teams are addressing the same goal, those team leaders should have an interest in reaching that common goal.)
Method: Team Naming
Naming your team or teams is a good method to employ when you want to create unity, excitement, and ownership of outcomes within a team. Having teams name themselves is also an activity that can serve as an icebreaker and help people who don’t know each other to actually begin to come together as a team.
Team leaders should make sure that their team contains individuals in diverse roles who will be impacted by reaching the goal. These individuals might include line-of-business representatives (leaders and frontline workers), business analysts/data scientists, partners/customers, support teams, and IT software developers and managers. This diversity will help to ensure more complete discussions and expressions of varying points of view during problem discovery and definition. It should also lead to better solution design and delivery discussions later.
Each team then gathers in a designated area within the conference room (or to separate rooms if pre-arranged) around easels that have sticky sheets. Each will agree upon a name for their team, write it on a sheet of sticky easel paper, and then also draw a simple picture related to the team name and the team’s goal. The team selection and naming should take about 10 minutes.
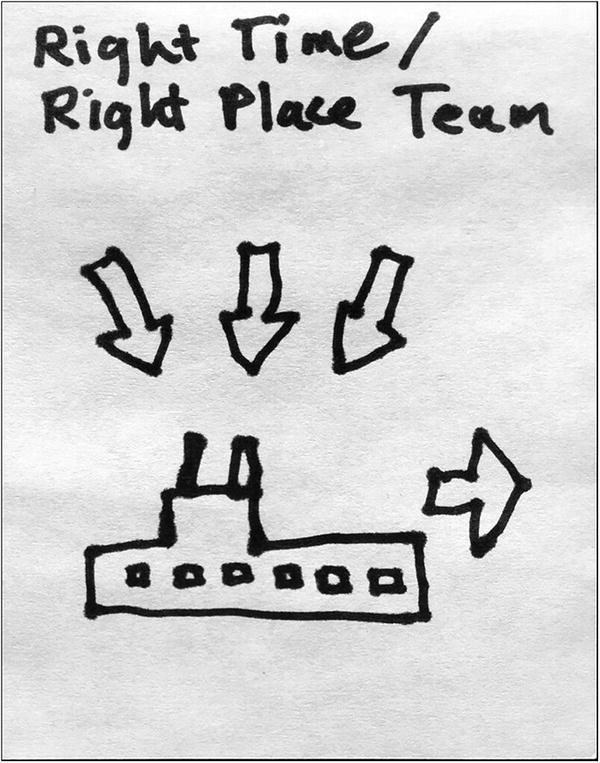
Sample team drawing and name
All teams then gather into a single room (if not already in a common room). A spokesperson for each team explains their artwork and team name to the other teams in the main conference room. Participants on other teams can ask for clarification as each team is presented. Teams might modify their artwork as needed based upon feedback and then post the drawing onto designated wall space (where they will subsequently post other exercise renderings).
Method: Abstraction Ladder
Use this method when you are trying to help the team gain greater alignment and unify all their goals and objectives. They can gain a clearer unified vision of a goal through the abstraction ladder exercise.
Team members gather again into their separate groups around their easels. Each team begins by writing their “how might we” statement from earlier across the center of an easel sticky sheet. Above the statement, they draw an arrow pointed up along with the word “why.” This is where the team will describe why they might take this action (the “so what” reasons). Below the statement, they draw an arrow pointed down along with the word “how.” This is where they will begin to describe how they will take this action.
Next, each of the team participants writes as many “why” and “how” statements related to the goal that they can think of on their sticky notes. They post them on the easel sticky sheets getting broader with “why” statements as they move up the sheet and narrower with their “how” statements as they move down. (Facilitators, proctors, and/or team leaders typically help with grouping overlapping notes and placing them on the sheet.) This part of the exercise takes about 10 minutes.
In our imaginary supply chain optimization example, the team came up with narrow “why” statements that include “meet production demand,” “eliminate waste,” and “improve partnerships.” Broader “why” statements that they came up with include “gain market share” and “improve margins.”
Broad “how” example statements include “improve tracking” and “improve quality.” The notion of “improve tracking” was narrowed down by the team into “understand shortages,” “view key metrics,” and “alert plant” and “alert supplier.” “Improve quality” was narrowed into “standardize processes.”
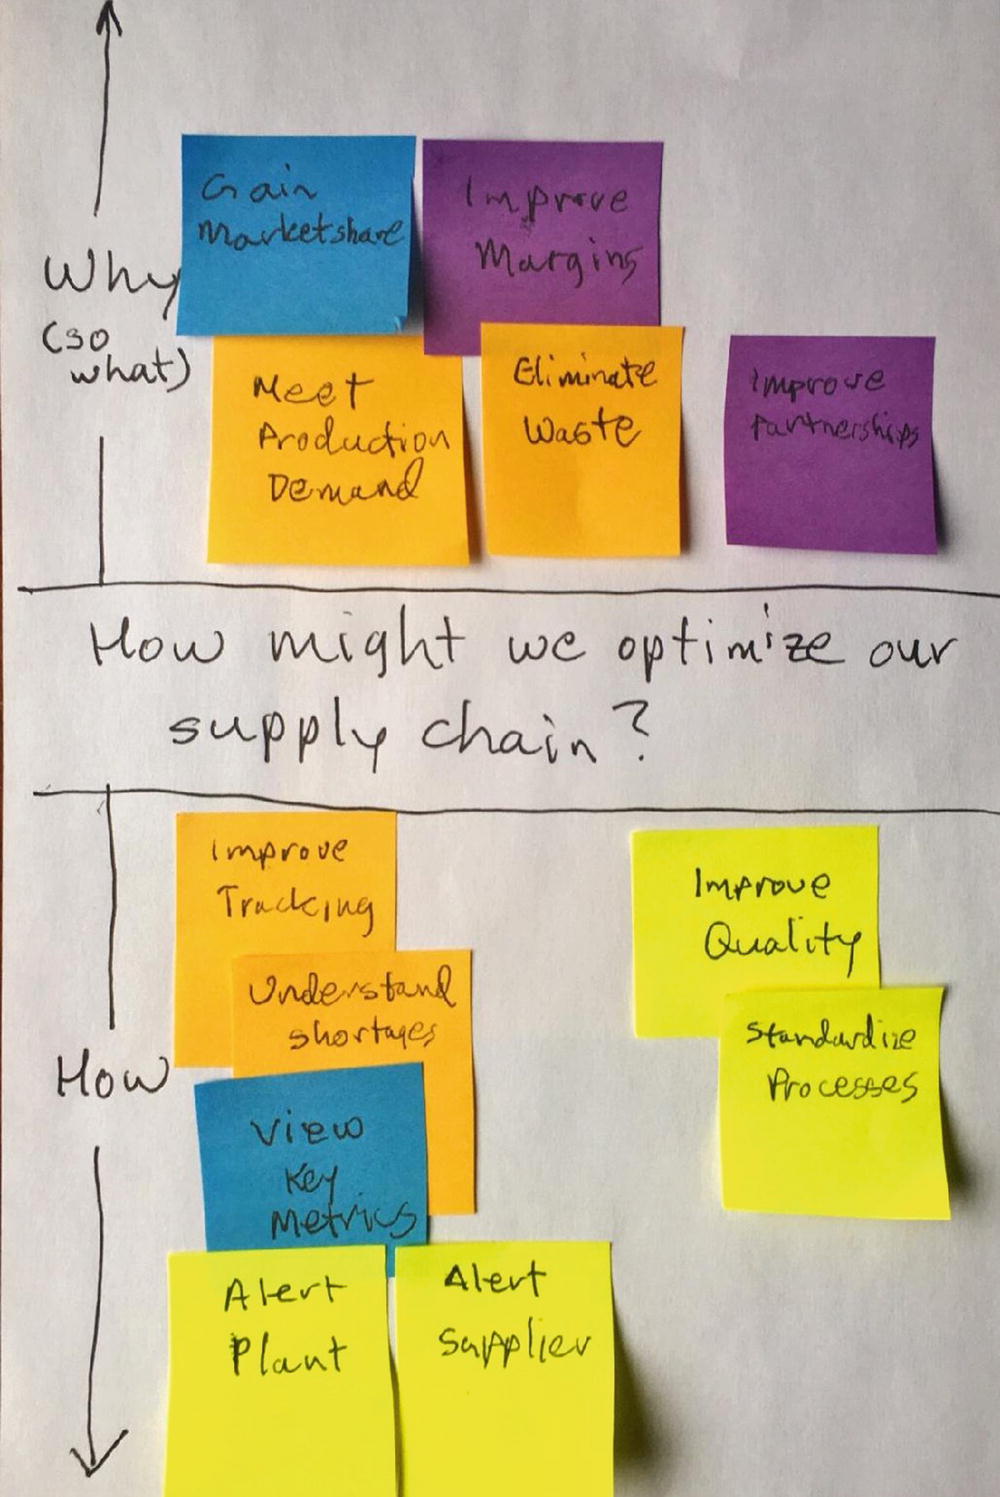
Sample unified vision easel sticky sheet with “whys” and “hows”
The supply chain optimization example presented throughout this chapter and Chapter 4 is an imaginary example and is not representative of any past single client that the authors worked with. It is meant to portray a theoretical set of exercise results in an area of popular interest we have seen driving Design Thinking workshops in certain industries. You will find that any workshop that you take part in will yield its own unique set of problems and outcomes linked to current business processes and the needs of key stakeholders and their organization.
Tool: Voting
We now have a variety of “why” and “how” statements on the abstraction ladder, any one of which could be used to narrow the scope of the effort ahead. A tool that can be used in different situations throughout the entire workshop to narrow choices is voting. This is typically accomplished by using stickers (i.e., using dot, smiley face, or star stickers to mark preferences or vote on topics).
The goal of voting is to enable participants who may not be comfortable debating to select a mutually agreeable choice and eliminate other choices. It’s helpful to use this method to quickly get selections and move forward.
Each team participant chooses a best statement that is posted on the abstraction ladder easel by voting with one sticker per person over about a 10-minute period. The statement that has the most votes is chosen by that team to define their initial scope.
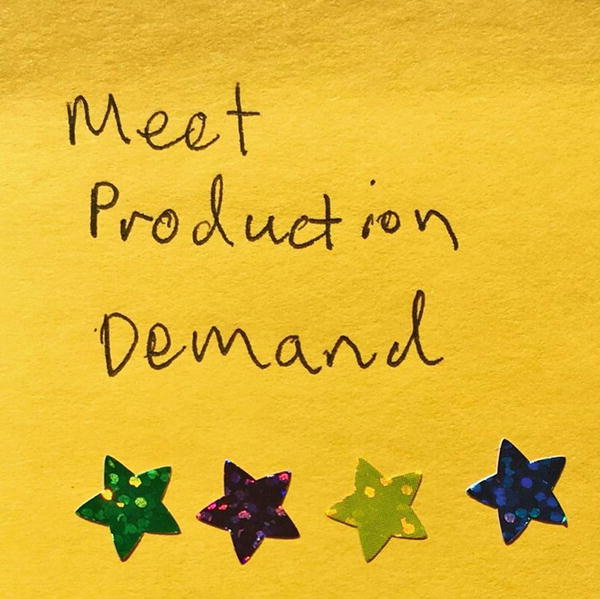
Example “best statement” shown after vote with stickers attached
Each team then has a spokesperson present their entire diagram to the other teams and describe why they selected the winning statement. If different goals are being pursued among teams, each team solicits feedback and possibly further refines their scope. If a single goal is being pursued by all the teams, another vote takes place and a single scope statement is selected for all the teams to subsequently work from.
Mapping Stakeholders and Personas
Projects require a commitment of money and other resources. At some point along the way, the importance of solving the problem that you identify must be supported by key stakeholders. These stakeholders might include sponsors and decision-makers, gatekeepers and approvers, and important influencers (including frontline workers coming face to face with the problem in their day-to-day activities). In these exercises, we begin to identify and characterize some of these key individuals.
Method: Stakeholder Mapping
Within each team, individual team members begin by writing the names of stakeholders and the stakeholders’ roles or titles on sticky notes. They bring them forward and post them on a sticky easel sheet. A team leader or proctor eliminates duplicates and clusters the stakeholders into groups. A circle is then drawn around each group and they are labeled.
In our supply chain optimization example, the team identified stakeholders in the following groups: C-level, logistics and transportation, plant operations, suppliers, sales and marketing, and IT. C-level stakeholders in this example include the CEO, CFO, and CIO. Logistics and transportation stakeholders include logistics management and logistics analysts. Plant operations stakeholders include plant operations management and plant operations workers. Suppliers are represented by a single set of stakeholders in the example. Sales and marketing stakeholders include representatives from each organization. IT stakeholders include individuals involved in data management, data science, software development, and IT infrastructure.
Lines are then drawn connecting the groups that represent their relationships to each other, and the nature of the relationships is appropriately denoted as labels on the lines. Some of the relationships in our supply chain example include demand generated by sales and marketing for products produced from plant operations, exchanges of data facilitated by IT, and exchanges of pipeline information with the C-level. Logistics and transportation coordinates with plant operations and suppliers and interacts with IT through the exchange of data.
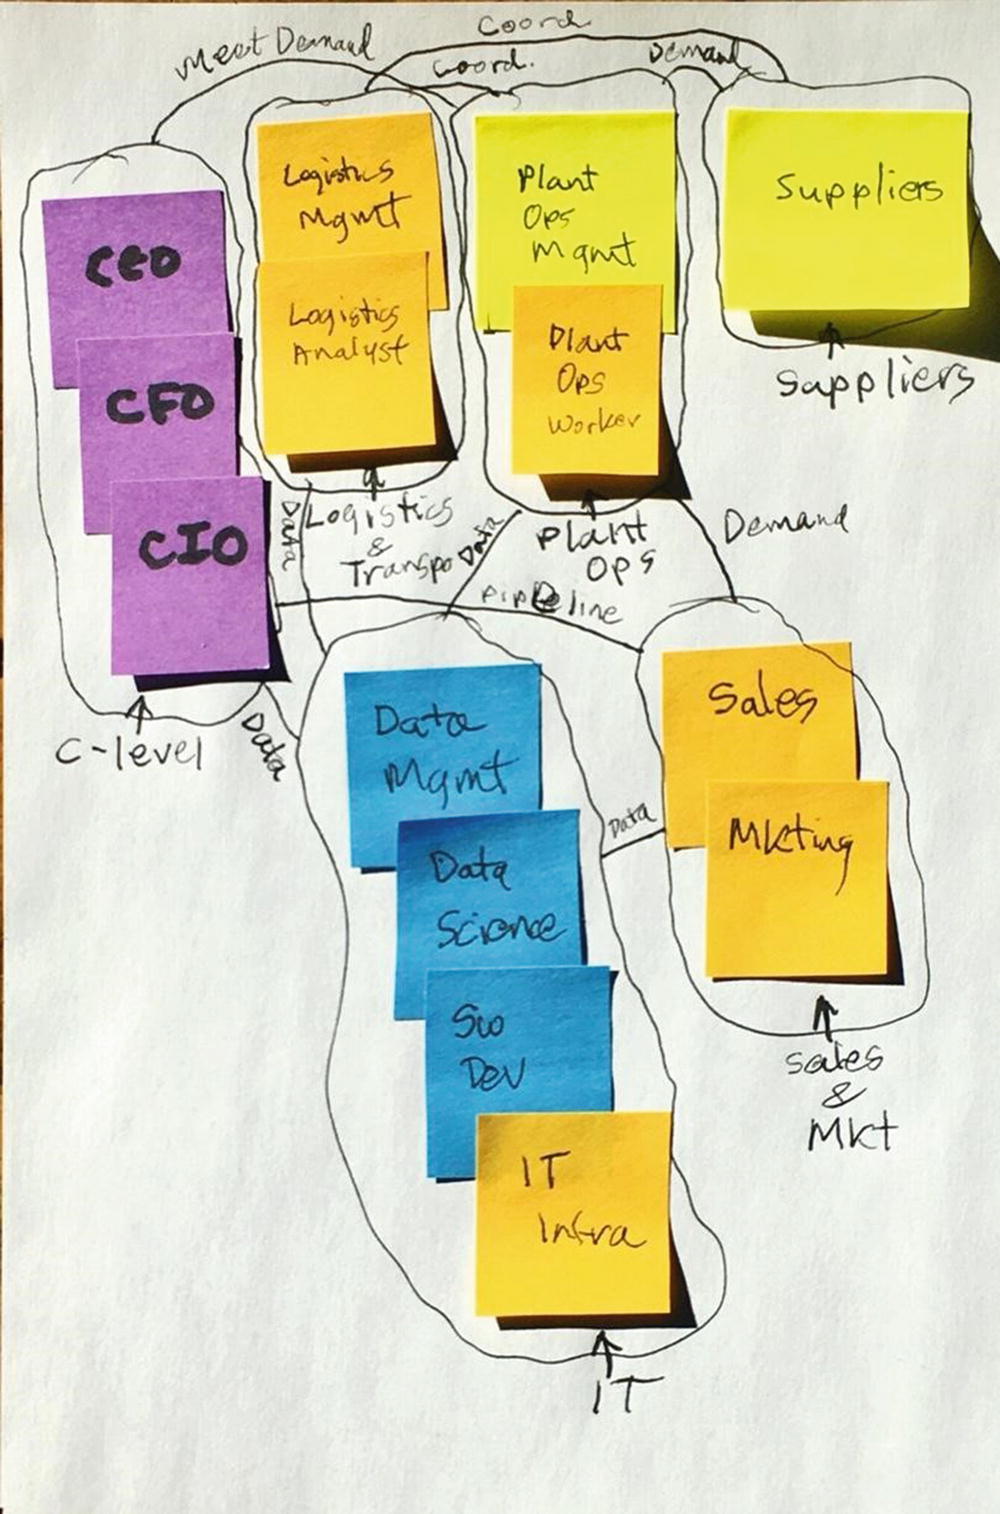
Example stakeholder map denoting relationships
After preparation of the stakeholder map (usually taking about 10 to 15 minutes to do this), designated spokespersons from each team describe their stakeholder map to other teams and solicit comments. Additional stakeholders and/or relationships might be added as a result of these comments. The diagrams are posted on the wall space assigned to each team.
Method: Proto-Personas
Each team then chooses two or three key stakeholders to focus upon that influence, impact, or control the scope of the problem to be solved.
Stakeholder name and demographic information (such as title/role)
Stakeholder behaviors and tasks, especially those related to the selected problem scope (you can use the “jobs to be done” method also described in this section to further hone into the tasks that matter to this proto-persona)
Stakeholder needs, goals, and motivations
Stakeholder frustrations and challenges
Proto-personas are based on opinion and observation from other parties. They can contain some bias and should be validated through additional research of the actual group. But they are a good place to begin understanding the needs, motivations, and tasks of others. For example, you might define user experience personas to represent that group of stakeholders in order to build empathy for them. In comparison, high-fidelity personas are typically created from research, interviews, observations, and facts.
About 30 minutes should be allocated for each team to prepare their easel sticky sheets (so, about 10 to 15 minutes for each stakeholder). The sheets are then posted on the wall space assigned to each team. Stakeholder descriptions are explained to the other teams by an assigned team spokesperson. Other teams can then provide comments and suggest adjustments where needed.
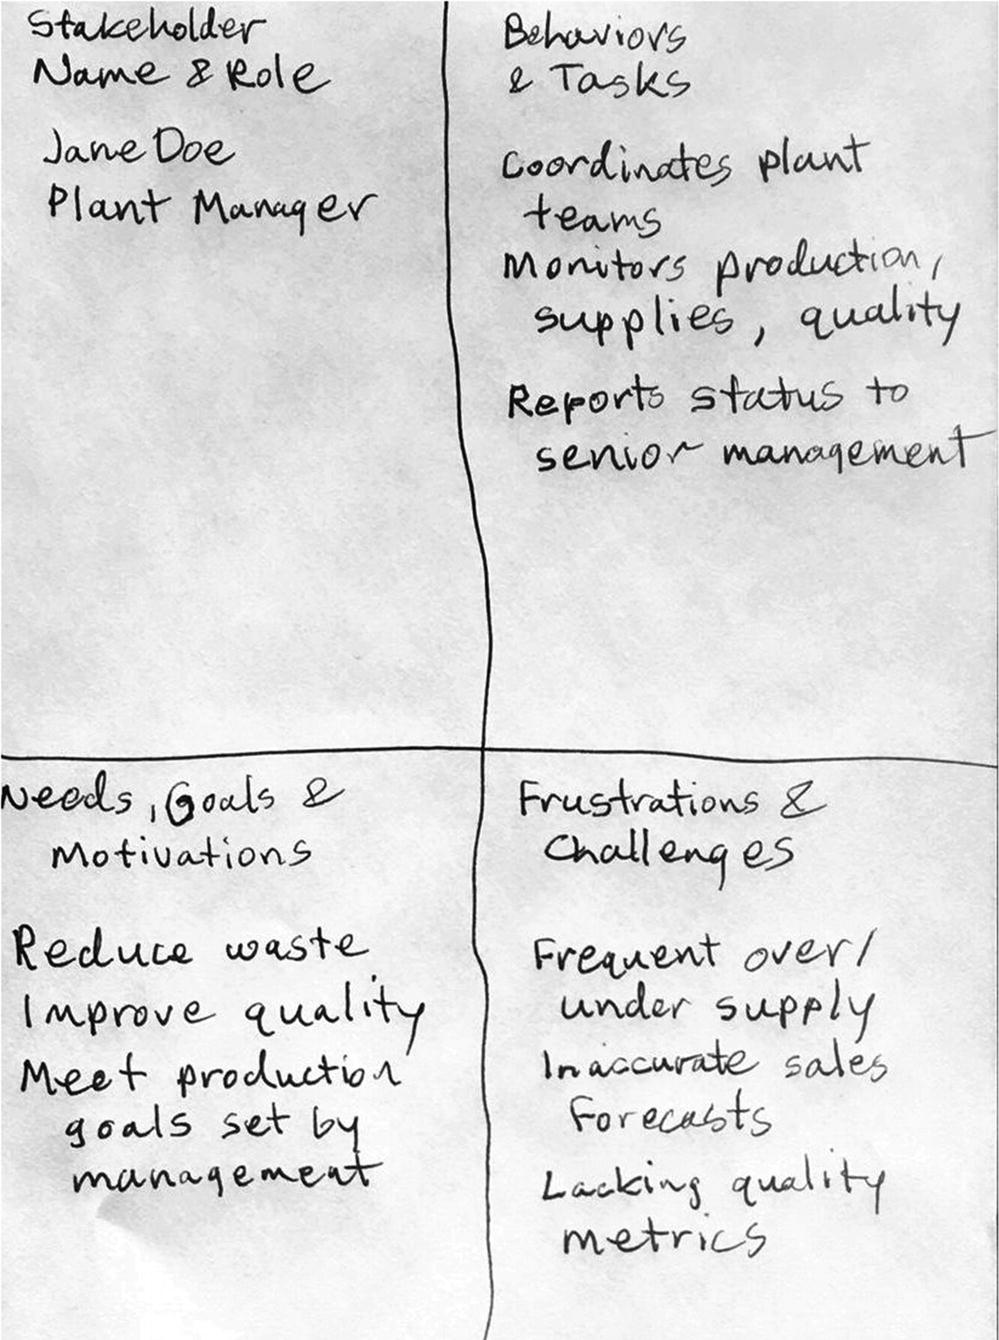
Example stakeholder description for a plant manager
When undersupply occurs, I want to automatically alert supplier so I can minimize production disruption.
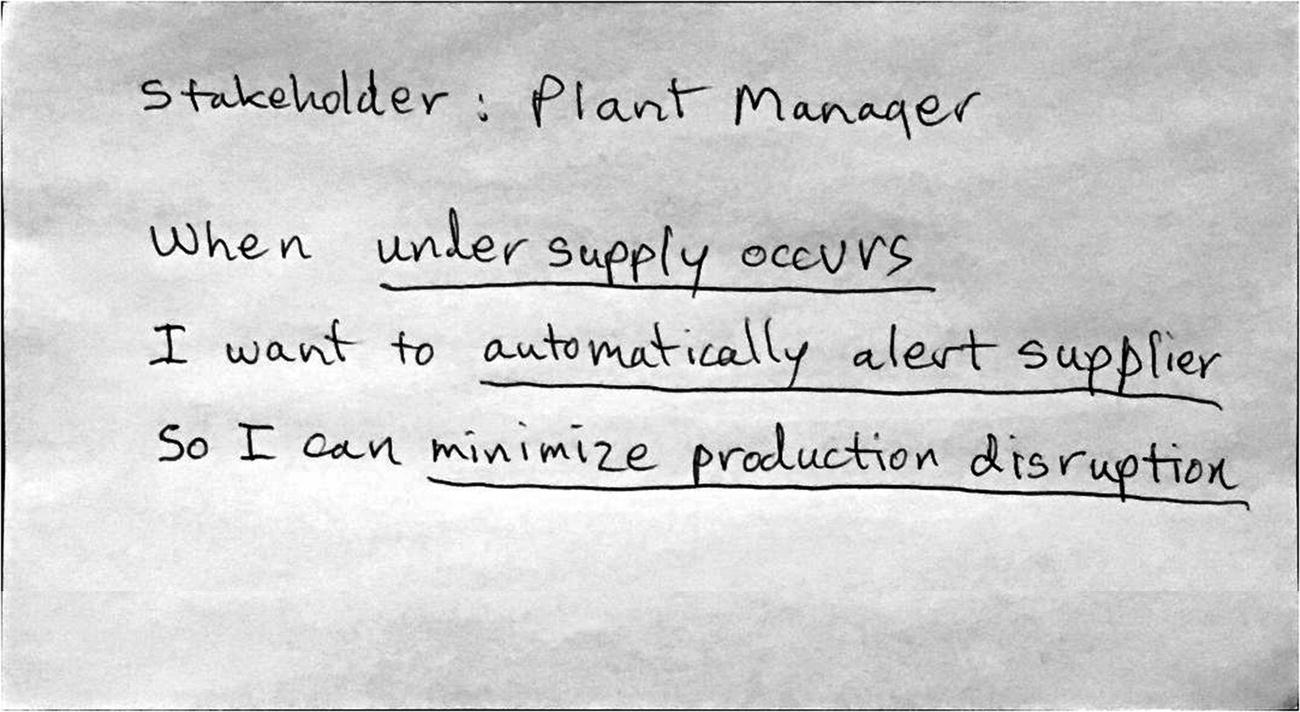
Example “jobs to be done” statement for the plant manager
Additional sheets describing other stakeholders can provide the teams with additional perspectives regarding the importance of solving the problem that they are thinking about pursuing.
In our example, the C-level leaders have a more complete view of running the business. Their behaviors and tasks include setting strategy, managing investments, determining margins, forecasting sales and financial results, optimizing their business, and building the company’s reputation. Their needs, goals, and motivations include more accurate forecasts, smarter investments, increased margins, and decreased risk. Frustrations and challenges include a lack of timely data, aging facilities, widely varying manufacturing equipment sophistication and age, widely varying skills among employees, and varying performance among their plants.
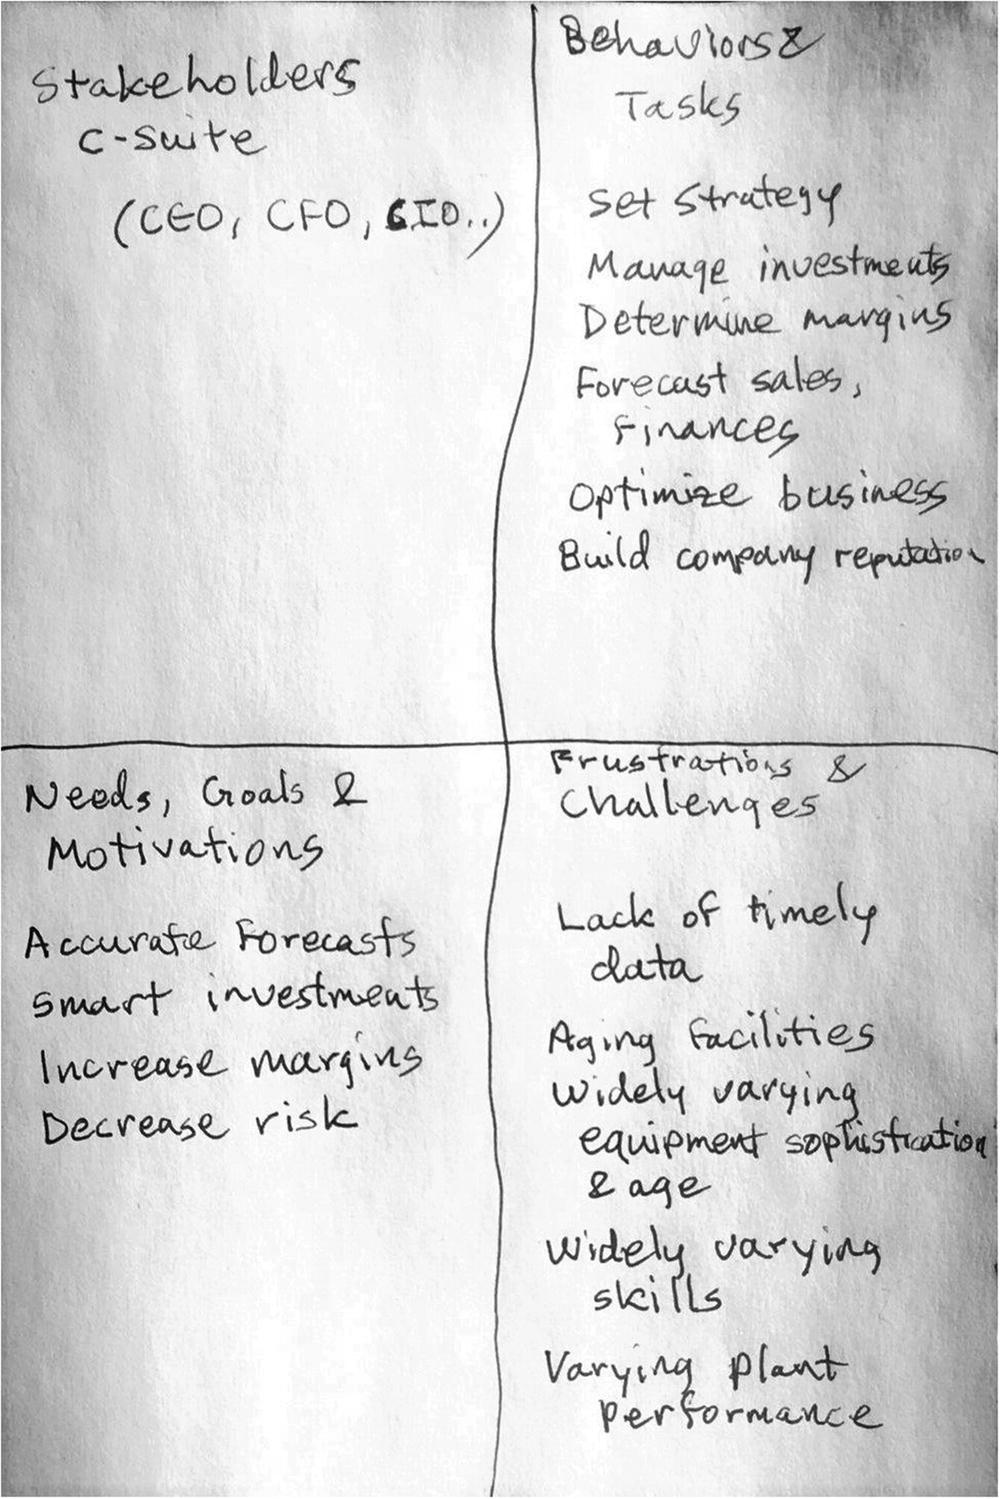
Example stakeholder description for the C-level leadership
Positives, Opportunities, and Negatives
In this exercise, we identify positive situations that will occur as a result of addressing the scope that was previously identified, new opportunities that could emerge, and negative situations that will also likely occur. We have seen this popular exercise represented in drawings on easel sheets as a rose (with rose, bud, and thorn), as a sailboat (with sails, wind, and anchors), and as a stoplight (green light, yellow light, and red light). We then cluster our sticky notes into areas of impact.
We begin by describing the rose-bud-thorn method here.
Method: Rose-Bud-Thorn
Each person within each team uses sticky notes to indicate what should work well, new opportunities, and likely problems that will be encountered in addressing the scope. Each person writes positive statements as it relates to the scope they are addressing on pink sticky notes, considered to be rose items. Opportunities with potential are written on green sticky notes, considered to be buds. Negative statements or challenges are written on blue sticky notes and are considered as thorns. By denoting these types of statements on different colored sticky notes, it will make identifying the category that they fit into easier when each team member places their sticky notes onto a sticky easel sheet.
The purpose of this exercise is to help everyone clearly see the pros and cons of addressing the identified scope. At this point, the facilitator can also ask what the cost is if nothing is done, because asking about cost helps to create a sense of urgency around the change that needs to happen. This method also uncovers problems that need to be avoided in the design ideas that the teams will generate later.
In our supply chain optimization example, team members denoted that positive outcomes include “improve sales,” “improve revenue,” “improve finance forecasts,” and “understand shortages sooner.” Opportunities that they identified include “quality improvement,” “improve marketing outcomes,” “reduce waste,” “new data sources,” and “proactive fixing.” Negative implications identified include “project cost,” “data quality issues,” “manufacturing equipment upgrades,” and “union contract implications.”
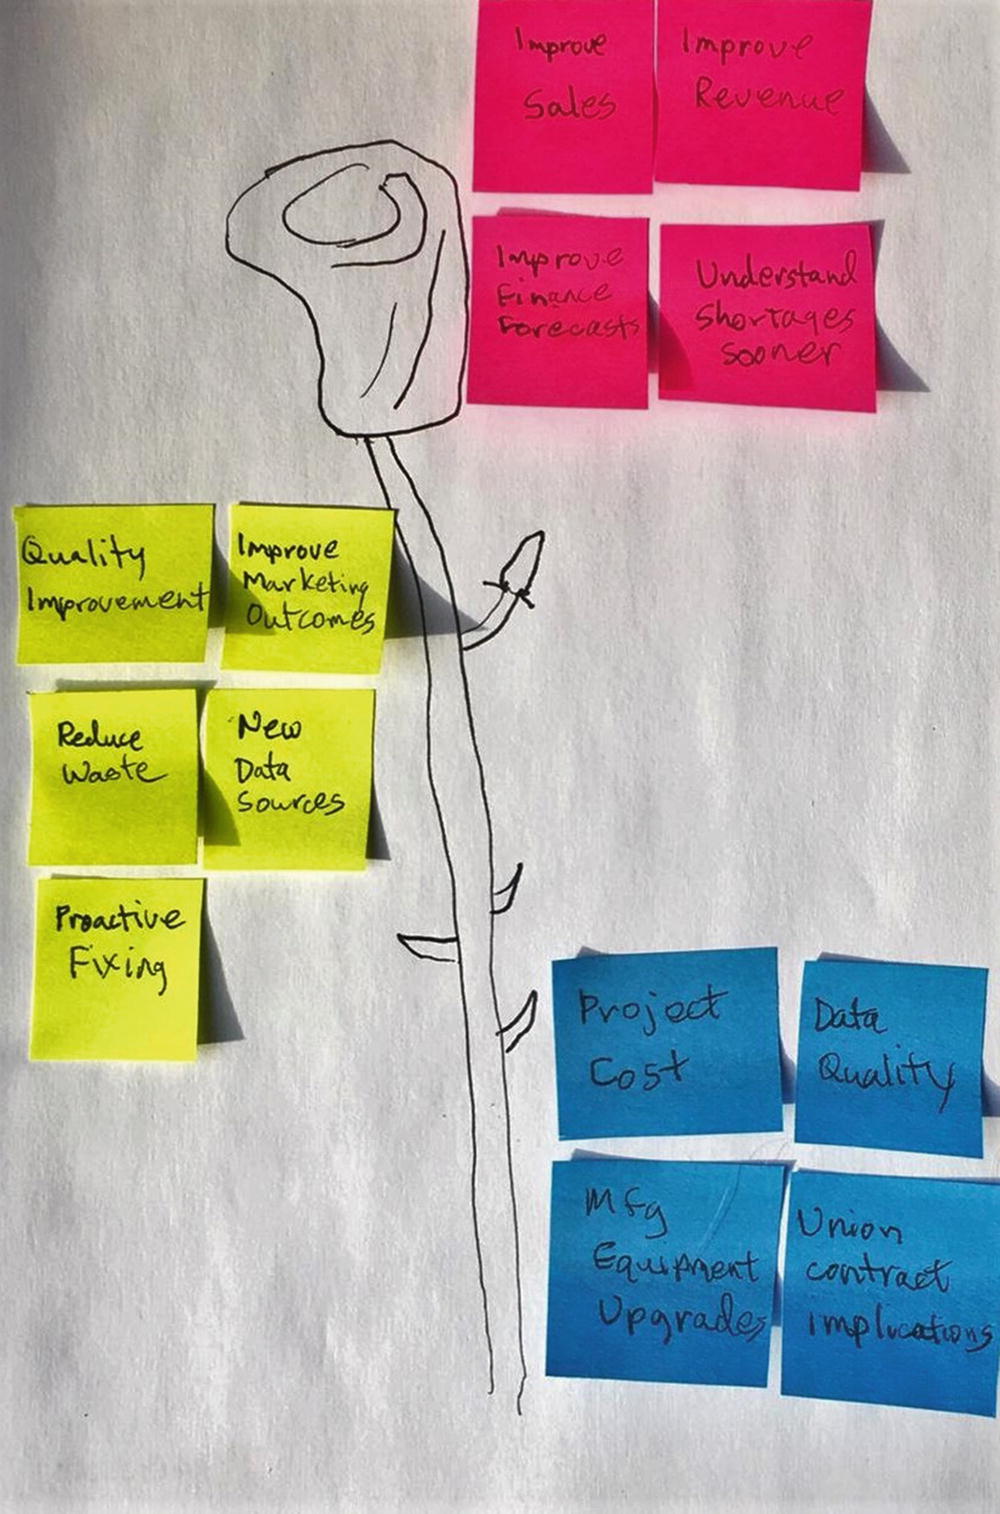
Example rose-bud-thorn illustration of positives, opportunities, and negatives
Method: Clustering Areas of Impact
The team leader and/or proctor then places the sticky notes into clusters on a different easel sticky sheet into areas of impact. The clusters are labeled appropriately (with input from team members).
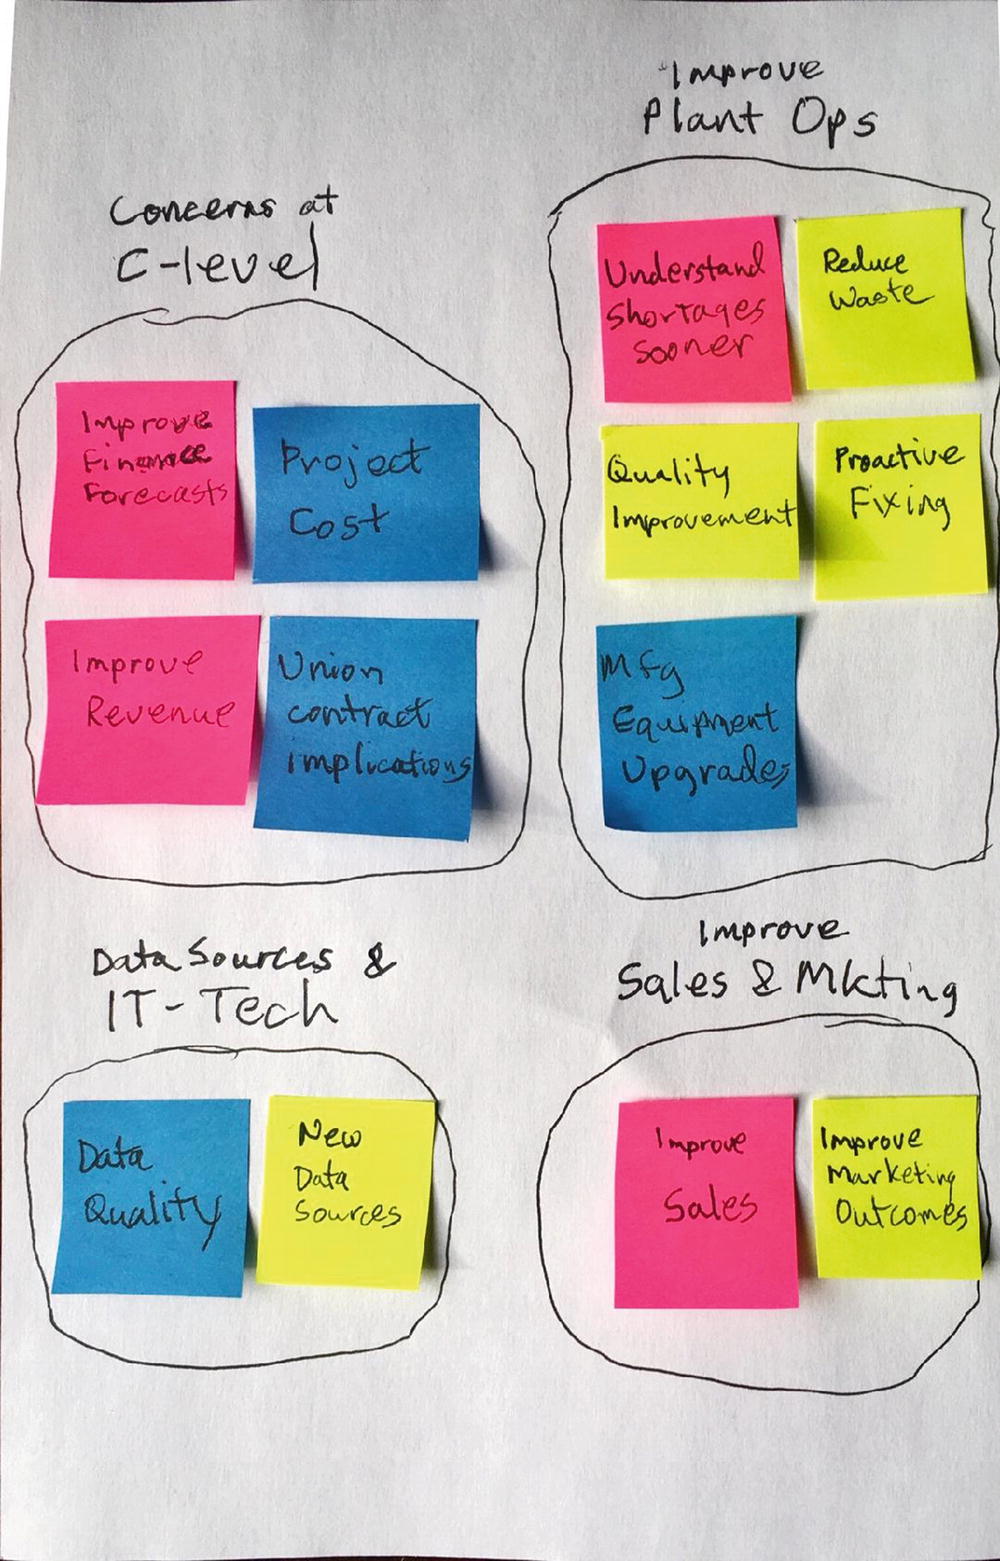
Positives, opportunities, and negatives grouped into areas of impact
The entire exercise using these two methods should take about 20 to 30 minutes. Upon completion, the sticky easel sheet is placed on the team’s wall space. A designated spokesperson from each team describes the positives, negatives, and opportunities to the other teams present and solicits their input.
Refine to One Problem Statement
We now have a variety of possible problems to solve represented by the various clusters. In our example, these include addressing the concerns at the C-level, improving plant operations, addressing data source challenges, and improving sales and marketing efficiencies and outcomes. In order to help converge on the right problem to solve, we can use the “how might we” method to enable focus on the most important challenge.
Method: How Might We…
Each team now selects a “best” single problem category. The category selected is usually most aligned to key stakeholders’ needs and has impressive positive outcomes and potential new opportunities with fewer negative implications. Often, team members vote with stickers to make this selection. Once the selection is made, a problem statement is created that states “how might we” do a certain action “for” a primary stakeholder “so that” a desired effect occurs.
How might we improve plant operations for plant management (or for the C-level) by understanding supply chain shortages sooner
How might we improve plant operations for plant management (or for the C-level) by reducing waste during manufacturing
How might we improve plant operations for plant management by improving quality of manufacturing output
How might we improve plant operations for plant management (or for frontline plant workers) by proactively fixing equipment
How might we improve plant operations for plant management by upgrading existing equipment
The team then selects (usually by voting) the problem statement it wishes to address. The statement is written on a sticky easel sheet, posted, and explained by a designated team spokesperson to the other teams. Other teams can provide further input. At this point, we have spent about 20 to 30 minutes on this exercise.
If each team is working on a different problem and if the statement is agreed upon, they are ready to move onto design and delivery in the solution space. If multiple teams are working on a single problem, each team will present their statement and another vote will take place such that a single problem statement will be selected as the basis for further exercises.
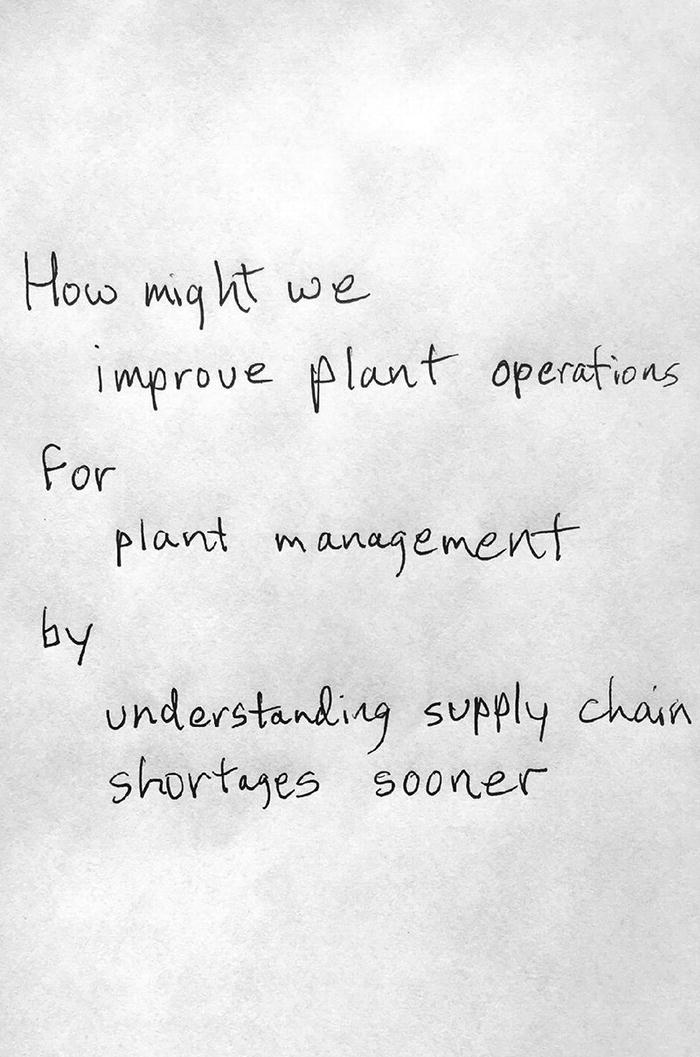
Example problem statement
Summary
Introductory individual baseball-style cards – 5 minutes
Selection of goal(s) – 10 minutes
Selection of diverse teams and naming – 10 minutes
Creating a unified vision and scope – 10 minutes
Identifying and mapping stakeholders – 10 to 15 minutes
Creating proto-personas of key stakeholders – 30 minutes
Denoting positives, negatives, and opportunities (rose, bud, and thorn or similar) and clustering areas of impact – 20 to 30 minutes
Refining our efforts to one problem statement (how might we) – 20 to 30 minutes
When each individual or team presents results of their efforts or votes, about 5 to 10 minutes per individual/team should be allocated. Thus, the length of time for this portion of the workshop could range from about half of a day to a full day depending on the number of teams and participants.
There should now be alignment and a deeper understanding of the nature of the problem to be solved within each workshop team. As all the participants are engaging in the workshop process, they should feel some ownership in finding a solution. All should also understand how addressing the identified problem could be received by key stakeholders based on their proto-personas and the positives, negatives, and opportunities associated with solving the problem.
Using the workshop methodology and example that we outlined thus far, you might be starting to wonder if a software- or AI-related project will always be the result of these exercises. Sometimes, a Design Thinking workshop can bring non-software-related projects to top of mind, especially as we traverse the exercises in the solution space diamond of the Double Diamond approach in the next portion of the workshop.
However, we now have agreement on what is believed to be a real problem. Usually after the problem statement has been selected, the facilitator will call for a break appropriate for the time of day at which this point is reached (e.g., lunch, afternoon refreshments, or conclusion of the first day) since we have now completed the problem space diamond.
In Chapter 4, as we explore ideas related to solving the problem, we will see how software and AI projects frequently do emerge as possible solution outcomes of the workshop.