The participants and teams who are taking part in the Design Thinking workshop should now be focused on specific problem statements. They have reached the midpoint of the workshop and have experienced divergent and convergent thinking in exploring the problem space.
In this chapter, we describe best practices in using divergent and convergent thinking to determine the best solutions for their problem statements. We will traverse the right-hand solution space diamond of the Double Diamond approach that was introduced in Chapter 1.
Since we have agreement around the problem statement(s), we will broaden our exploration of possible solutions. Then we will narrow our focus to a best solution that has significant desirable business impact and requires an acceptable (and possibly minimal) amount of effort. In this chapter, we describe approaches to help the workshop participants generate many thoughtful ideas for solutions, visualize them, iterate to improve them, and then narrow down to solutions that they want to pursue. We will then build a road map to create ownership and accountability to begin moving solutions from ideas to reality.
Solutioning does not begin until participants fully traverse the left-hand problem space diamond as was described in Chapter 3. Unfortunately, in our experience, participants often want to jump straight to solutioning at the expense of not knowing all the facts, gathering contributing or dependent information, or understanding how change could affect other stakeholders. The prior exercises should have helped participants uncover those areas and should enable them to consider more facts related to the ideas and solutions that they develop in this part of the workshop.
Refresher and restate the challenge
Getting inspiration
Understanding innovation ambition
Solution ideation
Narrowing solution choice
Solution evaluation
Road map
Summary
Refresher and Restate the Challenge
Prior to beginning the solution space exercises that are held during the Design Thinking workshop, there is normally a break. The break could be overnight, during lunch, or for snacks or other reasons depending on the length of the problem space part of the workshop. Participants could begin to exhibit sleepiness if they eat during the break or tiredness from working on the earlier problem definition.
Stand and stretch
Stand and create new dance moves
Stand, walk around the room twice, and sit down
Play rock paper scissors with neighbors where winners continue to play until there is a room winner
Participants will now be ready to take another look at problem challenge statements that were selected. Facilitators might invite the key stakeholder or another participant to restate them for the room. They might also lead a conversation to confirm everyone agrees these are the most important topics to focus on.
All the teams might be working on a single problem, or one or more teams might choose to work on different problems depending on goals for the workshop.
Facilitators must use this prelude to build consensus and ensure that the participants are alert and ready to move on. They should remind participants that they are about to start the fun part of the workshop where they get to create solutions.
Getting Inspiration
Beginner’s mind
Review data and research
Outside perspective
Lightning demos
Inspiration landscape
The goal is to use these methods to stoke idea generation and encourage participants think outside of their immediate boundaries.
Method: Beginner’s Mind
The beginner’s mind is a concept from Zen Buddhism. It is described as having an attitude of openness, eagerness, and lack of preconceptions when studying a subject, even when studying the subject at an advanced level. The subject is approached as a beginner would.
Embracing a beginner’s mindset enables one to stay open to any topic or experience no matter how advanced their knowledge becomes. It is the opposite of thinking that one knows everything about a topic and is centered on the idea that having some knowledge is not enough.
A good place for participants to start is to embrace more openness in understanding the problem space. They should be encouraged by the facilitator to look at what was previously uncovered with fresh eyes. This helps remove bias and clouded prejudgments or preconceptions and fantasies about the nature of the problem and what the solution could be. The format is usually an open discussion lasting from 10 to 30 minutes.
An open mindset should lead participants to put more focus on listening, becoming curious, asking more questions, and embracing not knowing. They will likely be more satisfied as they take part in the exercises in the workshop and formulate new ideas with other participants. This approach should help everyone gain a deeper understanding of the problem that needs to be solved.
This activity can seem foreign to some and takes practice. But it can be very worthwhile leading to more elegant, inclusive, and impactful ideas.
Method: Review Data and Research
An open mindset can drive participants to want to return to the exploration work performed at the beginning of the workshop and review the challenges present and the problem that really needs to be solved. There could be additional data and research available that could help. The data could be quantitative or qualitative and provide new inspiration.
Quantitative data provides actual quantities and status, reflecting what is really happening. A few examples include data items, such as orders, delivery dates and pricing, process flow status, and data held in activity logs. Qualitative data describes why events are occurring by depicting them in their natural settings and can be used to interpret the meanings that people bring. For example, qualitative data might include sentiment, purpose, and reasons for behavior and can be captured in interviews, reviews, and questionnaires.
Both types of data are useful in fully understanding what is happening. For instance, in the supply chain optimization example that was introduced earlier in this book, we might know through quantitative data that plant managers and plant operations personnel have stopped ordering parts from a certain supplier, choosing instead to use alternative suppliers. This does not tell us why they stopped using that supplier. Qualitative “feeling” or “behavior” data can help pinpoint where the dissatisfaction lies and will hint at ways to remediate it. Here, we might uncover that there is a poor relationship between the supplier’s sales representative and the plant manager.
A discussion at this point about the data and research is usually led by the facilitator and/or sponsor and varies in length from 10 to 30 minutes. If additional exploration is determined to be needed, the beginning of solution space exploration might be delayed appropriately, but the insight gained could be well worth it.
Method: Outside Perspective
We can gain the perspective of those outside of the organization by inviting them to review the information already gathered in the workshop and to offer their opinions. An outside perspective can help to assure objectivity and provide new perceptions and ideas that are not subject to internal orthodoxies and norms. It can help eliminate the mindset of “that’s how it has always been done,” remove bias, and help the organization get outside of its comfort zone.
We might solicit insights from partners, consultants, customers, and those who work in related industries. This feedback can help us learn from the mistakes of others and discover how others have solved problems like the challenges that are being faced.
When the problem to be solved is specific to customers or partners, it is particularly useful to have them engaged. They will understand the context of the problem and offer additional considerations that we might not have thought of. They can also help to define a better solution when brought into this process.
The need for such outside review is a good thing to discuss in prior to the Design Thinking workshop as it gives the facilitator time to set up appropriate conference call meetings and invite the right participants. Reviews at this stage are usually about 30 minutes in length.
Method: Lightning Demos
Lightning demos are an informal way to get a good understanding of what is already available as a solution. The exercise begins with having participants within each team make a list of various products and services that can inspire a solution (taking no more than 20 minutes). Participants are encouraged to think outside of their field or industry when making their lists to help ensure that they are not simply copying competitors.
Once the lists are complete, each participant gives a 3-minute talk within their team about one of the solutions on their list. The participant describes why the solution that they selected is compelling and how it applies to the current problem space.
As presentations are given, a scribe takes notes. Visuals might also be created that represent the ideas being described. Votes can be taken regarding continuing to explore these solutions during the second half of the workshop.
Method: Inspiration Landscape
You might instead be asked to evaluate approaches previously used within your organization, by competitors, and outsiders not in your industry related to the problem that you are trying to solve. We will refer to these individuals here as the players. This information can be gathered into an inspiration landscape worksheet or similar document. (The XPLANE website has their version of the worksheet publicly available for downloading at https://x.xplane.com/inspiration_landscape_worksheet.)
When performed as a team exercise, each team will draw a version of the worksheet on a sticky sheet that will have rows representing the status of the three types of players being evaluated. A column to the right of each player type lists the good, positive, or interesting things that the player is known for relative to the problem. A column farthest to the right lists the bad things that we likely want to avoid as it is populated with problems, issues, and the lessons learned. When a diverse and knowledgeable team works on filling it out, the exercise usually takes about 30 minutes.
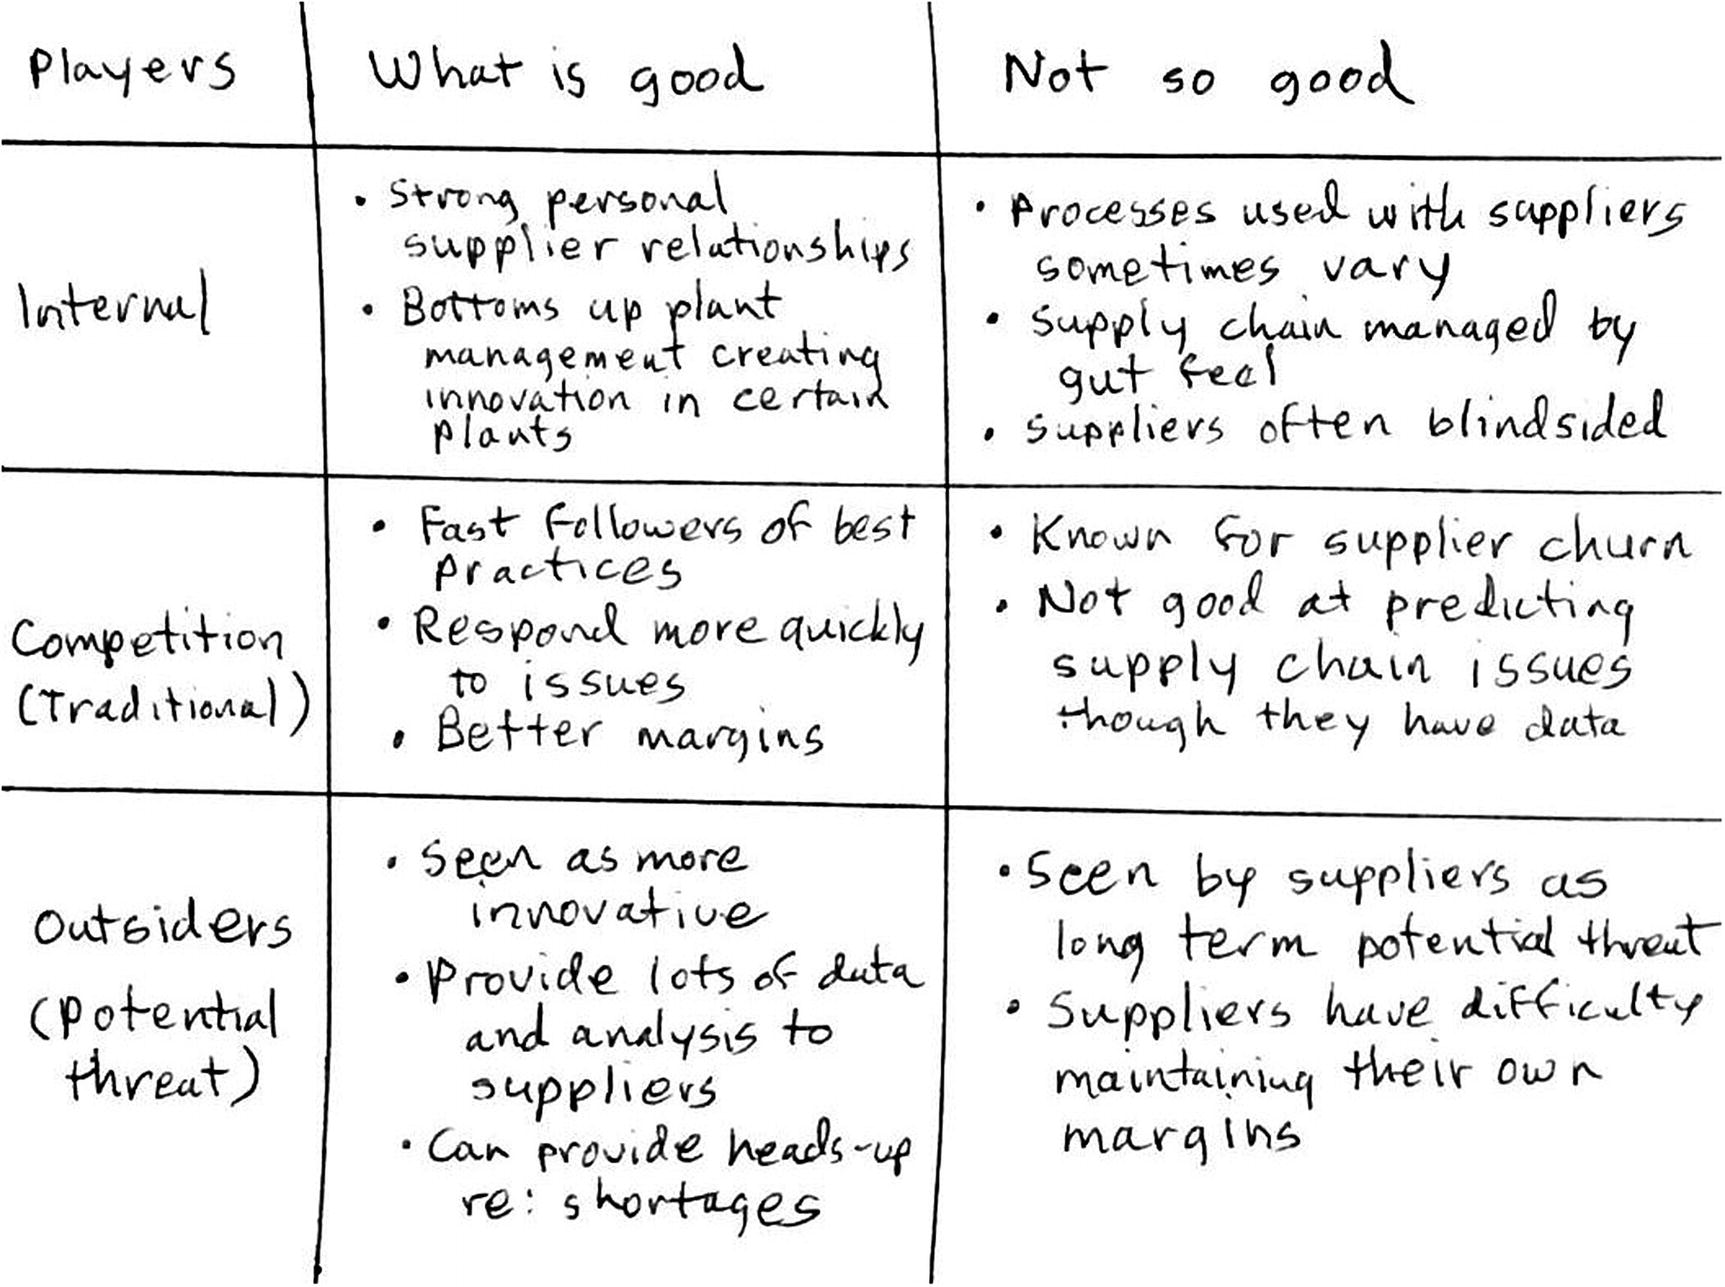
Inspiration landscape for the supply chain optimization example
Understanding Innovation Ambition
Before gathering ideas regarding how we might solve the identified problem, we might want to gage the innovation ambition tolerance within the organization. This can help workshop teams understand where they should focus when defining potential solutions. They should understand if their ideas for solutions are expected to be disruptive and highly strategic in their industry, solve an immediate crisis that is highly tactical, or span the broad spectrum.
A means of classifying where solution ideas might fit is described as an innovation ambition matrix. It is described in an article published in May 2012 in the Harvard Business Review (see the Appendix for a link to the source). The matrix describes the three kinds of initiatives that organizations typically undertake as being core, adjacent, or transformational.
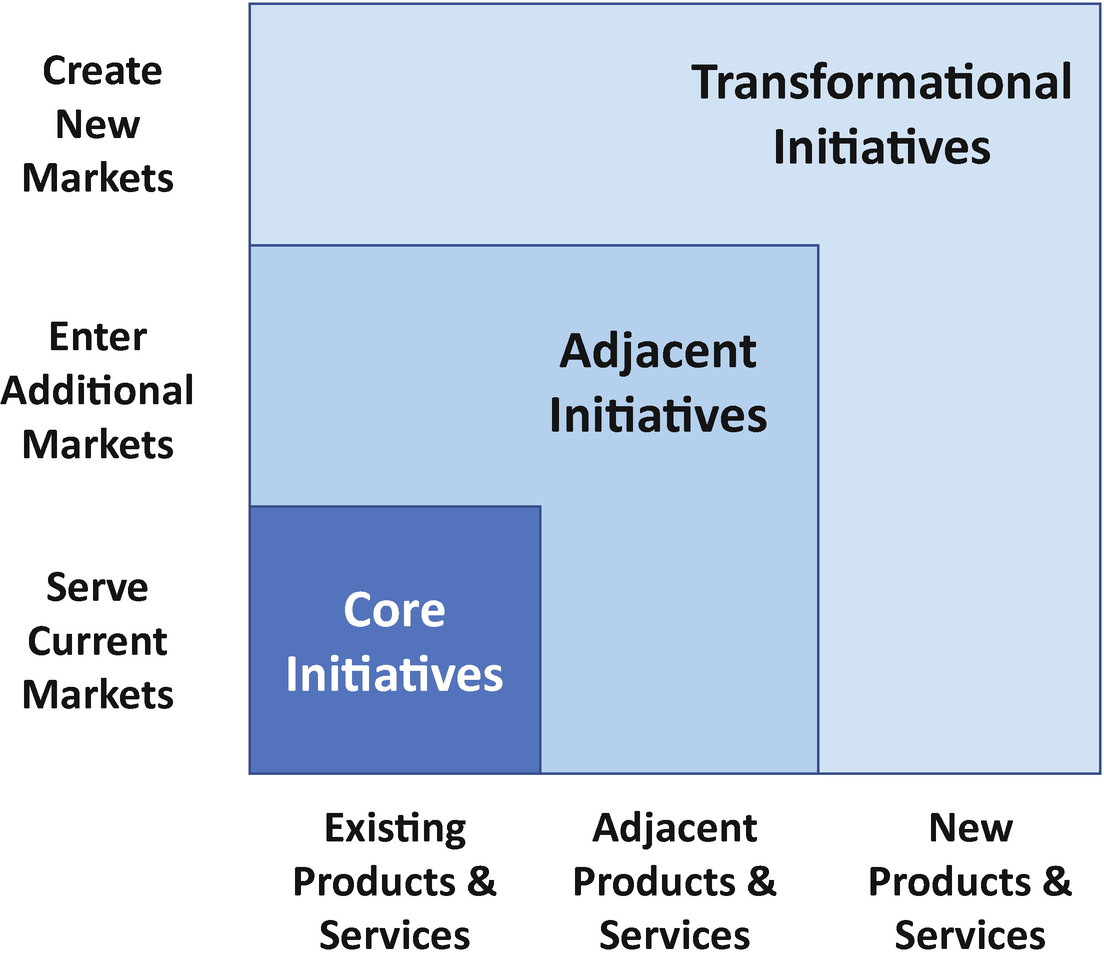
Innovation ambition matrix
Core initiatives provide small incremental innovation that improves an existing product or service offering. For example, converting a manual process that is currently accomplished on paper to digital would be considered core. Other examples include packaging changes or simple design modifications to an existing product. These are valuable initiatives but are not considered revolutionary to a business segment or to an industry.
More adventurous ideas are labeled as adjacent initiatives. In these initiatives, the organization enters adjacent markets and serves new customers by modifying existing products and offerings to provide needed capabilities. This approach enables the organization to extend their current resources and skills to serve the expanded audience in a whole different way.
At the far end of the spectrum are transformational initiatives, often considered to be true game changers. The organization creates entirely new products to service new markets that they create. For these initiatives to be successful, there must be a willingness to invest in new assets, skills, and development of the markets. When successfully accomplished, these can provide an organization with a first to market advantage as well as enabling a whole new business.
The facilitator can draw the innovation ambition matrix figure or use a printed copy to reference as they lead a discussion about the types of initiatives that could be considered viable in the organization. This 20- to 30-minute discussion will help the teams focus on developing solution ideas that are more likely to be adopted. If the organization is looking for ideas beyond those found in core initiatives, it can also help spur participants to think outside of their traditional boundaries.
Solution Ideation
We are now ready to begin solution ideation. Our goal is to expand the thinking and ideas of everyone on the team but also create something that is greater than the sum of the parts. Entering this divergent phase of the solution space, we want to gather as many ideas as possible from everyone.
The method that we use to generate solution ideas is called the creative matrix.
Method: Creative Matrix
The creative matrix is a tool that will help spark ideas that are formed at intersections with discrete categories. The matrix is formulated based on who the solution must serve and the criteria being used to define it.
Each team writes their problem statement (how might we…) at the top of a sticky easel sheet to begin the exercise and then draws a grid. Each cell will represent the intersection of people for whom the solution could be relevant and business enablers. The grid columns are defined as the groups of people for whom the intended solution is relevant (e.g., personas, market segments, or unique stakeholders).
Technology and digital media (analytical solutions, IoT devices, phones, tablets, watches, and lifestyle trackers)
Environments and interfaces (physical conditions, human requirements, engagement of senses, visualizations, and gamification)
Internal policies, procedures, and processes (also including incentives and training)
Public policies and laws (also including unwritten customs, upcoming legislation, and policy platforms)
Partnerships required (distribution and sales channels, suppliers, and consultants)
A wildcard category that could be used for ideas not fitting into the defined categories
Once a team’s grid is laid out, each participant is given a pen and a sticky note pad. They are asked to think of solutions to the identified problem that would be appropriate at intersections of the categories and solution audience. They write one idea per sticky note and stick it into the appropriate cell. Ideas that do not fit in any cell are put into a parking lot. This exercise should be limited to 30 minutes in length.
When every cell has been filled in or the time limit has been reached, teams huddle around their creative matrix and review the ideas. If multiple teams are working on the same problem, they might also review matrixes created by other teams. Each participant is then asked to vote on their favorite solution idea (or top two or top three) by placing a sticker or dot on the sticky note(s). The sticky notes with the most votes become the most promising solutions to further evaluate.
Just like we did in the abstraction ladder method that we described in Chapter 3, we use a combination of brainstorming and voting in the creative matrix method to generate ideas. The goal of brainstorming is to produce a large quantity of ideas in a facilitated, judgment-free environment. Since the voting on the solution ideas is subjective, we will apply additional methods to assess the proposed solutions when we seek to narrow our choices.
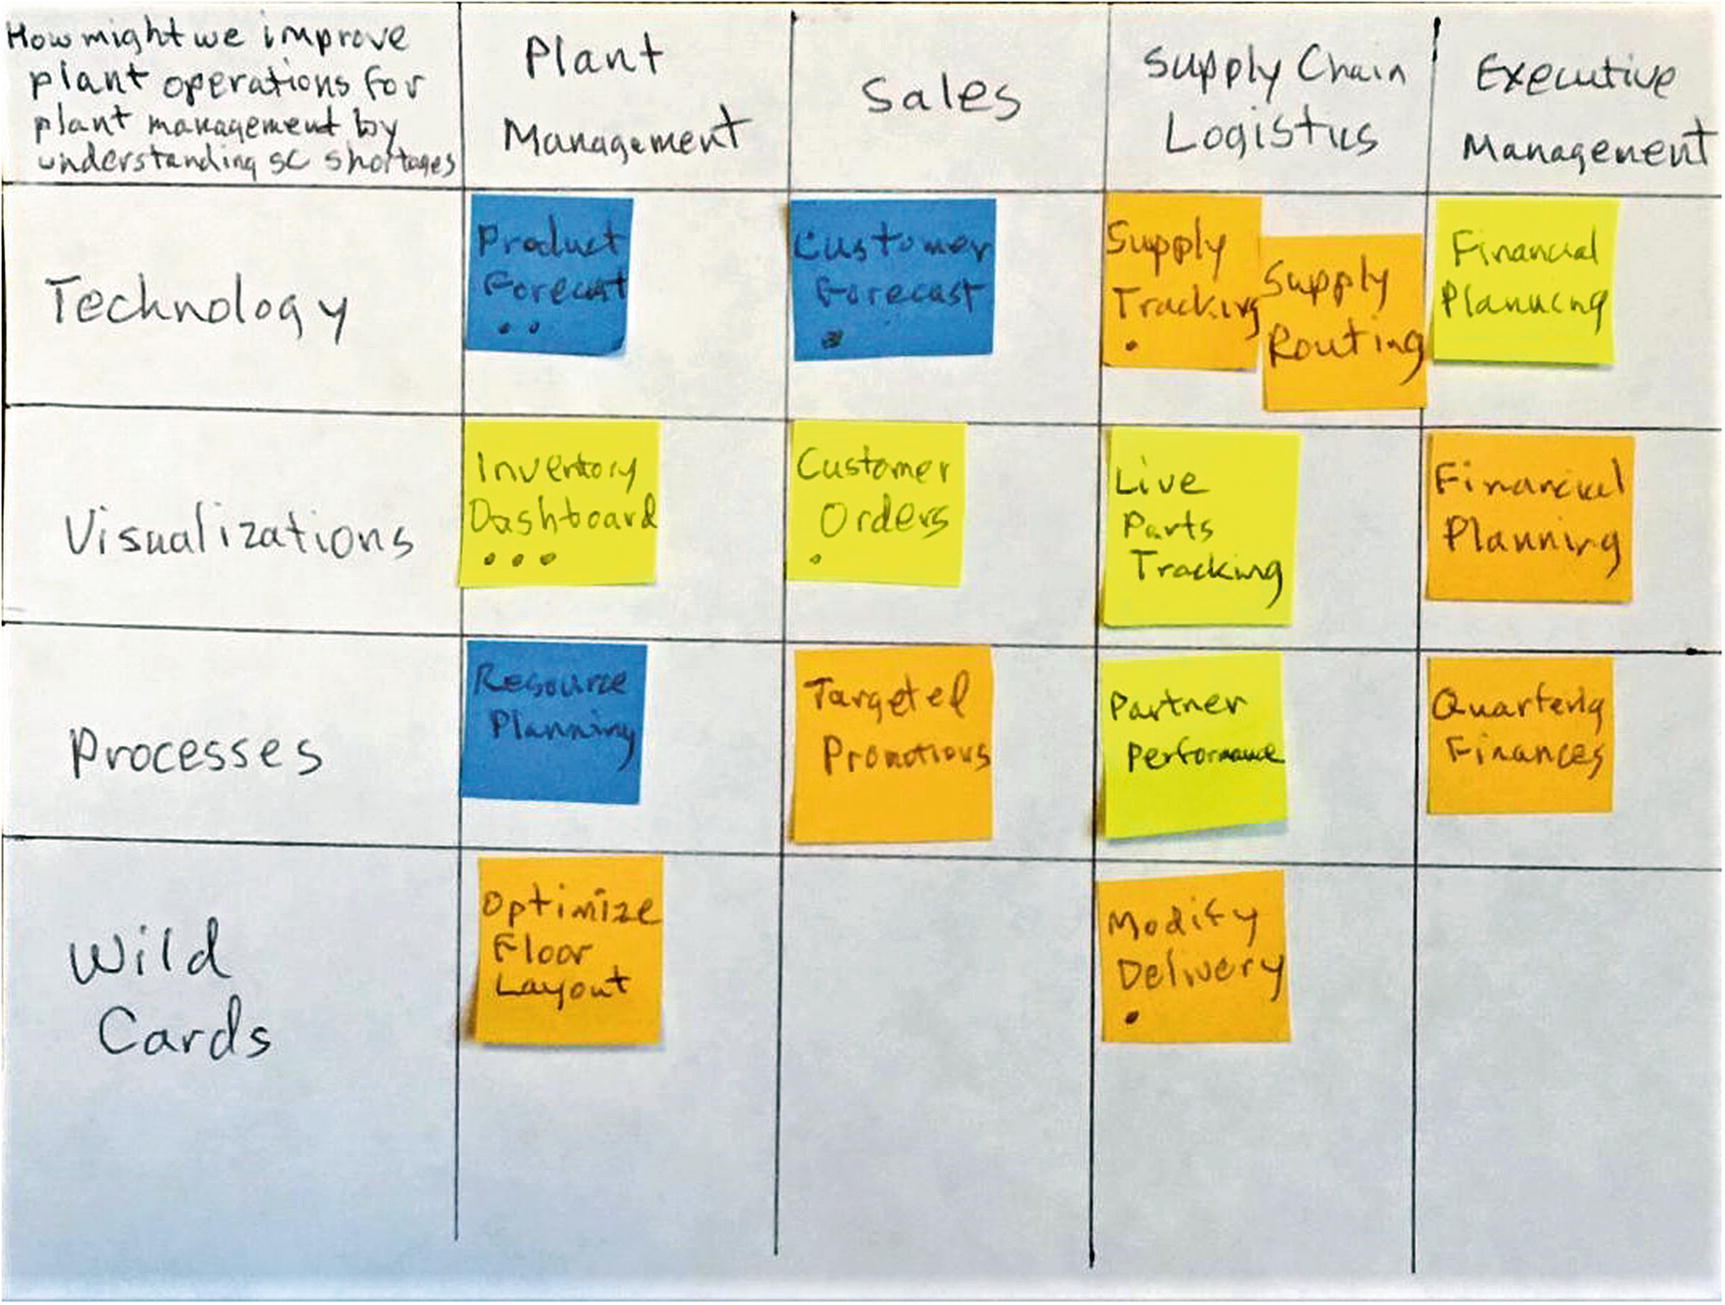
Creative matrix representing supply chain optimization example
We can see that the inventory dashboard solution received the most votes, but there was also interest in forecasting applied to product demand (especially the associated parts) and customer demand, tracking supplies (in transit), and modifying the type of delivery for certain parts.
Narrowing Solution Choice
Next, we must converge upon fewer solutions for each problem under consideration. (In some workshops, multiple solutions to a single problem are pursued with competing teams developing those approaches.) We prioritize the solutions under consideration and begin planning how we might move forward. To provide clarity regarding what the solution(s) consist of, we also need to provide visualizations. Methods in this section describe the effort value matrix and visualizations, including storyboards and concept posters.
Method: Effort Value Matrix
Not all solution ideas that were identified in the previous exercise should be weighted equally. That said, you might wonder how the weights should be assigned. Since it is likely that the organization is also dealing with constraints, many find that the right approach to use is balancing the anticipated value of the solution with the limited resources available to successfully develop and deploy it.
The effort value matrix is a prioritization framework that enables each team to evaluate their ideas according to the value that the solutions will bring and how difficult or complex that they will be to implement. Each team draws a vertical axis that is labeled “value” and a horizontal axis that is labeled “complexity” on a sticky easel sheet. Value increases from the bottom of the sheet to the top, and complexity increases from the left side of the sheet to the right.
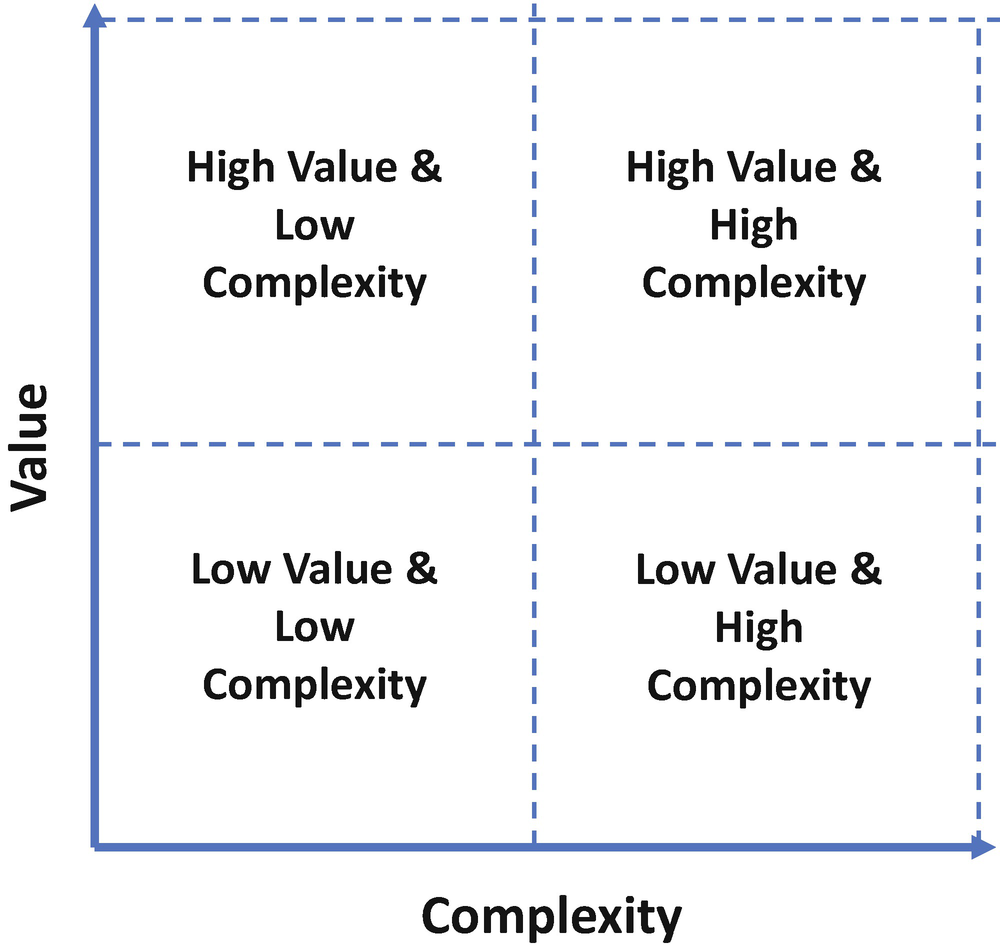
Effort value matrix
Next, the teams take their solutions sticky notes and place them in the appropriate quadrants and relative to each other on the chart. A best practice is to first place them along the value axis to understand that relative positioning and then move them into appropriate complexity positioning, maintaining their value stack rank order.
The matrix should help us see some low business value/high complexity solutions that we want to avoid implementing. The “low hanging fruit” solutions are those in the low complexity/high business value quadrant. That said, we might still place a high priority on certain high business value/high complexity initiatives, particularly if they are transformative, and that is a goal that we have identified. Thus, as we consider a solution road map, we will focus on solutions in these two quadrants.
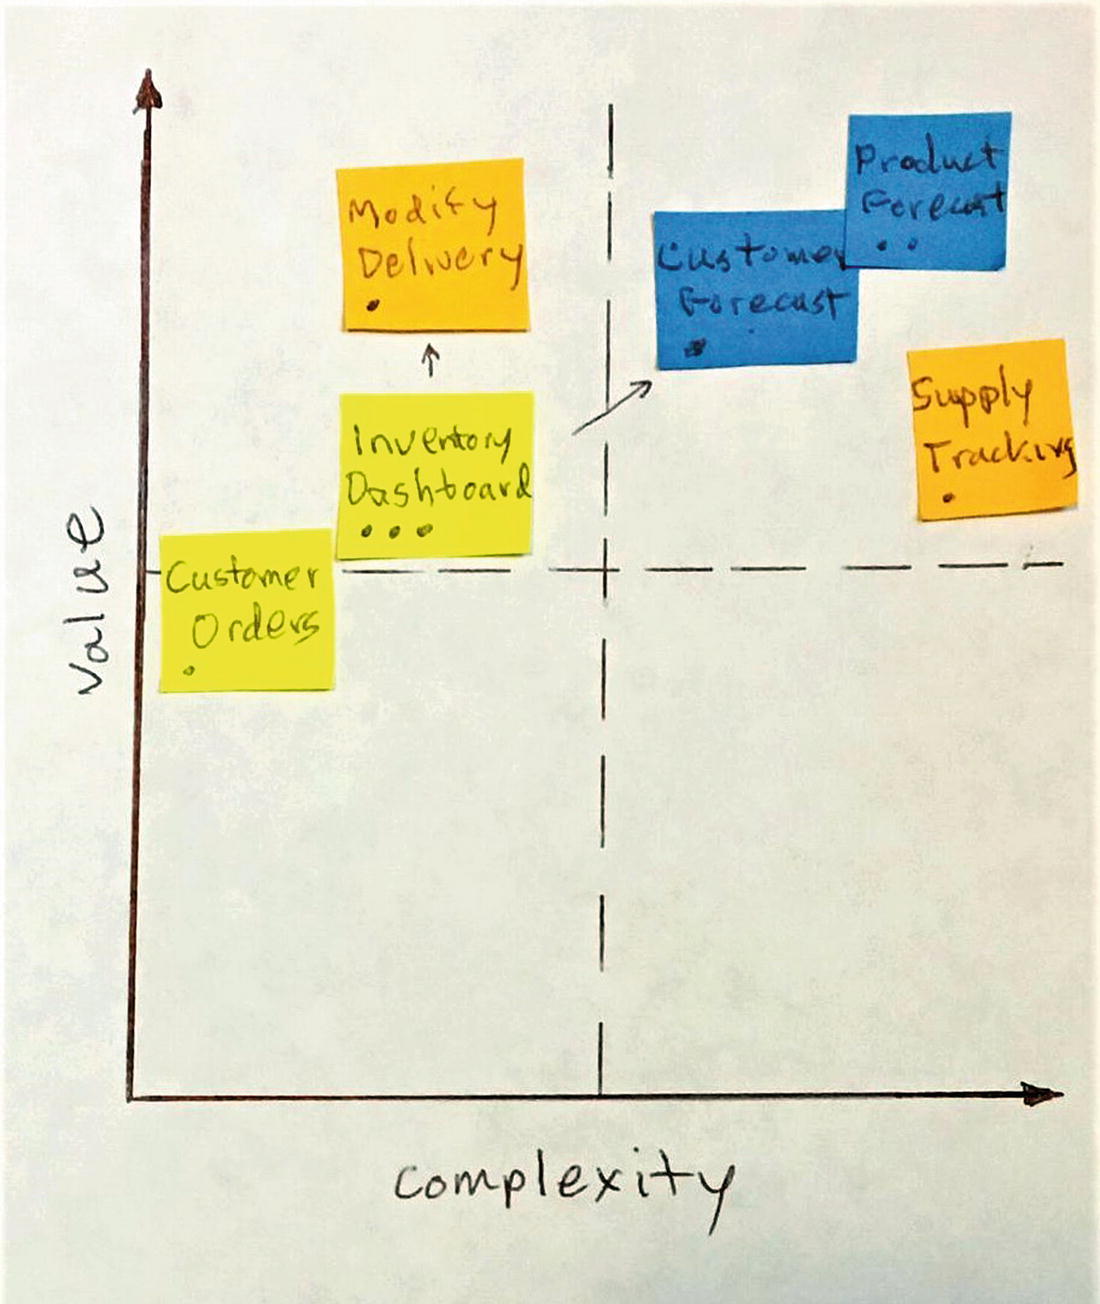
Effort value matrix for supply chain optimization example
The leading vote getter, the inventory dashboard, appears in the high value/low complexity quadrant. The arrows pointed at modify delivery and toward the forecasting solutions are used to indicate that we believe that the inventory dashboard and customer orders must be created prior to building these other solutions.
Our experience is that while this exercise can take as little as 5 minutes, longer discussions of 15 to 20 minutes can be quite worthwhile when relative values and complexities of solutions are debated and ascertained .
Method: Visualizations
A solution defined by a sticky note does an inadequate job of conveying the intent of the visionary behind the solution, how the solution will be utilized, and the value that it can provide. While a more detailed description can be written, a picture is often worth a thousand words.
There are several ways to visualize the solution. In software and AI projects, prototypes are normally developed outside of the scope of the Design Thinking workshop (as discussed in Chapter 5). In this section, we will focus on storyboards and concept posters that can be created while the workshop is in progress.
Simple physical models that are representations of solutions are sometimes created in Design Thinking workshops where physical products are being proposed. This technique is not typically used where software and AI developed solutions are an expected outcome.
A storyboard helps to visualize the solution service or process. It can help viewers quickly understand the problem being solved and the nature of the solution within a specific context. Workshop participants draw their storyboards on standard sheets of paper or notecards, using simplistic figures and providing a dialog that mimics a comic strip to tell their story. These help the viewer understand the solution’s value, usability, and application.
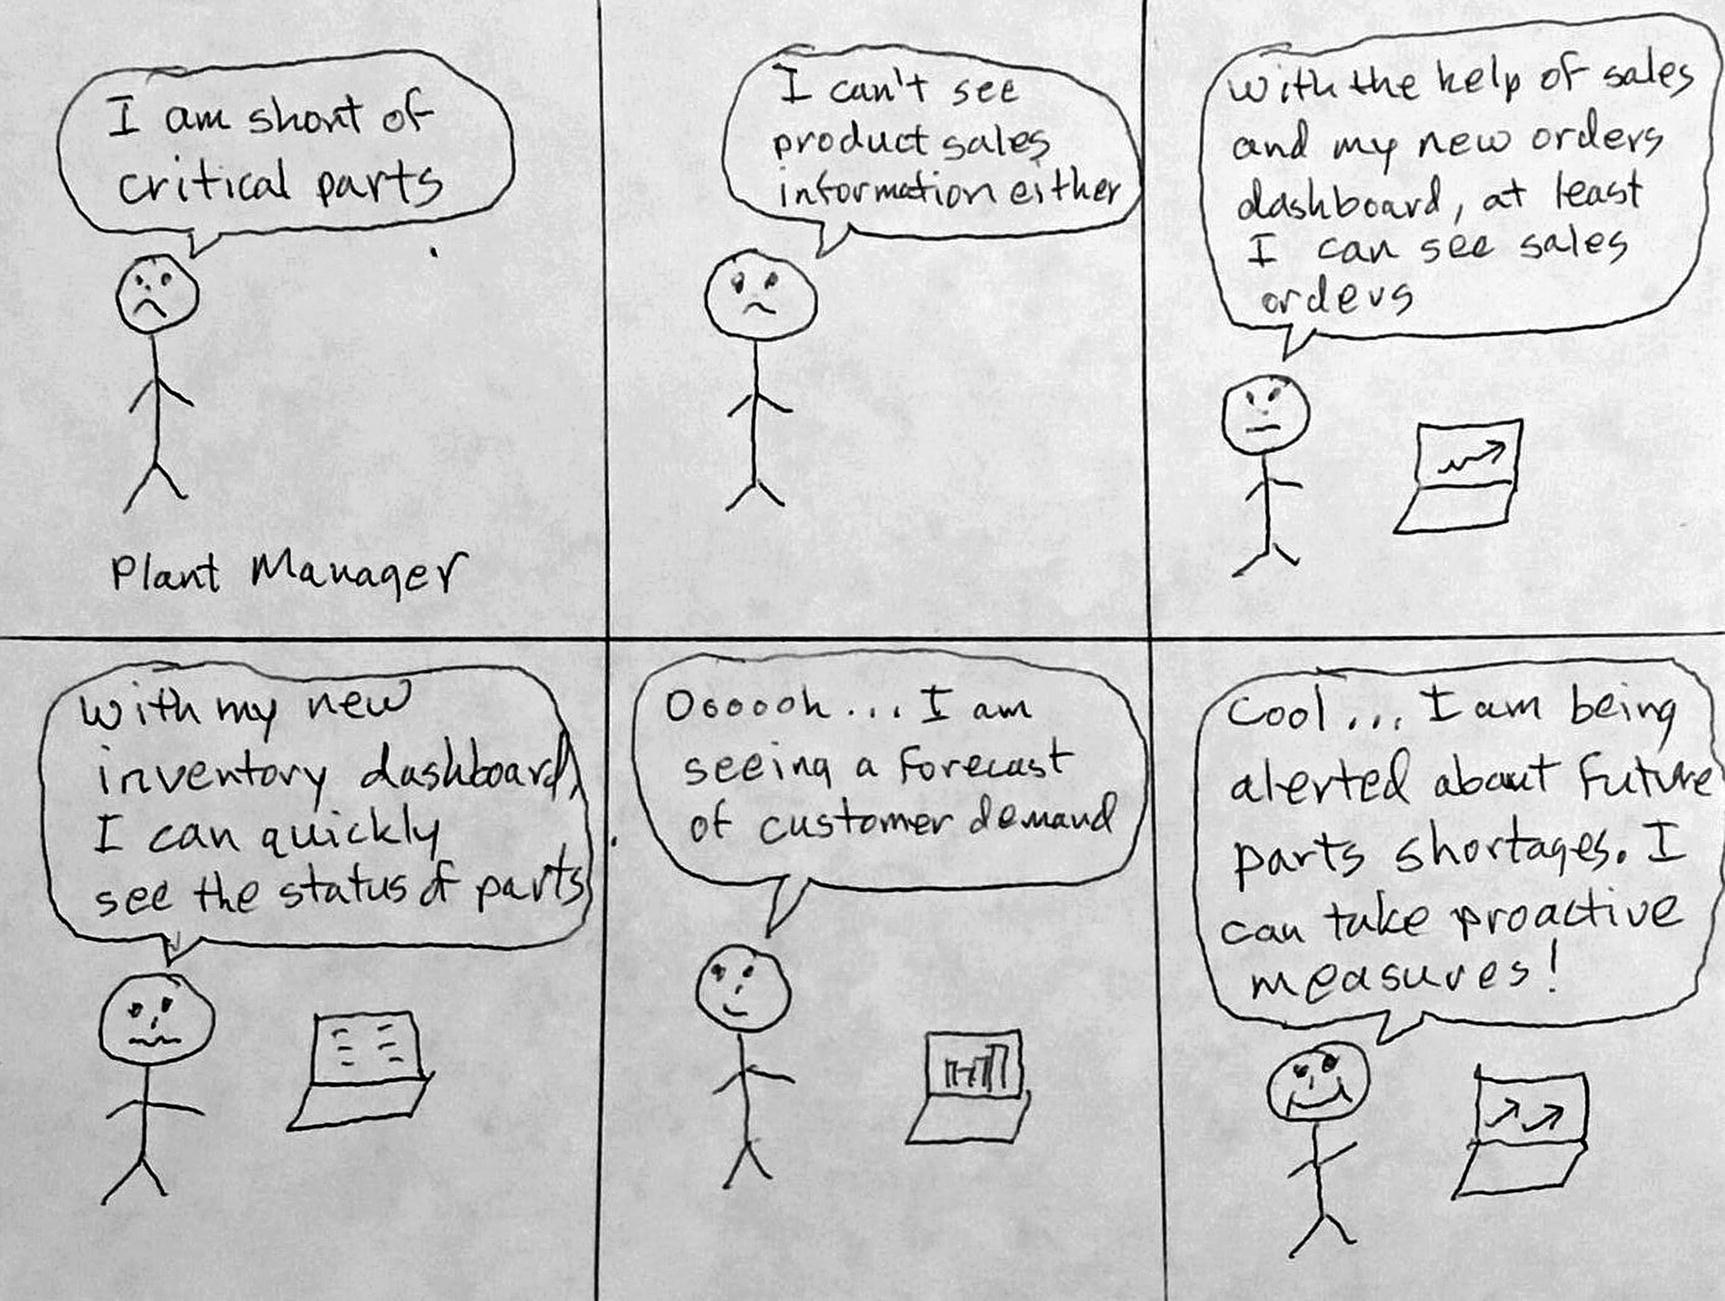
Storyboard for supply chain optimization example solution
Creating the storyboard usually takes about 15 to 20 minutes. When complete, a best practice is to have each participant read and show their storyboard. A vote is sometimes taken to choose the best one.
Concept posters are used to promote and explain a solution. The poster denotes what the solution is called and provides a solution illustration, a description of key stakeholders, a list of features and benefits, and a simplistic road map or timeline. It can be used to begin to gain agreement on the business need for the solution.
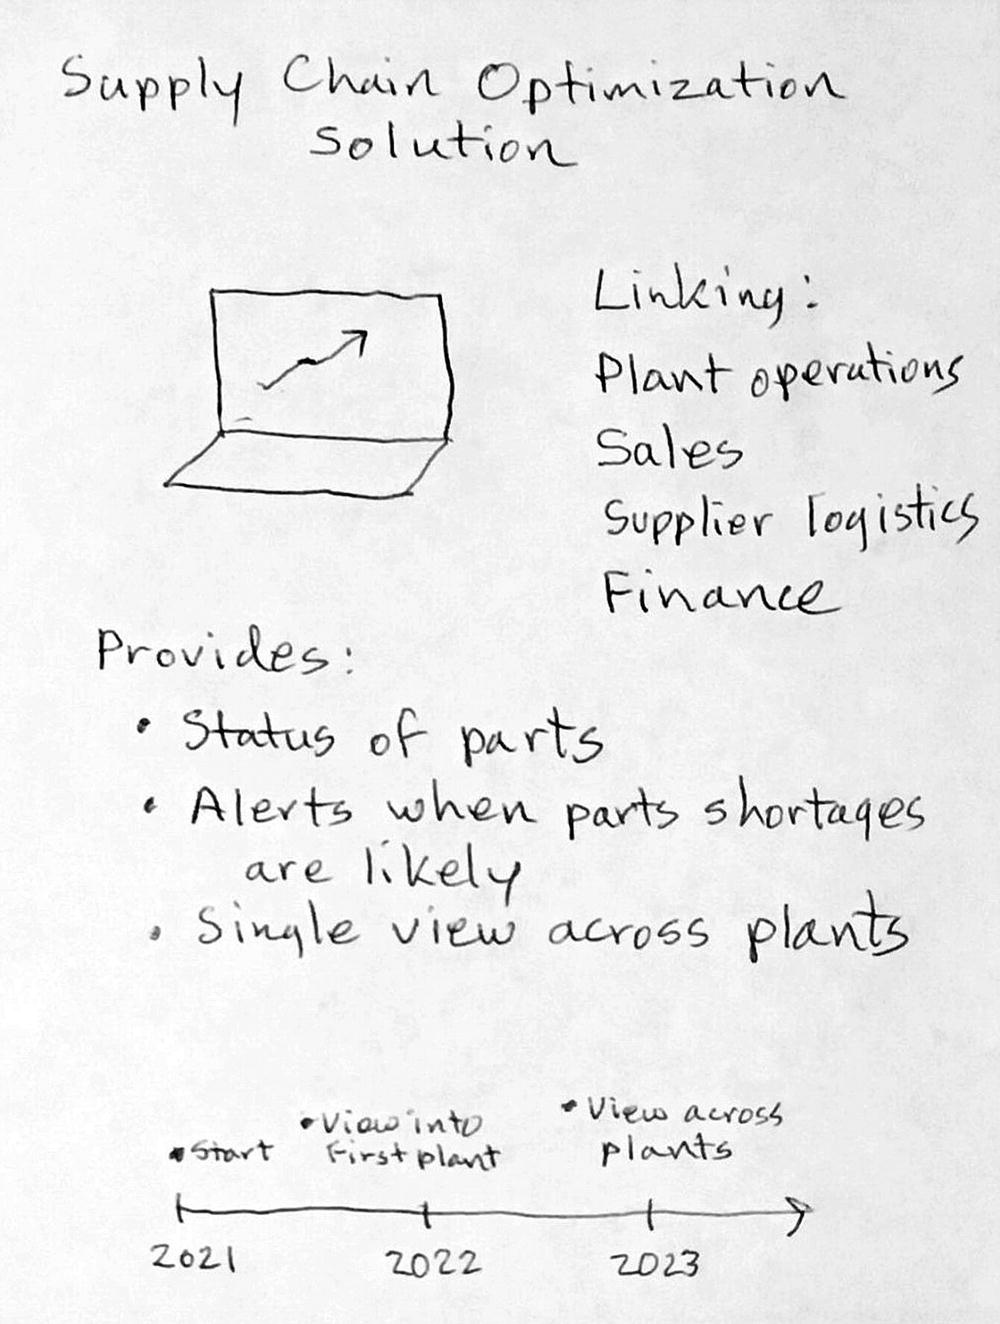
Concept poster for supply chain optimization example solution
Concept posters usually take a bit longer to develop than storyboards (about 45 minutes is typical). As with storyboards, each participant might be asked to present their poster and a vote can be taken to choose the best one.
Solution Evaluation
Outside feedback and iteration
Testable hypothesis
Value map framework
Our goal in doing this is to validate that we are on the right track before too much time and effort is put into subsequent steps beyond the Design Thinking workshop.
Method: Outside Feedback and Iteration
The solution that you are bringing forward can provide a great starting point to a development project. However, gathering outside critiques of the solution’s goals and functionality could lead to identifying a better workflow, improve usability, and grow the potential value.
Critical feedback is most effective when it is audible, actionable, and credible. It drives constructive discussion, removes blind spots, highlights opportunities for improvement, and builds alignment. One should not ask someone if they “like” the proposed solution as that will often only receive a polite “yes” and not make the solution better. Feedback requests require more structure to ensure that useful insight is obtained.
Outside feedback can be solicited from within the workshop or after the workshop ends. If solicited from within the workshop, this can involve providing remote conferencing into the workshop site. A review at this stage will likely require at least 30 minutes.
Keep in mind that whether you share solution progress from within the workshop or after, you need to have the right audience providing feedback. Try getting feedback from future users of the intended solution, especially if they are not present in the workshop, as they have a lot at stake. Also, solicit feedback from additional business stakeholders who might not be targeted to use the solution but who understand its potential importance to the business. Lastly, consider reviewing the solution with people who do not understand why it is needed. They might need a more in-depth explanation of the problem and the solution but that could provide insights that the others cannot provide.
Gain a commitment that honest feedback will be provided.
Explain the business problem space and the impact of not solving this problem.
Describe the solution using visualizations to help explain options.
Encourage the reviewer to ask clarifying questions during the presentation and avoid responding in a defensive manner.
After the presentation, ask the reviewer if there are any other questions and, once again, avoid responding in a defensive manner.
Ask for specific feedback about what they liked and why, simply taking notes while they speak.
Ask for feedback about what they did not like or what they found confusing or challenging, again simply taking notes.
Ask if they have any ideas for improvements and ask clarifying questions as needed.
Thank them and tell them that the gift of honest feedback will make the solution better.
The more comprehensive feedback that is received, the better the solution can become. A group that provides outside feedback can become a group of advocates when their suggestions are incorporated into the solution and they might also become willing test candidates for the solution.
Method: Testable Hypothesis
Assumptions made during the workshop are not always correct. If certain assumptions are driving the defined solution, it is a good idea to test their validity. If some of the assumptions are not valid, an adjustment in the solution might be required. Now is the time to explore these before solution development moves forward.
Our outside feedback group can be a useful audience when applying this method. Hypothesis statements are developed and provide a means of testing the assumptions. These statements take the form of “We believe that (a solution that serves someone) will deliver/is critical to (providing a benefit or value)” and “We will know that it is successful if (a measured success occurs).”
We believe that providing our suppliers with online access into our plant order status information is critical to eliminating parts shortages impacting our plant operators.
We know that we are successful if expected delivery dates are met and our manufacturing line is no longer idle due to a parts shortage.
Thus, we stated the belief, why it is important, and who it impacts. Then, we describe what we expect to achieve and the evidence that we would collect to prove it true. If we were to find that there was no way to prove our hypothesis, we would likely be heading in the wrong direction since our outcome would be unclear.
Method: Value Map Framework
Earlier in the workshop when we created the effort value matrix, we gained consensus about the relative value of various potential solutions (as well as their complexity). However, we have not explored their absolute value, something that will become important when we later build a business case that will help justify funding a project.
A value map framework can be used to provide an analytical view of the value of the solution. Tangible benefits such as revenue growth, cost savings, and improved productivity can be predicted and subsequently measured as the solution is developed and tested. Other benefits such as market share maintenance and risk mitigation might be more difficult to prove but could also provide value.
To use this method, each team begins by coming up with a list of projected benefits. On a sticky sheet, they then write the name of the solution at the top and then create a grid with five columns. Columns are labeled as business outcomes, strategies, tactics, key performance indicators (KPIs), and technology capabilities. Rows are the expected business benefit outcomes. The business benefit outcomes are filled into the left-hand column. Team members then use sticky notes to populate the other columns appropriately. After about 30 minutes, each team presents its results to the other teams. If multiple teams are working on the same solution, a single value map framework is created that combines the results of all the efforts.
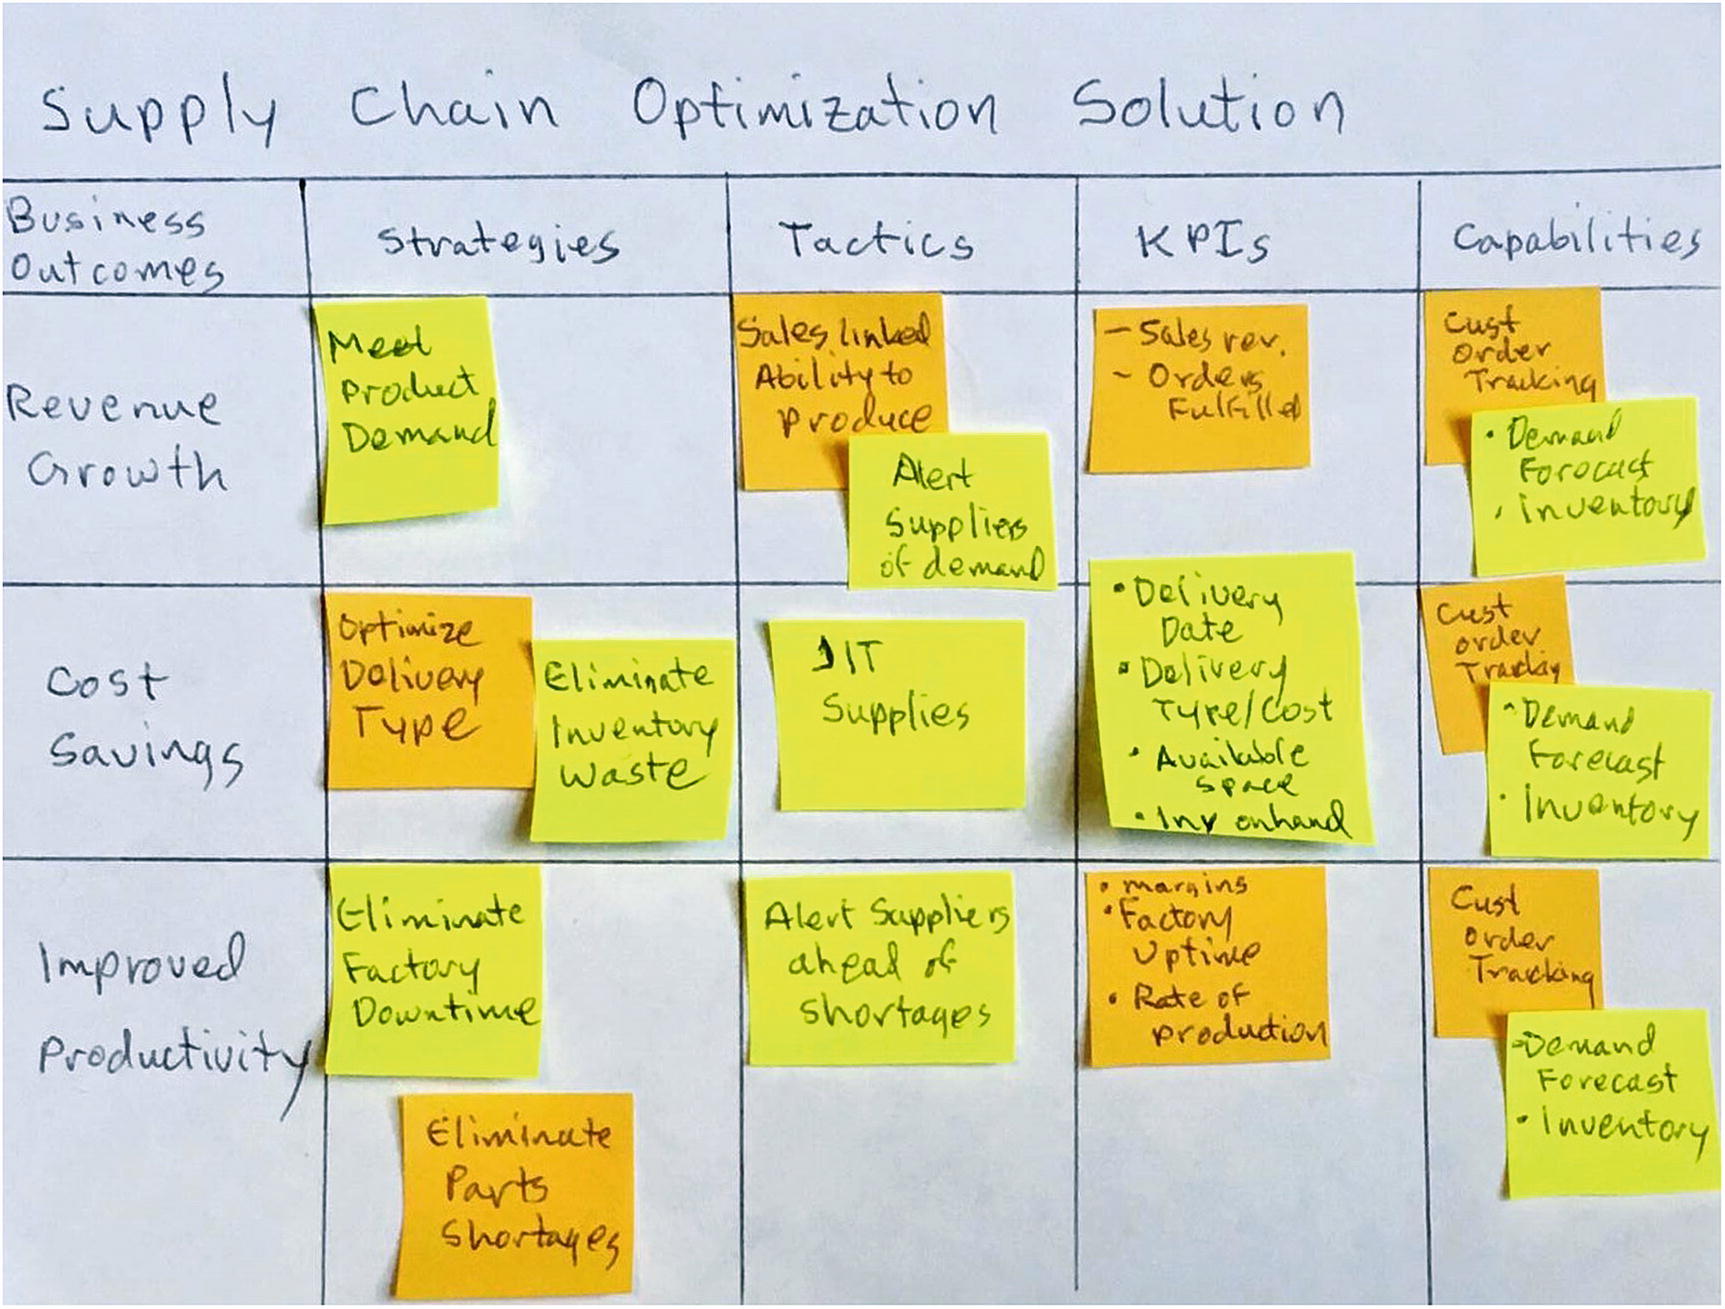
Value map for supply chain optimization example
Business value propositions should be able to be constructed into small statements that can serve as the basis for a business case using this information. The tactics, KPIs, and capabilities should help drive the prototype creation activity after the workshop concludes.
Now that we have identified some of the KPIs required, we could build another visualization that would serve as a mockup of a potential dashboard. This could be used to help guide prototype creation after the workshop ends.
Road Map and Close
The final step in a Design Thinking workshop is creation of a list of next steps that will provide a road map of solution development moving forward. Typically, one to three solutions are chosen to pursue further at this point. A key goal of this exercise is to gain commitment from participants to continue developing the solution(s). This step is led by the facilitator with all participants engaged in providing input.
We suggest that the following format should be adopted when capturing next steps planned for the top solution ideas. List each solution idea, and then provide a description of each. Be sure to reference any visuals created (such as the storyboard or concept poster) that help to explain the solution. Then indicate immediate tasks that need to be accomplished. Also indicate other tasks to follow next, and then tasks that need to be accomplished later. Assign an owner of the tasks who will be held accountable and lead the effort for each. Deadlines might also be noted for tasks when the scope for each is understood.
A facilitator might start gathering a list of next steps, including tasks and owners, prior to the end of the workshop. If that has occurred along the way, use this time at the end of the workshop to review the list and modify it as needed to define the road map.
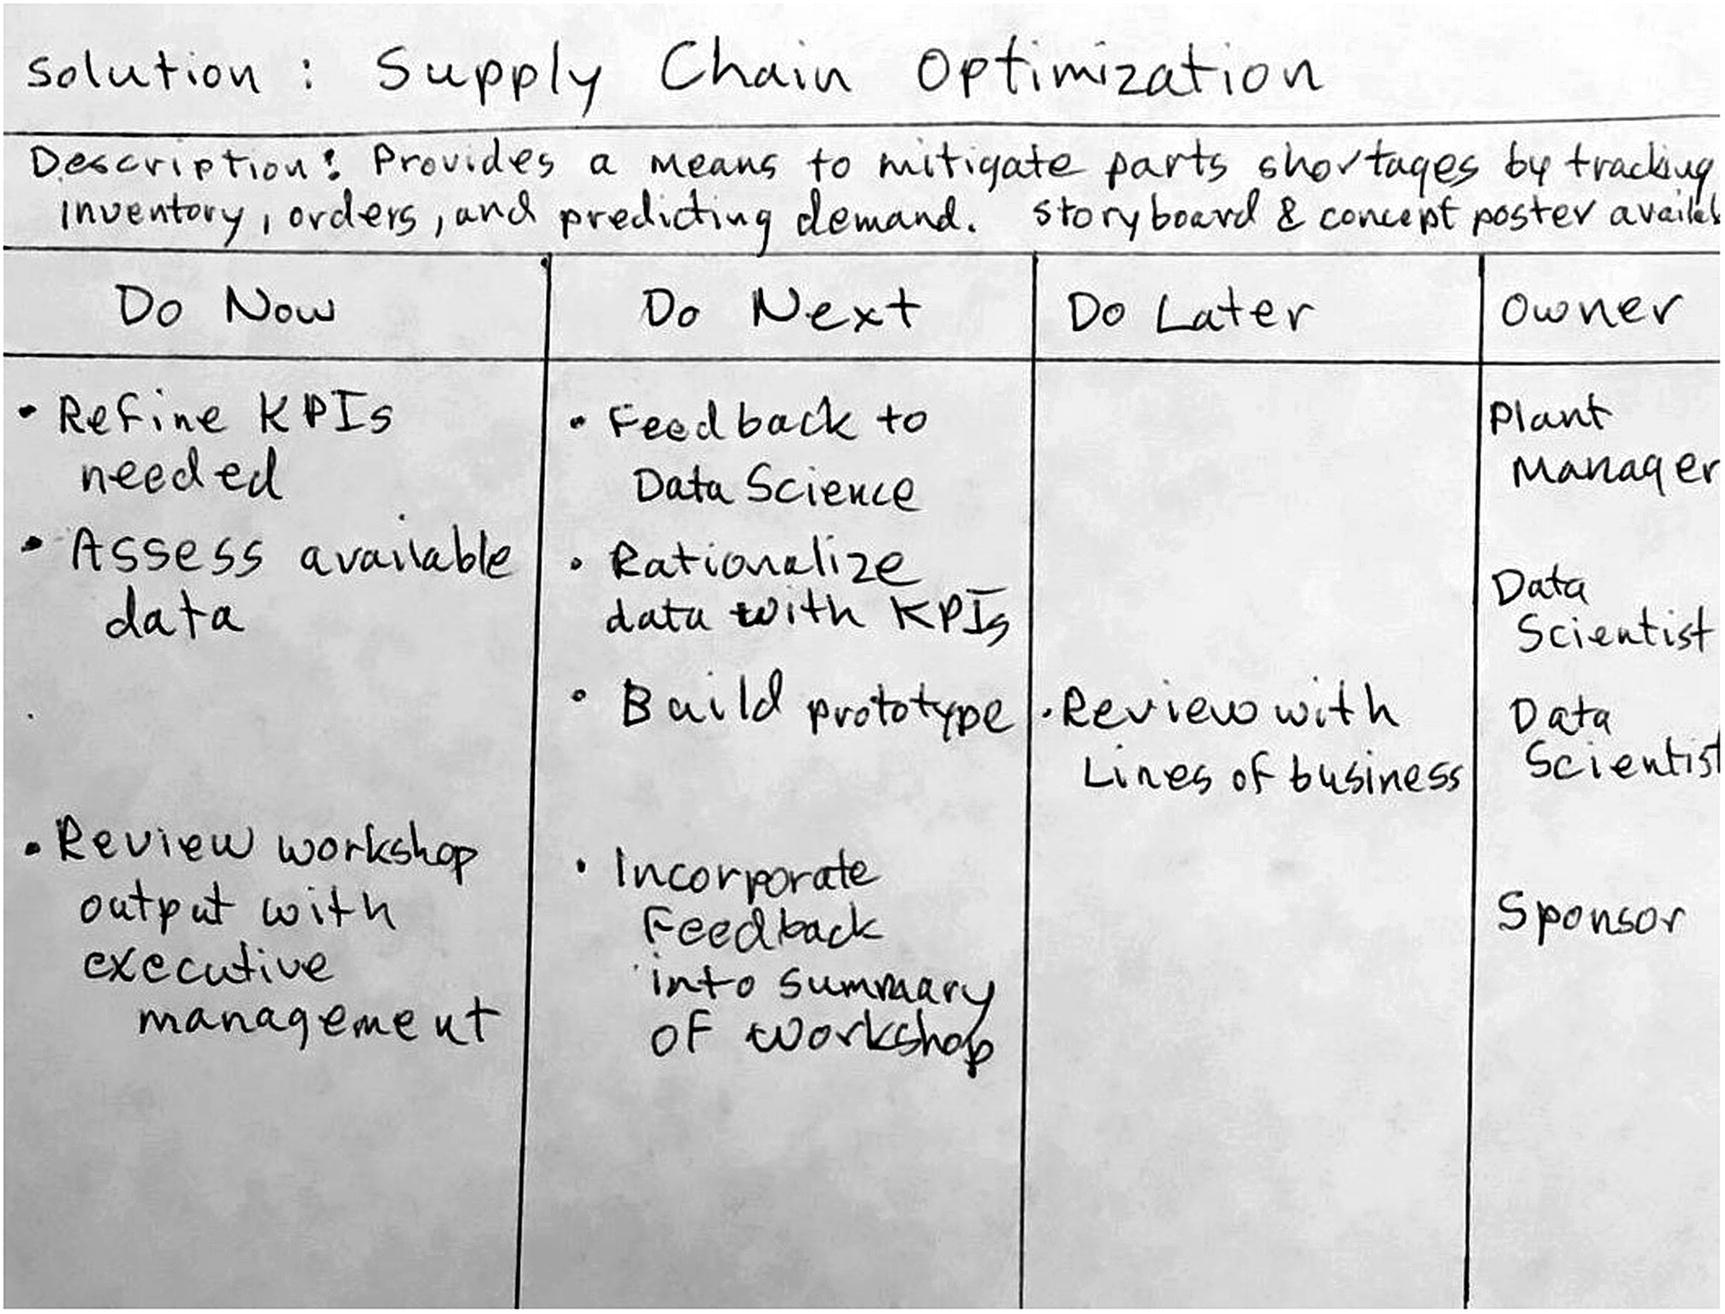
Road map of next steps for supply chain optimization example
The workshop can now conclude. The facilitator and sponsor(s) typically thank everyone for their time. The content from the workshop is then gathered into a small presentation to show what was accomplished. It is sent to participants along with another thank you note and the road map of what happens next.
Summary
Beginner’s mind – 10 to 30 minutes
Review data and research – 10 to 30 minutes
Outside perspective – 30 minutes
Lightning demos – 20 minutes to gather content, 3 minutes each present
Inspiration landscape – 30 minutes
Innovation ambition – 20- to 30-minute discussion
Creative matrix – 30 minutes
Effort value matrix – 15 to 20 minutes
Visualizations – 45 minutes
Outside feedback and iteration – 30-minute (minimum) discussion
Testable hypothesis – 20-minute discussion
Value map framework – 30 minutes
Road map – 30-minute discussion
Like the timing of the problem space exploration, the length of time for the solution space portion is variable depending on the number of teams and participants. You should plan on at least half a day for this portion of the workshop. Inclusion of multiple methods for reflection prior to starting solution space exploration and inviting outside parties for reviews via conference call meetings can greatly lengthen it.
You should now understand what is gained through a Design Thinking workshop and how the workshop is executed. In Chapter 5, we cover a logical next step in the development of many software and AI solutions, the creation of a prototype.